Study on nonlinear refractive properties of KDP and DKDP crystals

Duanliang Wangab, Tingbin Lic, Shenglai Wang*ab, Jiyang Wanga, Zhengping Wangab, Xinguang Xuab and Fang Zhangab
aState Key Laboratory of Crystal Materials, Crystal Institute, Shandong University, Jinan 250100, China. E-mail: slwang67@sdu.edu.cn
bKey Laboratory of Functional Crystal Materials and Device (Shandong University), Ministry of Education, Jinan, 250100, China
cChemistry and Materials Science, Taishan University, Taian, 271000, China

Received 22nd November 2015 , Accepted 6th January 2016

First published on 11th January 2016


Abstract

The nonlinear refractive index n2 is an important parameter for the nonlinear optical properties of a medium. This study primarily targets to measure the third-order nonlinear optical properties of potassium dihydrogen phosphate (KDP) and deuterated potassium dihydrogen phosphate (DKDP) with 70% deuteration content at λ = 532 nm using the Z-scan technique. The relationship between nonlinear refraction and direction has been studied in detail. Nonlinear refractive index n2, γ and third-order nonlinear susceptibilities xk3 (esu) were calculated through normalized transmittance curves and theoretical formulas. The results indicate that the nonlinear refractive indexes of KDP and DKDP are positive and possess obvious self-focusing effects in high-power laser systems.

1. Introduction

In recent years, particular interest has been shown in the exploration of the optical nonlinearity of materials. Nonlinear optical crystals, such as KTiOPO4 (KTP), LiB3O5 (LBO), β-BaB2O4 (BBO) and KBBF, have been discovered and have facilitated the development of the ultrafast laser pulse amplification technique.1–4 Potassium dihydrogen phosphate (KDP) and deuterated potassium dihydrogen phosphate (DKDP), which can be grown through the aqueous solution method, are extremely important nonlinear optical crystals. Because of their large nonlinear optical coefficients and electro-optic coefficients as well as their high laser damage thresholds, these crystals are currently applied in the areas of electro-optical switches and frequency conversion technology. With the development of high power laser technology, the large scale KDP and DKDP are applied to inertial confinement fusion (ICF) systems5–7 due to their exclusive properties. Nonlinear optical effects, which include self-phase modulation, self-focusing or dispersing effects, and nonlinear absorption, can be induced in crystals by laser radiation. In particular, self-phase modulation associated with the nonlinear refractive index may limit frequency conversion.8 Self-focusing, multi-photon absorption and electron avalanche breakdown may cause internal damage to crystals and limit their working life.9,10 To better understand nonlinear optical effects in KDP and DKDP crystals, it is essential to calculate the nonlinear refractive index associated with self-focusing effects. Methods such as nonlinear interferometry, degenerate four wave mixing (DFWM), the beam distortion method and the Z-scan technique10,11 are used to measure nonlinear refractive indices. Compared to the other methods, Z-scan has the advantage of high sensitivity and simplicity. Especially, the sign of the nonlinear refractive index can be distinguished through this method.

In this paper, the nonlinear refractive indexes n2 of KDP and DKDP single crystals are researched using the close aperture Z-scan technique. Under picosecond laser pulse illumination, specimens with different directions are measured at λ = 532 nm. From the results, the signs of the nonlinear refractive index n2 are discovered to be positive, indicating self-focusing effects in KDP and DKDP crystals. The corresponding n2 values and nonlinear optical susceptibilities xk3 (esu) with different directions are calculated, respectively. These results will provide important information for the applications of KDP and DKDP crystals, especially frequency conversion processes.

2. Experimental

Crystal growth

KDP and DKDP with 70% deuterium content crystals were grown from potassium dihydrogen phosphate solutions by a traditional temperature cooling method. The raw materials for KDP and DKDP crystal growth were high purity KH2PO4, deionized water and heavy water. Also, the deuterated aqueous solution was obtained by dissolving high purity KH2PO4 in heavy water and deionized water according to certain proportions. The deuterium content in the solution and crystals can be calculated from the formulas of (1) and (2) (ref. 12)
 
image file: c5ra24761f-t1.tif(1)
 
ω1(D) = 0.4766ω2(D) + 0.4969ω(D) + 0.0185 (2)
where n(D) and n(H) represent the number of deuterium atoms and hydrogen atoms, respectively. After that, the solutions were filtered using a 0.22 μm membrane and overheated for about 24 h. According to the process of temperature reduction, the growth of crystals was controlled along the z direction. The crystals were rotated in the mode of “forward-stop backward” and the speeds were about 77 rpm during the growth stage of the crystals. The temperature of the solution was controlled using a Shimada controller (FP21) with an accuracy of ±0.1 °C.

For the as-grown crystals, the phase purity was checked by X-ray powder diffraction (XRD) and the transmission spectrum was measured over the wavelength range of 195 nm to 800 nm.

Sample preparation

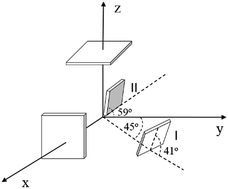
Table 1 lists the sizes of the specimens derived from the KDP and DKDP crystals. The specimens were well polished according to the experimental requirements. Fig. 1 shows the cutting schematic diagram for the KDP and DKDP crystals.
Table 1 Sizes of KDP and DKDP samples
Directions Z X I II
KDP (mm3) 10 × 10 × 1.5 (thickness)
DKDP (mm3)


image file: c5ra24761f-f1.tif
Fig. 1 Cutting schematic diagram of specimens for KDP and DKDP crystals.

The measurement mechanism of the nonlinear refractive index

In our work, the measurements of nonlinearities were carried out using the single beam Z-scan technique. A schematic diagram of the experimental set-up is shown in Fig. 2. The investigated samples were moved using a translation stage along the Z direction through the focal spot. D1 and D2, as photodiodes, were used to detect the energy of the original laser pulse and the pulse after the sample. The relationships between the corresponding sample positions and D2/D1 were presented on a computer. From the results, we could obtain information regarding the nonlinear refractive index of the sample.
image file: c5ra24761f-f2.tif
Fig. 2 Schematic diagram of experimental set-up of Z-scan. BS – beam splitter; D1 and D2 – detectors; TS – translation stage.

So far, a variety of laser sources with different pulse widths and wavelengths have been applied to measure the nonlinear refractive index.13,14,18 In an ICF system (pulse width on the nanoscale),15,16 KDP and DKDP crystals are mainly applied as the frequency doubler and frequency tripler for the Nd:YAG laser. During the process, the self-focusing effect caused by the short-wavelength (green light and ultraviolet) laser is an important factor which may lead to crystal damage. Meanwhile, a thermal effect (or cumulative effect) that limits the application of the crystals may occur. To avoid the influence of thermal effects (or cumulative effects), a laser with a lower repetition rate is more suitable for measuring the nonlinear refractions of KDP and DKDP crystals. Based on the practical application and laboratory conditions, a mode-locked Nd:YAG laser with a wavelength of 1064 nm (pulse duration of 20 ps and repetition rate of 10 Hz) was applied as the laser source. Also, the nonlinear refractive indexes of the specimens were investigated at the second harmonic wavelength, 532 nm. The focal length of the lens was 150 mm, the radius of the beam waist was 26 μm and the laser power density at the focal spot was approximately equal to 48 GW cm−2. The Rayleigh length z0 = πω0/λ was about 3.99 mm longer than the thickness of the specimens. CS2 solution was used as the benchmark for calibration and the nonlinear refractive index was calculated to be 1.33 × 10⁻¹¹ (esu) which is in good agreement with literature reports.11 Then the nonlinear refraction properties induced by the optical Kerr nonlinearity were acquired by closed aperture Z-scan measurement for all specimens.

According to the expressions given in the reference, the instantaneous input power within the sample and the linear transmittance after the aperture are expressed as11

 
image file: c5ra24761f-t2.tif(3)
 
image file: c5ra24761f-t3.tif(4)
where ω0, ra and ωa represent the radius of the beam waist, the aperture radius and the beam radius at the aperture in the linear regime, respectively. Considering the pulse temporal variation, the normalized transmittance related position z can be written as follows:17,18
 
image file: c5ra24761f-t4.tif(5)
where image file: c5ra24761f-t5.tif can be calculated.

3. Experimental results and discussion

XRD and transmission spectrum analysis

Fig. 3 shows the XRD patterns of the KDP and 70%-DKDP crystals. The X-ray analysis displays that the as-grown crystals are well formed, and all peaks are in accordance with each other except for the diffraction peak intensity. This phenomenon is due to substituting deuterium for hydrogen.
image file: c5ra24761f-f3.tif
Fig. 3 The X-ray diffraction patterns of the as-grown crystals.

The transmission spectra of the KDP and 70%-DKDP crystals are described in Fig. 4. In the wavelength range of 300 to 800 nm, it can be seen that there are relatively high transmittances and little difference between the as-grown crystals. Meanwhile, in the wavelength range of 200 to 300 nm, the transmittances decrease sharply. In general, the decrease of transmittance in the ultraviolet band is mainly caused by metal ion impurities.19


image file: c5ra24761f-f4.tif
Fig. 4 Transmission spectra of the as-grown crystals.

The nonlinear refractive indices of KDP and DKDP crystals

Fig. 5 shows the normalized transmittance curves of KDP specimens with different directions at λ = 532 nm. The red lines (fitting curves) stand for the theoretical results. The curves of the different specimens almost have the valley–peak configuration. The signal indicates that the nonlinear index of KDP is positive, exhibiting a self-focusing effect.13,17,20
image file: c5ra24761f-f5.tif
Fig. 5 Normalized transmittance curves of KDP crystals closed-aperture Z-scans at λ = 532 nm.

From the above results and eqn (5), the nonlinear refraction coefficient γ can be obtained with the following equation:11,16,17

 
image file: c5ra24761f-t6.tif(6)
where Leff = (1 − eαL)/α, α and I0(t) are the effective thickness of the sample, the linear absorption coefficient and the laser radiation intensity, respectively. In addition, n2 (esu) and γ (m2 W−1) could be connected through the conversion formula as follows:
 
image file: c5ra24761f-t7.tif(7)
where c denotes the speed of light in a vacuum. Accordingly, the third-order nonlinear susceptibility xk3 (esu) (the real part) of the material is calculated through the equation21–23
 
image file: c5ra24761f-t8.tif(8)

Table 2 presents the calculated results of the nonlinear optical parameters of KDP at λ = 532 nm. From the results, we could see that the Kerr nonlinearities of KDP crystal are related to the directions of the specimens. The nonlinear refractive index along the z-direction is larger than in the other directions, and the value of II-type is the smallest among the samples. Nonlinear susceptibility is also an important characteristic. Using eqn (8), the third-order nonlinear susceptibilities xk3 (esu) of KDP were also calculated. The rule is similar to the nonlinear refractive index. In short, a positive sign of the nonlinear refractive index (self-focusing Kerr effects) will be presented in KDP at a moderate laser pulse energy.

Table 2 The results of nonlinear optical parameters of KDP and DKDP crystals at λ = 532 nm
Directions KDP DKDP
γ (10−19 m2 W−1) n2 (10−13 esu) xk(3) (10−14 esu) γ (10−19 m2 W−1) n2 (10−13 esu) xk(3) (10−14 esu)
Z 1.48 5.27 8.34 1.16 4.12 6.51
X 0.90 3.21 5.08 1.15 4.09 6.46
I 0.87 3.10 4.90 0.89 3.16 4.99
II 0.71 2.54 4.02 0.66 2.35 3.71


Z-scan curves for the specimens of DKDP crystal at λ = 532 nm are presented in Fig. 6. We can calculate the nonlinear refractive index of a crystal by the normalized transmittance curves. The valley–peak configurations show that the nonlinear refractive index of DKDP is positive, which indicates that self-focusing effect will be introduced when the DKDP crystal is irradiated by high-power laser pulses. The values of n2, γ and xk(3) calculated at λ = 532 nm are presented in Table 2. From the results, it can be seen that the n2, γ and xk(3) of the z-direction are the largest among the specimens, while the values of II-type are the smallest.


image file: c5ra24761f-f6.tif
Fig. 6 Normalized transmittance curves of closed-aperture Z-scans of the DKDP crystals at λ = 532 nm.

Discussion

As can be seen from the above results, nonlinear optical properties at λ = 532 nm are clearly exhibited in KDP and DKDP crystals under the condition of high-power laser pulses. In particular, positive signs of the nonlinear refractive index n2 and optical Kerr effects will be induced in KDP and DKDP irradiated by picosecond pulses. The change in the nonlinear refractive index is caused by non-linear polarization of light field induction. In the process of high-power laser transmission through the KDP or DKDP crystals,5,24 the beam aberrations leading to the self-focusing become more obvious. The crystals play the role of additional lenses to focus the laser beam, which will lead to an increase in the power density of the beam center. This implies that the sample position corresponding to the beam center may be more vulnerable to damage. The crystals will be destroyed if the power density is greater than the laser damage threshold.25,26 Meanwhile, the nonlinear refractive index (or third-order nonlinear susceptibility) associated with self-phase modulation will affect the phase and intensity distribution of the laser beam. Moreover, the efficiency of frequency conversion processes may be limited for the applications of KDP and DKDP crystals.

From the calculated results for all the samples, it can be seen that the nonlinear refractive index n2 of the z-direction is significantly larger than the other directions for the KDP samples. The nonlinear refractive index of II-type is approximately equal to one half of the z-direction. In this regard, a similar rule can also be observed in the DKDP crystal. Anisotropy is an inherent quality of crystals. The principal axes coordinate to the tetragonal KDP and DKDP in the z-direction. Also, nonlinear refraction for KDP and DKDP is mainly associated with the distortion of the electron cloud (H2PO4 or D2PO4 groups), which can be caused by lasers. Therefore, a greater change in the nonlinear refraction may be caused by the laser along the z-direction.

Based on the above analysis, the nonlinear refractive properties caused by the high-power laser are closely associated with the directions. Crystal structure can play a crucial role in affecting the values of n2, especially the H2PO4 or D2PO4 groups. This also means that a II-type sample with a smaller degree of influence is more suitable for maintaining beam quality in the process of laser transmission. Taking self-phase modulation into account, the II-type samples of KDP or DKDP crystals are more suitable for applications as optical elements in high-power laser systems. Compared to other nonlinear optical crystals in Table 3, the values of the KDP and DKDP crystals are smaller than that of LiNbO3 and approximately equal with those of BBO and KBBF.4,21 This valuable information would be expected to increase our understanding of frequency conversion processes.

In addition, we realized that we can choose a crystal with smaller nonlinear parameters to avoid its negative influence on high power lasers. For example, we give priority to z-cut DKDP crystal as the electro-optic switch element in a Pockels cell due to its smaller nonlinear parameters, while the II crystals are the preferred choice as frequency conversion devices due to its smaller parameters. In the aspect of crystal growth, we can attempt to grow crystals in different directions according to the desired application.

Table 3 Nonlinear optical parameters of several nonlinear optical crystals
Crystal γ (10−20 m2 W−1) n2 (10−13 esu) xk(3) (10−14 esu)
LiNbO3 (ref. 18) (λ = 532 nm) 26.6 14.2 33.7
BBO18 (λ = 532 nm) 8.0 3.2 5.7
KBBF4 (λ = 355 nm) 17.5 ± 0.35 9.4


Furthermore, the self-focusing effect caused by nonlinear refraction will lead to an increase in the laser intensity near the convergent region. When the laser pulse passes through the crystals, laser induced damage may be produced. Therefore, improving the laser damage threshold of crystals is the key factor for preventing laser induced damage by self-focusing effects. Improving the quality of crystals, such as improving the crystal homogeneity, reducing defects, and using proper laser processes, is an effective way to reduce self-focusing effects. In this way, the applications of crystals can be extended under the conditions of high-power lasers. Laser power consumption, which can affect the beam quality, will be reduced. In short, nonlinear refractive properties, which are worth considering, play a vital role in the applications of KDP and DKDP crystals.

4. Conclusions

The nonlinear refractive properties of KDP and DKDP (70% deuteration content) crystals, at a wavelength of λ = 532 nm with a 20 ps pulse width and 10 Hz repetition rate, were determined utilizing a short pulse Z-scan technique. Positive nonlinear refraction properties were discovered, and this information indicated that self-focusing effects would be present for the application of KDP and DKDP crystals. In addition, the nonlinear refractive indices and third-order nonlinear susceptibilities related to the directions of the processed samples were calculated. The behavior for DKDP crystal was analogous to KDP. The calculated results demonstrated that the nonlinear refractive indexes for KDP and DKDP crystals extended from 2.54 × 10⁻¹³ esu to 5.27 × 10⁻¹³ esu and from 2.35 × 10⁻¹³ esu to 4.12 × 10⁻¹³ esu, respectively. The third-order nonlinear susceptibilities for KDP and DKDP crystals varied from 4.02 × 10⁻¹⁴ esu to 8.34 × 10⁻¹⁴ esu and from 3.71 × 10⁻¹⁴ esu to 6.51 × 10⁻¹⁴ esu, respectively. Compared to the calculated results, the nonlinear refractive index of II-type was the minimum value among the experimental specimens for KDP or DKDP. Therefore, studies of nonlinear refractive properties as an important factor play a great role in understanding the interaction between KDP or DKDP crystals and high-power laser pulses.

Acknowledgements

This study has been supported by the National Natural Science Foundation of China (NSFC) under Grant No.51321091, 50721002 and 51202131.

Notes and references

  1. Z. Y. Ou, S. F. Pereira, E. S. Polzik and H. J. Kimble, Opt. Lett., 1992, 17, 640 CrossRef CAS PubMed.
  2. C. T. Chen, Y. C. Wu, A. D. Jiang, B. C. Wu, G. M. You, R. K. Li and S. J. Lin, J. Opt. Soc. Am. B, 1989, 6, 616–621 CrossRef CAS.
  3. L. K. Cheng, W. R. Bosenberg and C. L. Tang, Prog. Cryst. Growth Charact., 1990, 20, 9–57 CrossRef CAS.
  4. F. Q. Li, N. Zong, F. F. Zhang, J. Yang, F. Yang, Q. J. Peng, D. F. Cui, J. Y. Zhang, X. Y. Wang, C. T. Chen and Z. Y. Xu, Appl. Phys. B, 2012, 108, 301 CrossRef CAS.
  5. J. J. De Yoreo, A. K. Burnham and P. K. Whitman, Int. Mater. Rev., 2002, 47, 113 CrossRef CAS.
  6. H. Tu, Y. Zhao, Y. C. Yue, F. D. Fan and Z. G. Hu, CrystEngComm, 2015, 17, 6669 RSC.
  7. J. M. Auerbach, D. Milam and C. E. Barker, Special Issue: Computational Advances in ICF, 1996, vol. 6, p. 199 Search PubMed.
  8. L. Zheng and D. D. Meyerhofer, LLE Review, 1998, vol. 74, p. 125 Search PubMed.
  9. S. L. Wang, Z. S. Gao, Y. J. Fu, A. D. Duan, X. Sun, C. S. Fang and X. Q. Wang, Cryst. Res. Technol., 2003, 38, 941 CrossRef CAS.
  10. C. E. Barker, R. A. Sacks, B. M. Van Wonterghem, J. A. Caird, J. R. Murray, J. H. Campbell, K. Kyle, R. B. Ehrlich and N. D. Nielsen, Proc. SPIE, 1995, 2633, 501 CrossRef CAS.
  11. M. Sheik-Bahae, A. A. Said, T. H. Wei, D. J. Hagan and E. W. Van Stryland, IEEE J. Quantum Electron., 1990, 26, 760 CrossRef CAS.
  12. G. M. Loiacono, J. F. Balascio and W. Osborne, Appl. Phys. Lett., 1974, 24, 455 CrossRef CAS.
  13. S. B. Lu, C. J. Zhao, Y. H. Zou, S. Q. Chen, Y. Chen, Y. Li, H. Zhang, S. C. Wen and D. Y. Tang, Opt. Express, 2013, 21(2), 2072 CrossRef CAS PubMed.
  14. M. Y. Peng, Q. Z. Zhao, J. R. Qiu and L. Wondraczek, J. Am. Ceram. Soc., 2009, 92(2), 542 CrossRef CAS.
  15. H. Yoshida, T. Jitsuno, H. Fujita, M. Nakatsuka1, M. Yoshimura, T. Sasaki and K. Yoshida, Appl. Phys. B, 2000, 70, 195 CrossRef CAS.
  16. B. M. Van Wonterghem, J. R. Murray, J. H. Campbell, D. Ralph Speck, C. E. Barker, I. C. Smith, D. F. Browning and W. C. Behrendt, Appl. Opt., 1997, 36, 4932 CrossRef CAS PubMed.
  17. M. Sheik-bahae, A. A. Said and E. W. Van Stryland, Opt. Lett., 1989, 14, 955 CrossRef CAS PubMed.
  18. M. Yin, H. P. Li, S. H. Tang and W. Ji, Appl. Phys. B, 2000, 70, 587 CrossRef CAS.
  19. S. J. Zhu, S. L. Wang, J. X. Ding, G. X. Liu, W. J. Liu, L. Liu, D. L. Wang, W. D. Li, Q. T. Gu and X. G. Xu, J. Cryst. Growth, 2014, 388, 98 CrossRef CAS.
  20. I. Papagiannouliab, A. B. Bourlinosc, A. Bakandritsosd and S. Couris, RSC Adv., 2014, 4, 40152 RSC.
  21. R. A. Ganeev, I. A. Kulagin, A. I. Ryasnyansky, R. I. Tugushev and T. Usmanov, Opt. Commun., 2004, 229, 403 CrossRef CAS.
  22. G. Yang, W. T. Wang, L. Yan, H. B. Lu, G. Z. Yang and Z. H. Chen, Opt. Commun., 2002, 209, 445 CrossRef CAS.
  23. M. Grehn, T. Seuthe, W. J. Tsai, M. Höfner, A. Achtstein, A. Mermillod-Blondin, M. Eberstein, H. Eichler and J. Bonse, Opt. Mater. Express, 2013, 3(12), 2132 CrossRef.
  24. R. A. Hawley-Fedder, P. Geraghty, S. N. Locke, M. S. McBurney, M. J. Runkel and T. I. Suratwala, Proc. SPIE, 2004, 5341, 121 CrossRef CAS.
  25. H. Yoshida, T. Jitsuno, H. Fujita, M. Nakatsuka, M. Yoshimura, T. Sasaki and K. Yoshida, Appl. Phys. B, 2000, 70, 195 CrossRef CAS.
  26. A. K. Burnham, M. Runkel, M. D. Feit, A. M. Rubenchik, R. L. Floyd, T. A. Land and W. J. Siekhaus, Appl. Opt., 2003, 42, 5483 CrossRef CAS PubMed.

This journal is © The Royal Society of Chemistry 2016
Click here to see how this site uses Cookies. View our privacy policy here.