
A monolithic three-dimensional macroporous graphene anode with low cost for high performance microbial fuel cells†
Lihua Huangabcd,
Xiufen Li*acd,
Yueping Renacd and
Xinhua Wangacd
aLaboratory of Environmental Biotechnology, School of Environmental and Civil Engineering, Jiangnan University, Wuxi 214122, PR China. E-mail: xfli@jiangnan.edu.cn; Tel: +86 510 85326516
bSchool of Life Science, Linyi University, Linyi 276005, PR China
cJiangsu Key Laboratory of Anaerobic Biotechnology, Wuxi 214122, PR China
dJiangsu Cooperative Innovation Center of Technology and Material of Water Treatment, Suzhou 215009, PR China
First published on 4th February 2016
Abstract
Microbial fuel cells (MFCs), capable of simultaneously degrading substrates and producing bioelectricity, have drawn great attention. However, low power output and high cost have severely hindered their practical application. The present study prepared a monolithic three-dimensional graphene (3D-G) electrode through a self-assembly method. The as-prepared 3D-G electrode featured inflexibility, a crumpled surface, a macroporous structure (with pore spaces of dozens of microns), high specific surface area (188.32 m2 g−1), good conductivity and low cost, favoring high bacterial loading capacity and enhancing the extracellular electron transfer (EET) efficiency. Equipped with the prepared 3D-G anode in an air-cathode single chamber MFC reactor, the maximum power density (Pmax) increased to 1516 ± 87 mW m−2 in the 3D-G reactor from 877 ± 57 mW m−2 in the graphite felt (GF) control and from 584 ± 39 mW m−2 in the carbon cloth (CC) control after 2 weeks of operation. Moreover, the Pmax of the reactor with the 3D-G anode decreased only by 15% after 2 months of operation, which showed durability of the anode due to having macropores which are not easily blocked. Normalized to the cost of the anode, the Pmax in the 3D-G reactor was 93 and 133 times those in the GF and CC reactors, respectively. Dynamic analysis results (CV, Tafel and EIS) showed that the 3D-G anode improved the efficiency of EET due to having an appropriate structure and good conductivity. The 3D-G anode, with superior performance and low cost, would powerfully promote the practical and large-scale application of MFCs.
1. Introduction
It is generally recognized that alternative sources of energy are urgently required because non-renewable fossil fuels are unsustainable, particularly in view of the rapid growth in energy consumption in many emerging and developing countries. On the other hand, severe environmental pollution occurs due to the combustion of fossil fuels, threatening human health. So, some research has been conducted to probe new solutions for new energy. Biomass and bio-related waste which are available in abundance promise an eco-friendly solution to the increasing demand for sustainable alternative energy sources.1,2 A microbial fuel cell (MFC) is a technology that can simultaneously degrade biomass or bio-related waste and generate bioelectricity. The exoelectrogens in the anode chamber of a MFC reactor are prone to anaerobically decomposing substrates and directly or indirectly transfer the released electrons towards the anode. The electrons are further transferred to the cathode via the external circuit, where they ultimately combine with H+ and an electron acceptor (such as O2) to form water. In a MFC, the potential difference between the anode (electron donor) and cathode (electron acceptor) determines the outputted cell voltage. The electrical power produced by a MFC is based on the rate of electrons moving through the circuit and the electrochemical potential difference across the electrodes.3,4 Afterwards, practical applications are then envisioned to be feasible on the basis of the development of a mediatorless air-cathode single chamber MFC. However, their relatively low power density and high cost limit the practical application of MFC technology.5,6The anode provides the growth site for exoelectrogens and further affects the extracellular electron transfer (EET) efficiency or electrogenesis. So, various strategies have been developed to obtain a qualified anode with high performance and low cost.7 Currently, the most commonly used anode materials are carbon or graphite-based electrodes.8–10 To improve the performance, inert carbon or graphite electrodes have previously been treated physicochemically or coated with other materials conducive to electrogenesis. Physicochemical treatments include high temperature treatment,11 heat treatment with ammonia,12 strong acid treatment,13 and electrochemical oxidation.14 Electron mediators,15 carbon nanotubes,16 activated carbon nanofiber,17 conducting polymers,18 metal or metal oxide,19 and N-functional groups20 have usually been used as materials for surface modification.
Graphene is a single atomic layer of carbon atoms arranged in a hexagonal lattice, with unique properties such as good conductivity, extremely high specific surface area (up to 2600 m2 g−1), and chemical inertness.21,22 Therefore, graphene has been applied in the modification of conventional anodes, such as stainless steel mesh, carbon cloth (CC) and graphite felt (GF)23–25 via mechanical or electrochemical methods. However, the performance of a graphene-modified anode heavily depends on the structure and features of the base material, without fully displaying the high specific surface area and outstanding conductivity of graphene. If graphene can be prepared and independently used as a MFC anode, the superior properties of graphene would be demonstrated. He et al. utilized the self-assembly technique induced by ice segregation to prepare a novel three-dimensional (3D) chitosan/vacuum-stripped graphene (CHI/VSG) scaffold showing elasticity and a layer spacing of 30–50 μm for use as a MFC anode.26 Xie et al. obtained a graphene–sponge–stainless steel composite anode.27 Yong et al. fabricated a novel 3D graphene/PANI structure with the aid of a nickel foam substrate, exhibiting a honeycomb structure with a pore size of 100–300 μm and a specific surface area of 850 m2 g−1.28 However, the above-mentioned preparation processes are complex and usually need organic precursors (chitosan in ref. 26) or a template (a sponge in ref. 27, and nickel foam in ref. 28). Furthermore, the above-mentioned 3D graphene anodes demonstrated elasticity and were easily deformed or damaged by exterior forces (such as hydraulic scouring), resulting in weak bonding with wires. So, a highly flexible electrode is not suitable to serve as an anode in a MFC reactor, especially in the field of practical application.
In this study, a simple method was developed for preparing free-standing monolithic three-dimensional graphene (3D-G) showing inflexibility, a macroporous structure, a crumpled matrix and good conductivity at low cost. Due to hydrophobic forces and π–π stacking between the two-dimensional (2D) mono-layer graphene nanosheets,29 the 2D mono-layer graphene nanosheets in high concentration aqueous dispersions tend to restack irreversibly to form multi-layer graphene nanosheets, and then multi-layer graphene nanosheets, as the basic structural unit, further interconnect to form a hierarchically macroporous scaffold via self-assembly after a certain period of time. The as-prepared 3D-G electrode was composed of multi-layer graphene nanosheets, leading to the smaller specific surface area of 188.32 m2 g−1 compared with graphene foam (850 m2 g−1),28 however, inflexibility of the 3D-G electrode was achieved. The prepared 3D-G base can independently serve as the anode in a MFC reactor and has the capability of improving electrogenesis.
2. Materials and methods
2.1. Preparation of the 3D-G anode
The graphite oxide and 2D graphene nanosheets were prepared using the method described by Marcano et al.30 In order to prepare 3D-G, a high concentration graphene solution was necessary. Firstly, 0.5 g of graphite oxide was dispersed in 100 mL of deionized water in a 100 mL beaker, exfoliated in a Sonifier (KQ500DA, Kunshan, China) for 3 h at 400 W, followed by addition of 0.6 mL of 85% hydrazine hydrate and then reacted for 1 h at 90 °C to obtain a high concentration graphene solution. Secondly, the self-assembly process was conducted statically for 12 h at 30 °C, and then the monolithic 3D-G electrode filled with water was obtained, wherein enough time and moderate temperature were very critical. The schematic diagram of the self-assembly process is shown in Scheme S1.† Subsequently, the as-prepared 3D-G macro-assembly was pre-frozen at −60 °C for 24 h, vacuum-freeze-dried for 24 h (Freezone 1L, Labconco, USA), and finally the 3D-G macro-assembly was obtained. The 3D-G anode was obtained by cutting to the size of 30 mm × 5 mm (diameter × thickness). All of the reagents above were of analytical grade.2.2. Setup and operation
An air-cathode single chamber MFC reactor with an internal volume of 28 mL was used in this study as previously reported.31 GF (Beijing Sanye Carbon Co., Ltd) and non-watertight CC (HCP 330N, Shanghai Hesen Electric Co., Ltd) anodes with the same diameter (30 mm) were used as controls. The cathode was made through applying platinum powder (0.5 mg cm−2 Pt, Hispec 3000, Shanghai Hesen Electric Co., Ltd) and four diffusion layers (polytetrafluoroethylene, PTFE) on 30 wt% watertight CC (HCP 330P, Shanghai Hesen Electric Co., Ltd) as previously described.32 The MFC reactor was inoculated with 14.0 mL of effluent from the existing well-running MFC reactor (originally seeded with Taihu Lake sediment, China) in our lab. The reactor was fed with a culture medium with a conductivity of 7.0 mS cm−1 (EC300A, Ecosense), which contained 1 g L−1 of sodium acetate, 2.77 g L−1 of NaH2PO4·2H2O, 11.40 g L−1 of Na2HPO4·12H2O, 0.31 g L−1 of NH4Cl and 0.13 g L−1 of KCl, followed by the addition of 5 mL L−1 of vitamin and 12.5 mL L−1 of trace mineral. Vitamins and trace minerals were prepared as previously described.31 The pH was adjusted to 7.0. Conventional electrodes such as CC and GF were selected as the control anodes in this study. All the MFC reactors were operated with batch mode and the temperature was maintained at 30 ± 1 °C. When the outputted voltage declined to below 20 mV across an external resistance of 1 kΩ, a complete cycle was over.2.3. Analysis
The morphology of the bare and cultured anodes was imaged using scanning electron microscopy (SEM, S-4800, Hitachi). Before SEM observation, the cultured anodes were immersed in 2.5% glutaraldehyde solution for 1.5 h at 4 °C, chemically dehydrated using graded ethanol, and finally dried in air.33 Nitrogen adsorption/desorption isotherms were recorded with a commercial specific surface area and porosity analyzer (ASAP 2020, Micromeritics Instrument) at 77 K. The specific surface area was calculated using the Brunauer–Emmett–Teller (BET) equation.34 Raman spectra of the 2D graphene nanosheets and 3D-G were recorded at 532 nm with a spectrograph (Renishaw).35 An atomic force microscopy (AFM, Dimension Icon, Bruker) image was taken in the tapping mode with standard silicon nitride tips. 50 mg of graphene was dissolved in 5 mL of N-methylpyrrolidone, ultrasonically treated for 5 min, and the 3D-G dispersion solution was obtained. 1 μL of the dispersion was transferred onto the mica plate, and air-dried for 24 h.36 The adhesion of cells on various anodes was imaged using confocal laser scanning microscopy (CLSM, ZEISS LSM 710). The fluorochrome of SYTO 63 (20 μmol L−1) was used to stain the total cells. After staining, the samples were incubated for 30 min at room temperature in darkness, and washed twice with 0.05 mol L−1 phosphate buffer solution (PBS) to remove the extra stain. The CLSM image was taken in multi-track mode, and the excitation and emission wavelengths were 638 and 650–700 nm.37Cell voltage (mV) was automatically recorded using a data acquisition unit (34972A, Agilent). All the electrochemical analysis was performed using an electrochemical workstation (CHI660D, Shanghai Chenhua Instruments Co., Ltd) with a three-electrode model, wherein the anode served as the working electrode, Pt wire with the size of 0.5 mm × 37 mm (diameter × length) (Wuhan Gaoss Union Science and Technology Co., Ltd) was as the counter electrode and saturated calomel electrode (SCE, type of 232, 0.2244 V vs. SHE, Shanghai Leici) was the reference electrode. In this study, an electrochemical test in an abiotic system was also performed in the MFC reactor, rather than in the special electrochemical cell, for the purpose of making the testing result closer to the actual system. Polarization and power density curves were measured using linear scanning voltammetry (LSV) at a scanning rate of 1 mV s−1,38 while the individual electrode potential was recorded using another electrochemical workstation. The current density and power density were calculated based on the literature.39 The biomass density was determined using the lipid-phosphorus method.40 After operation, the cultured anode was removed from the MFC reactor, then most of the cultured anode was cut for phospholipid analysis. The remainder of the cultured anode was used for SEM and CLSM analysis.
Using oxygen as an electron acceptor, coulombic efficiency (CE) was calculated based on the chemical oxygen demand (COD) removal with a method described by Kim et al.41 COD was determined using the standard method.42 Electrochemical impedance spectroscopy (EIS) was conducted in both the abiotic system and biotic system over a frequency range of 1 × 10⁵ to 0.005 Hz under open-circuit voltage, with a sinusoidal perturbation amplitude of 10 mV.43 Turnover cyclic voltammetry (CV) was performed after the outputted voltage approached a stable plateau. To avoid interference, a culture medium free of sodium acetate and mineral solution was used during non-turnover CV at a scanning rate of 1 mV s−1.44 A Tafel plot was recorded under a scanning rate of 1 mV s−1.45 Before electrochemical measurements, all of the MFC reactors were operated in open-circuit mode for over 1 h. All the tests in the biotic system were conducted in triplicate based on three consecutive operation cycles, and the mean values are reported.
3. Results and discussion
3.1. Physicochemical characteristics of the 3D-G electrode
The macrostructure of the as-prepared 3D-G electrode (≈30 mm in diameter) displayed a honeycomb texture (Fig. 1a), and had the capability of supporting a weight of 100 g without deformation (Fig. 1b), providing a mechanically stable scaffold compared with elastic graphene foam.26,28 SEM images revealed that the 3D-G electrode consisted of crumpled graphene nanosheets (Fig. 1c and d). Compared to transparent mono-layer graphene nanosheets,46 it was speculated that the crumpled graphene nanosheets in the multi-layer were the structural basis for the inflexible monolithic 3D-G electrode. There were ample interspaces dozens of microns in size (in Fig. 1c and d) between the multi-layer graphene nanosheets, which interconnected (white circles in Fig. 1d), ensuring a macroporous 3D-G electrode structure and as a whole. Because interspaces in the 3D-G electrode are much larger than bacteria (1–2 μm), bacteria can easily diffuse in and colonize on/within the 3D-G electrode and efficiently make use of the available area for the attached growth of biofilm. In addition, such a macroporous structure guaranteed unhindered substrate transport. The CC control was composed of densely arranged carbon fibers (Fig. 1e), resulting in smaller interspaces between the carbon fibers, so the bacteria cannot easily enter into the inside of the CC to form a biofilm. For that reason, it was considered to be the 2D control in this study. The GF control consisted of graphite fibers with interspaces of ≈50 μm (Fig. 1f), which is large enough for bacteria to adhere without a mass transfer limitation. This was regarded as the 3D control. | ||
| Fig. 1 Photographic images of the bare 3D-G electrode (a, b). SEM images of the bare 3D-G electrode ((c) exterior and (d) interior) as well as the CC (e) and GF (f) controls. | ||
The BET specific surface area for the 3D-G electrode was 188.32 m2 g−1, based on nitrogen adsorption–desorption isotherms (Fig. S1†). This value is much less than the reported surface area of mono-layer graphene (2600 m2 g−1), likely resulting from the 3D-G electrode being composed of multi-layer graphene nanosheets. However, it is much larger than those of the CC and GF controls, and its total surface area is approximately 72 and 157 times those for the GF and CC controls (Table 1). It is worth noting that the 3D-G electrode possessed inflexibility at the cost of specific surface area. EIS was applied to analyze the resistance distribution of the bare anode in 1 mol L−1 KCl containing 0.05 mol L−1 K3[Fe(CN)6] (Fig. 2a), and it assumed that the anode reaction was affected by both reaction kinetics and diffusion. A Randle equivalent circuit was usually chosen to model the complex impedance, in which the charge transfer resistance (Rct) at the electrode/electrolyte interface was equal to the diameter of the semicircle.47 The Nyquist plot of the CC control represented a well-defined frequency-dependent semicircle impedance curve at high frequency followed by a straight line, but the GF and 3D-G electrodes had no defined semicircle. The smaller Rct indicated a faster electron-transfer rate between the electrode and electrolyte.43 By fitting the data of the Nyquist plot using the Zview program, the solution resistance (Rs) was of little difference between the three anodes. However, the Rct, representing the resistance of the electrochemical reaction, behaved differently (Table 1). The Rct of the 3D-G anode was only 0.8 Ω, compared with 65.9 Ω for CC and 1.1 Ω for GF, indicating a higher electrochemical reaction rate due to the good conductivity, macroporous structure and large specific surface area. With the same projected area (7 cm2), the 2D-CC control had the smallest total surface area relative to the 3D-G and GF (Table 1), leading to the smallest effective contact area for Fe2+ or Fe3+ as well as the highest Rct.
| Anode | BET (m2 g−1) | Total surface area (m2) | Rs (Ω) | Rct (Ω) |
|---|---|---|---|---|
| CC | 0.28 | 0.06 | 3.3 | 65.9 |
| GF | 0.19 | 0.13 | 3.6 | 1.1 |
| 3D-G | 188.32 | 9.41 | 2.7 | 0.8 |
 | ||
| Fig. 2 Nyquist plots (a) of the bare anodes in a mixture of 1 mol L−1 KCl with 0.05 mol L−1 K3[Fe(CN)6], the insets are the equivalent circuit and the high-frequency part of the results. Raman spectra of 2D graphene and 3D-G (b). | ||
The significant structural change from 2D-graphene to 3D-G is reflected in the Raman spectra (Fig. 2b), showing two peaks at ≈1350 cm−1 and ≈1580 cm−1. These correspond to the D and G bands of the carbon material presenting disordered and graphitic phases. The G peak results from the bond stretching of all pairs of sp2 atoms in both rings and chains, and the D peak results from the breathing modes of sp2 atoms in rings. When the 2D-graphene nanosheets restacked due to hydrophobic forces and π–π stacking to form multi-layer graphene nanosheets, a structure with defects and disorder was introduced, causing an increase in the intensity ratio of the D peak to G peak.48 Mono-layer graphene nanosheets are atomically flat with a well-known van der Waals thickness of ≈0.4 nm.49 An AFM image of the bare 3D-G revealed that the crumpled multi-layer graphene nanosheets had a thickness of around 20–60 nm (Fig. 3), approximately equivalent to 50–150 layers, and produced the obtained 3D-G monolithic structure and inflexibility.
 | ||
| Fig. 3 AFM topographic image (a) and height profile (b) of the bare 3D-G electrode. | ||
3.2. MFC performance
Over about 170 h, the outputted voltages of all the MFC reactors reached stability across an exterior loading of 1 kΩ, indicating a successful start-up (Fig. S2†). After 2 weeks of operation, the MFC reactors with the 3D-G anode had the maximum power density (Pmax) of 1516 ± 87 mW m−2, outperforming the GF (877 ± 57 mW m−2) and CC (584 ± 39 mW m−2) controls (Fig. 4a). After 2 months of operation, the Pmax of the reactor with the 3D-G anode as well as the GF and CC controls decreased by 15%, 17% and 22% respectively (Fig. 4c), possibly due to biofouling of the Pt/C cathode.50 The cathode potentials were nearly similar in the various MFC reactors, however, the anode potentials were quite different, indicating that the anode performance was responsible for the difference in power generation (Fig. 4b and d). Normalized to the cost of the anodes, the Pmax in the 3D-G reactor climbed to 191 ± 15 mW s−1, which was 133 and 93 times those for the CC and GF controls (based on manufacturing cost of the 3D-G and purchase price of the CC and GF, in one operation cycle). Therefore, considering the economic factor, the 3D-G anode had more advantages.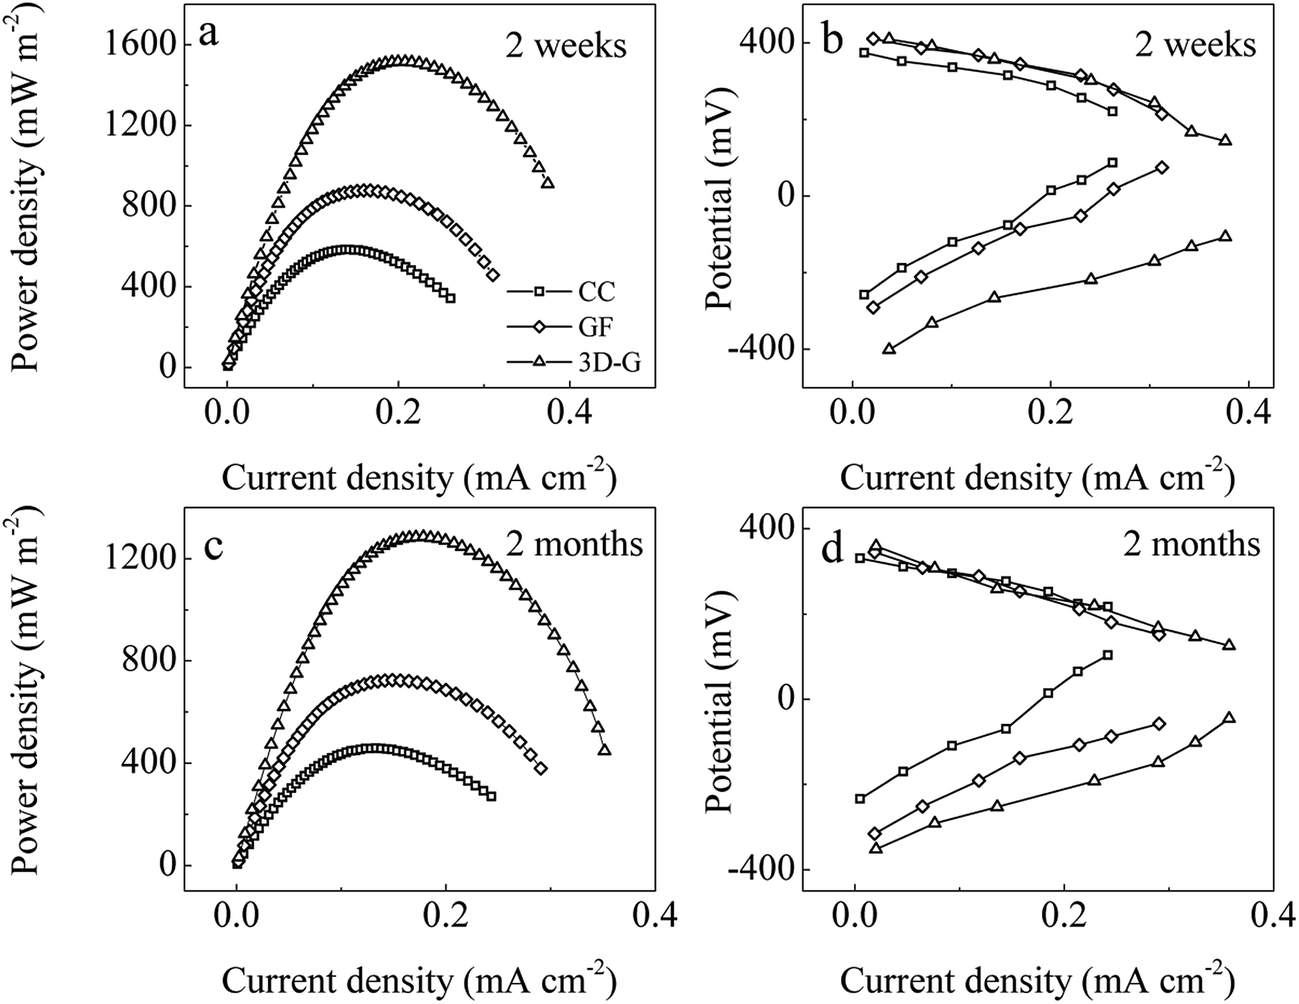 | ||
| Fig. 4 Power density curves (a, c) and electrode potential curves (b, d) of the different MFC reactors. | ||
The morphologies of the bio-anodes were imaged using SEM. As shown in Fig. 5, the biofilm matrix of rod-shaped bacteria interweaved and fully coated the exterior and interior of the 3D-G anode (Fig. 5a and b), implying that the macropore provided more sites for bacterial growth, which also contributed to the larger Pmax. Although rod-shaped bacteria in the CC and GF controls were also observed, the number of bacteria was obviously different (Fig. 5c–e). The results of biomass analysis showed that the biomass density on the 3D-G anode (7.4 μg-P cm−2) was much higher than those on the CC (1.3 μg-P cm−2) and GF (2.4 μg-P cm−2) anodes. Accordingly, the 3D-G reactor showed high performance for COD removal and CE which is mainly associated with the biomass density (93 ± 13% for COD removal and 38 ± 3% for CE), while COD removal was 87 ± 5% for CC and 90 ± 7% for GF, and CE was 27 ± 2% for CC and 34 ± 3% for GF, indicating that the 3D-G anode had the capability of holding higher biomass loading due to having a high surface area and macroporous structure.
 | ||
| Fig. 5 SEM images of the cultured 3D-G anode ((a) exterior and (b) interior), the cultured CC control (c), and the cultured GF control ((d) exterior and (e) interior) after operation. | ||
The total cells were imaged using CLSM and are shown in Fig. 6. Due to the plane structure of the 3D-G anode, seamless continuous multi-layer graphene nanosheets, the total cells on its exterior or interior appeared continuous and dense (Fig. 6a and b). The total cells on the CC control, with the carbon fibers closed tightly together and smaller interspaces, were continuous, but thin (Fig. 6c). The bacterial cells on the exterior and interior of the GF control were also observed, but were relatively fragmented and thin compared with the 3D-G anode (Fig. 6d and e). The distribution of the total cells was closely related to the anode morphology and conformed to the results of biomass density.
 | ||
| Fig. 6 CLSM images of the total cells in the cultured 3D-G anode ((a) exterior and (b) interior), the cultured CC control (c), and the cultured GF control ((d) exterior and (e) interior) after operation. | ||
3.3. Electron transfer kinetics
CV scanning under turnover conditions was used to investigate the bioelectrocatalytical activity of the bio-anode, whereas non-turnover CV scanning was applied to identify the presence of redox species adsorbed on the anode when substrate (such as acetate) was exhausted.44 The CV curve of the bare and cultured anodes, conducted under a low scan rate of 1 mV s−1 to allow the resolution of closed redox peaks,51 is shown in Fig. 7. The formal potentials of the different redox species viewed are summarized in Table 2. No redox peaks were observed in CV curves of the bare anodes (Fig. 7a), demonstrating that there was no redox species in the anolyte. In the CV curve of the CC control under non-turnover conditions, the two faradaic signals with formal potentials of about −0.29 ± 0.02 V and 0.54 ± 0.04 V obviously correspond to the redox transformation of electrochemically active species (Fig. 7b). Two sets of redox peaks with the formal potentials of −0.39 ± 0.02 V and 0.56 ± 0.05 V were also perceived in the CV curve of the CC control under turnover conditions (Fig. 7c). The formal potential for cytochrome c (cyt c) involved in EET varied with the different growth stages and operation conditions (e.g., pH, temperature, substrate, and ion concentration), and the redox species corresponding to the formal potential from −80 to 18 mV may all be cyt c in previous studies.28,52–56 It was speculated that the two redox species with the formal potential of about −0.29 ± 0.02 V (non-turnover) and −0.39 ± 0.02 V (turnover) may be the same type of cyt c involved in EET, mainly because (i) the redox species did not evolve from one substance into another within a short period of time, and (ii) the formal potential would decline due to the constant electron supply from acetate oxidation under turnover conditions (−0.29 ± 0.02 V > −0.39 ± 0.02 V). The redox species with the formal potential of 0.54 ± 0.04 V (non-turnover conditions) or 0.56 ± 0.05 V (turnover conditions) may be the same redox species, which was secreted by bacteria and not engaged in EET (its potential was higher than the anode potential). | ||
| Fig. 7 CV curves of the bare (a) and cultured ((b) non-turnover and (c) turnover) anodes. | ||
| CV mode | CC | GF | 3D-G | |||||
|---|---|---|---|---|---|---|---|---|
| P1 | P2 | P1 | P2 | P3 | P1 | P2 | P3 | |
| a Values were given as mean values ± standard deviation (n = 3). The contents in the brackets are peak current densities of the oxidation reaction (mA cm−2), only those involved in EET are listed. | ||||||||
| Non-turnover | −0.29 ± 0.02 (0.013 ± 0.001) | 0.54 ± 0.04 | −0.16 ± 0.01 (0.057 ± 0.006) | 0.10 ± 0.01 (0.074 ± 0.008) | 0.47 ± 0.06 | −0.40 ± 0.03 (−0.013 ± 0.001) | −0.09 ± 0.01 (0.033 ± 0.002) | 0.49 ± 0.06 |
| Turnover | −0.39 ± 0.02 (0.12 ± 0.01) | 0.56 ± 0.05 | −0.46 ± 0.03 (0.072 ± 0.006) | 0.13 ± 0.01 (0.20 ± 0.02) | 0.53 ± 0.05 | −0.43 ± 0.04 (0.19 ± 0.02) | −0.22 ± 0.02 (0.24 ± 0.02) | 0.53 ± 0.07 |
Three sets of redox peaks with the formal potentials of −0.16 ± 0.01 V, 0.10 ± 0.01 V and 0.47 ± 0.06 V were observed in the CV curve of the GF control under non-turnover conditions (Fig. 7b). Similarly, the redox species with the formal potentials of −0.16 ± 0.01 V and 0.10 ± 0.01 V under non-turnover conditions belonged to cyt c involved in EET and corresponded to those of −0.46 ± 0.03 V and 0.13 ± 0.01 V under turnover conditions (Fig. 7c). Three sets of redox peaks with the formal potentials of −0.40 ± 0.03 V, −0.09 ± 0.01 V and 0.49 ± 0.06 V were also observed in the CV curve of the 3D-G anode under non-turnover conditions (Fig. 7b), corresponding to −0.43 ± 0.04 V, −0.22 ± 0.02 V and 0.53 ± 0.07 V under turnover conditions (Fig. 7c).
In addition, there was a relatively larger difference between the formal potential of redox species involved in EET under non-turnover or turnover conditions, and a smaller difference between the formal potential of redox species not involved in EET under non-turnover or turnover conditions in general (Table 2). For example, the difference of the formal potential was 0.1 V for P1 and 0.02 V for P2 in CV scanning of CC, 0.3 V for P1, 0.03 V for P2 and 0.06 V for P3 in that of GF, and 0.03 V for P1, 0.13 V for P2 and 0.04 V for P3 in that of 3D-G. The reason may be that the redox species involved in EET accepted electrons under turnover conditions, but did not accept electrons under non-turnover conditions. However, for the redox species not involved in EET, they seldom accepted electrons under both non-turnover conditions and turnover conditions, and the formal potential showed a little change.
Furthermore, the peak current density of the 3D-G anode under turnover conditions was greater than those of the CC and GF controls (Fig. 7 and Table 2), illustrating that the bioelectrocatalytical activity or the efficiency of EET on the 3D-G anode was the highest. The peak current density under turnover conditions was obviously greater than that under non-turnover conditions due to a lack of acetate (Table 2). It is worth noting that cyt c was not specifically identified based on the formal potential due to the mixed culture in the present study.
Based on the Tafel curve (Fig. 8a), the electron transfer kinetics on the bio-anode were studied in terms of the exchange current density (i0) and Tafel slope. The polarization behavior revealed that i0 followed the order of 3D-G > GF > CC (Table 3), which was consistent with the order of Pmax. However, the ratio of Pmax was far less than that of i0, which illustrated that the difference between the catalytic current resulting from the exterior potential change was larger than that from the intrinsic biological metabolic reaction. Values of the Tafel slope increased to 0.041 ± 0.006 V dec−1 in the CC control and to 0.034 ± 0.004 V dec−1 in the GF control from 0.028 ± 0.003 V dec−1 in the 3D-G reactor (Table 3). A larger i0 and a smaller Tafel slope indicated the higher rate of bioelectrochemical reaction and efficiency of EET on the 3D-G interface.57 Fig. 8b presents the Nyquist plot for the three different cultured anodes, each of which shows a semicircle without a straight line following it, demonstrating that the electrode reaction was controlled by the charge transfer step.43 There was little difference in the Rs values of the various MFC reactors, however, the Rct changed greatly, decreasing to 5.2 ± 0.7 Ω in the 3D-G reactor from 29.8 ± 4.3 Ω in the CC control and from 8.3 ± 1.2 Ω in the GF control (Fig. 8b and Table 3). The bioelectrochemical reaction rate was inversely proportional to Rct.58 Therefore, the smaller value of Rct on the 3D-G electrode interface revealed that the bioelectrochemical reaction rate or efficiency of EET was enhanced greatly, which may be attributed to the superior performance of the 3D-G anode, with features such as good conductivity, large specific surface area and a macroporous structure.
 | ||
| Fig. 8 Tafel curves (a) and Nyquist plots (b) of the different cultured anodes, the inset in (b) is the equivalent circuit. | ||
| Anode | i0 (mA cm−2) | Tafel slope (V dec−1) | Rs (Ω) | Rct (Ω) |
|---|---|---|---|---|
| a Values are given as mean values ± standard deviation (n = 3). | ||||
| CC | 0.013 ± 0.002 | 0.041 ± 0.006 | 17.9 ± 2.3 | 29.8 ± 4.3 |
| GF | 0.090 ± 0.010 | 0.034 ± 0.004 | 17.6 ± 2.5 | 8.3 ± 1.2 |
| 3D-G | 0.220 ± 0.030 | 0.028 ± 0.003 | 17.8 ± 2.8 | 5.2 ± 0.7 |
4. Conclusion
The 3D-G base, prepared using a self-assembly method in the present study, can independently serve as the anode in a MFC system and had the capability of improving electrogenesis. The prepared 3D-G anode exhibited inflexibility, a macroporous structure, a crumpled surface, high specific surface area and good conductivity. It benefited the colonization of bacteria, and further increased the efficiency of EET. The Pmax was 1516 ± 87 mW m−2 in the 3D-G reactor, higher than those in the GF and CC controls after 2 weeks of operation. Normalized to the cost of the anodes, the huge superiority of the 3D-G was demonstrated with the Pmax higher by 2–3 orders of magnitude than the GF and CC controls. The 3D-G anode, possessing superior performance and low cost, would powerfully promote the practical application of MFCs as well as open up a new route for the application of graphene in other domains.Acknowledgements
This work was supported by a grant from the National Natural Science Foundation of China (No. 21206058), a grant from the Major Science and Technology Program for Water Pollution Control and Treatment of China (No. 2012ZX07101-013-04), the Fundamental Research Funds for the Central Universities (No. JUSRP111A09), the Research and Innovation Project for Postgraduates of Higher Education Institutions of Jiangsu Province (No. KYLX_1159).References
- A. E. Franks and K. P. Nevin, Energies, 2010, 3, 899–919 CrossRef CAS.
- M. Zhou, T. Jin, Z. Wu, M. Chi and T. Gu, in Sustainable Bioenergy and Bioproducts, Springer, 2012, pp. 131–171 Search PubMed.
- B. E. Logan, B. Hamelers, R. A. Rozendal, U. Schrorder, J. Keller, S. Freguia, P. Aelterman, W. Verstraete and K. Rabaey, Environ. Sci. Technol., 2006, 40, 5181–5192 CrossRef CAS PubMed.
- J. Khera and A. Chandra, Proc. Natl. Acad. Sci., India, Sect. A, 2012, 82, 31–41 CrossRef CAS.
- P. L. McCarty, J. Bae and J. Kim, Environ. Sci. Technol., 2011, 45, 7100–7106 CrossRef CAS PubMed.
- B. E. Logan, M. J. Wallack, K.-Y. Kim, W. He, Y. Feng and P. E. Saikaly, Environ. Sci. Technol. Lett., 2015, 2, 206–214 CrossRef CAS.
- P. Ledezma, B. C. Donose, S. Freguia and J. Keller, Electrochim. Acta, 2015, 158, 356–360 CrossRef CAS.
- T.-S. Song, W.-M. Tan, X.-Y. Wu and C. C. Zhou, J. Chem. Technol. Biotechnol., 2012, 87, 1436–1440 CrossRef CAS.
- B. Li, J. Zhou, X. Zhou, X. Wang, B. Li, C. Santoro, M. Grattieri, S. Babanova, K. Artyushkova, P. Atanassov and A. J. Schuler, Electrochim. Acta, 2014, 134, 116–126 CrossRef CAS.
- A. Ter Heijne, H. V. M. Hamelers, M. Saakes and C. J. N. Buisman, Electrochim. Acta, 2008, 53, 5697–5703 CrossRef CAS.
- Y. J. Feng, Q. Yang, X. Wang and B. E. Logan, J. Power Sources, 2010, 195, 1841–1844 CrossRef CAS.
- S. Cheng and B. E. Logan, Electrochem. Commun., 2007, 9, 492–496 CrossRef.
- T. Jin, J. Luo, J. Yang, L. Zhou, Y. Zhao and M. Zhou, J. Power Sources, 2012, 219, 358–363 CrossRef CAS.
- M. Zhou, M. Chi, H. Wang and T. Jin, Biochem. Eng. J., 2012, 60, 151–155 CrossRef CAS.
- D. A. Lowy, L. M. Tender, J. G. Zeikus, D. H. Park and D. R. Lovley, Biosens. Bioelectron., 2006, 21, 2058–2063 CrossRef CAS PubMed.
- X. Xie, M. Ye, L. Hu, N. Liu, J. R. McDonough, W. Chen, H. N. Alshareef, C. S. Criddle and Y. Cui, Energy Environ. Sci., 2012, 5, 5265–5270 CAS.
- U. Karra, S. S. Manickam, J. R. McCutcheon, N. Patel and B. Li, Int. J. Hydrogen Energy, 2013, 38, 1588–1597 CrossRef CAS.
- Y. Wang, B. Li, L. Zeng, D. Cui, X. Xiang and W. Li, Biosens. Bioelectron., 2013, 41, 582–588 CrossRef CAS PubMed.
- Z. Lv, D. Xie, X. Yue, C. Feng and C. Wei, J. Power Sources, 2012, 210, 26–31 CrossRef CAS.
- T. Saito, M. Mehanna, X. Wang, R. D. Cusick, Y. Feng, M. A. Hickner and B. E. Logan, Bioresour. Technol., 2011, 102, 395–398 CrossRef CAS PubMed.
- M. Batzill, Surf. Sci. Rep., 2012, 67, 83–115 CrossRef CAS.
- S. Agarwal, X. Zhou, F. Ye, Q. He, G. C. K. Chen, J. Soo, F. Boey, H. Zhang and P. Chen, Langmuir, 2010, 26, 2244–2247 CrossRef CAS PubMed.
- Y. Zhang, G. Mo, X. Li, W. Zhang, J. Zhang, J. Ye, X. Huang and C. Yu, J. Power Sources, 2011, 196, 5402–5407 CrossRef CAS.
- J. Liu, Y. Qiao, C. X. Guo, S. Lim, H. Song and C. M. Li, Bioresour. Technol., 2012, 114, 275–280 CrossRef CAS PubMed.
- L. Xiao, J. Damien, J. Luo, H. D. Jang, J. Huang and Z. He, J. Power Sources, 2012, 208, 187–192 CrossRef CAS.
- Z. He, J. Liu, Y. Qiao, C. M. Li and T. T. Y. Tan, Nano Lett., 2012, 12, 4738–4741 CrossRef CAS PubMed.
- X. Xie, G. Yu, N. Liu, Z. Bao, C. S. Criddle and Y. Cui, Energy Environ. Sci., 2012, 5, 6862–6866 CAS.
- Y.-C. Yong, X.-C. Dong, M. B. Chan-Park, H. Song and P. Chen, ACS Nano, 2012, 6, 2394–2400 CrossRef CAS PubMed.
- L.-B. Xing, S.-F. Hou, J. Zhou, S. Li, T. Zhu, Z. Li, W. Si and S. Zhuo, J. Phys. Chem. C, 2014, 118, 25924–25930 CAS.
- D. C. Marcano, D. V. Kosynkin, J. M. Berlin, A. Sinitskii, Z. Sun, A. Slesarev, L. B. Alemany, W. Lu and J. M. Tour, ACS Nano, 2010, 4, 4806–4814 CrossRef CAS PubMed.
- B. Logan, S. Cheng, V. Watson and G. Estadt, Environ. Sci. Technol., 2007, 41, 3341–3346 CrossRef CAS PubMed.
- S. Cheng, H. Liu and B. E. Logan, Electrochem. Commun., 2006, 8, 489–494 CrossRef CAS.
- H. Liu and B. E. Logan, Environ. Sci. Technol., 2004, 38, 4040–4046 CrossRef CAS PubMed.
- J. Low, J. Yu, Q. Li and B. Cheng, PCCP Phys. Chem. Chem. Phys., 2014, 16, 1111–1120 RSC.
- Y. Xie, Y. Li, L. Niu, H. Wang, H. Qian and W. Yao, Talanta, 2012, 100, 32–37 CrossRef CAS PubMed.
- S. Guo, S. Dong and E. Wang, ACS Nano, 2010, 4, 547–555 CrossRef CAS PubMed.
- S. S. Adav, J. C.-T. Lin, Z. Yang, C. G. Whiteley, D.-J. Lee, X.-F. Peng and Z.-P. Zhang, Biotechnol. Adv., 2010, 28, 255–280 CrossRef CAS PubMed.
- Y. Wang, B. Li, L. Zeng, D. Cui, X. Xiang and W. Li, Biosens. Bioelectron., 2013, 41, 582–588 CrossRef CAS PubMed.
- S.-M. Park and J.-S. Yoo, Anal. Chem., 2003, 75, 455–461 Search PubMed.
- P. Aelterman, S. Freguia, J. Keller, W. Verstraete and K. Rabaey, Appl. Microbiol. Biotechnol., 2008, 78, 409–418 CrossRef CAS PubMed.
- J. R. Kim, B. Min and B. E. Logan, Appl. Microbiol. Biotechnol., 2005, 68, 23–30 CrossRef CAS PubMed.
- APHA, Standard Methods for the Examination of Water and Wastewater, American Public Health Association, Washington, DC, 20th edn, 1998 Search PubMed.
- Z. He and F. Mansfeld, Energy Environ. Sci., 2009, 2, 215–219 CAS.
- E. Marsili, J. Sun and D. R. Bond, Electroanalysis, 2010, 22, 865–874 CrossRef CAS.
- X. Peng, H. Yu, H. Yu and X. Wang, Bioresour. Technol., 2013, 138, 353–358 CrossRef CAS PubMed.
- J. Kang, Y. Jang, Y. Kim, S.-H. Cho, J. Suhr, B. H. Hong, J.-B. Choi and D. Byun, Nanoscale, 2015, 7, 6567–6573 RSC.
- T. Springer and I. Raistrick, J. Electrochem. Soc., 1989, 136, 1594–1603 CrossRef CAS.
- L. M. Malard, M. A. Pimenta, G. Dresselhaus and M. S. Dresselhaus, Phys. Rep., 2009, 473, 51–87 CrossRef CAS.
- P. Nemes-Incze, Z. Osvath, K. Kamaras and L. P. Biro, Carbon, 2008, 46, 1435–1442 CrossRef CAS.
- X. Xia, F. Zhang, X. Zhang, P. Liang, X. Huang and B. E. Logan, ACS Appl. Mater. Interfaces, 2013, 5, 7862–7866 CAS.
- E. Marsili, J. B. Rollefson, D. B. Baron, R. M. Hozalski and D. R. Bond, Appl. Environ. Microbiol., 2008, 74, 7329–7337 CrossRef CAS PubMed.
- T. Magnuson, N. Isoyama, A. Hodges-Myerson, G. Davidson, M. Maroney, G. Geesey and D. Lovley, Biochem. J., 2001, 359, 147–152 CrossRef CAS PubMed.
- M. Kudera, Y. Nakagawa, S. Fletcher and H. A. O. Hill, Lab Chip, 2001, 1, 127–131 RSC.
- A. A. Carmona-Martinez, F. Harnisch, L. A. Fitzgerald, J. C. Biffinger, B. R. Ringeisen and U. Schröder, Bioelectrochemistry, 2011, 81, 74–80 CrossRef CAS PubMed.
- J. M. Dantas, L. Morgado, P. R. Pokkuluri, D. L. Turner and C. A. Salgueiro, Biochim. Biophys. Acta, Bioenerg., 2013, 1827, 484–492 CrossRef CAS PubMed.
- J. M. Dantas, L. Morgado, T. Catarino, O. Kokhan, P. Raj Pokkuluri and C. A. Salgueiro, Biochim. Biophys. Acta, Bioenerg., 2014, 1837, 750–760 CrossRef CAS PubMed.
- S. V. Raghavulu, P. S. Babu, R. K. Goud, G. V. Subhash, S. Srikanth and S. V. Mohan, RSC Adv., 2012, 2, 677–688 RSC.
- Y. Zhang, J. Sun, B. Hou and Y. Hu, J. Power Sources, 2011, 196, 7458–7464 CrossRef CAS.
Footnote |
| † Electronic supplementary information (ESI) available. See DOI: 10.1039/c5ra24718g |
| This journal is © The Royal Society of Chemistry 2016 |