DOI:
10.1039/C5RA24686E
(Paper)
RSC Adv., 2016,
6, 17246-17255
Nano-fluid loss agent based on an acrylamide based copolymer “grafted” on a modified silica surface
Received
21st November 2015
, Accepted 27th January 2016
First published on 29th January 2016
Abstract
In this paper, the nano copolymer of acrylamide (AM), 2-acrylamido-2-methyl-1-propane sulfonic acid (AMPS), and modified nano-silica (M-SiO2) was synthesized by free radical polymerization in a water solution. The addition of ethanol was used to control the molecular weight of the copolymer. The characterization of the copolymer was measured by Fourier transform infrared spectroscopy, a particle size analyzer, transmission electron microscopy, atomic force microscopy and nuclear magnetic resonance. AM and AMPS were grafted on the surface of M-SiO2 successfully. The grafted copolymer was in nm size not only in the water solution but also in a drilling fluid. Filtration properties and the interaction mechanism of the copolymer with montrillonite (MMT) were studied in a fresh water drilling fluid system and different kinds of salt water drilling fluid systems. The copolymer as fluid loss agent was equal to commonly used fluid loss agents in a fresh water drilling fluid system. The resistance properties to salinity, calcium and high temperature were tested. The copolymer had a resistance temperature of 150 °C and saturated brine resistance. The resistance property to calcium was up to 1 wt%. The interaction mechanism between montrillonite and the copolymer was evaluated using a particle size analyzer, transmission electron microscopy, scanning electron microscopy and a surface area analyzer. The copolymer was adsorbed on the surface of MMT. Compared to pristine MMT, the addition of the copolymer resulted in new peaks in the particle size analyzer image. The filter liquor of the drilling fluid with the copolymer showed two peaks in nm scale and the filter liquor of the drilling fluid without the copolymer showed that no peak appeared under 1000 nm. The results presented that the copolymer as a fluid loss agent was a nano material in the drilling fluid. The surface area analyzer (BET) results showed that the surface area of a natural rock reduced after treatment with the copolymer, indicating that the copolymer entered into the nanopores of shale because of the adsorption on the surface of shale.
1. Introduction
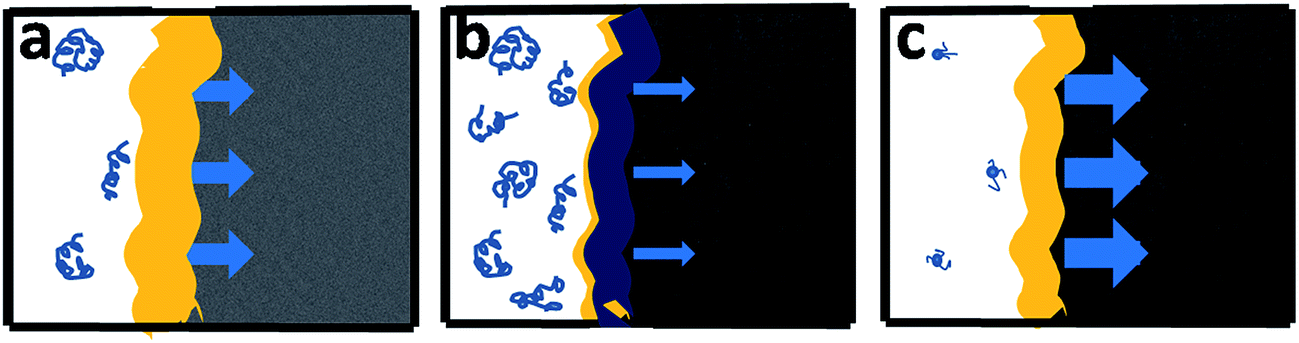
Increasing demand for energy and depletion of many conventional oil and gas reserves has increased the importance of shale and techniques to drill shale formation.1 Wellbore stability is a critical issue on the drilling progress and troubles the drilling fluid engineers and experts all the time.2 Shale is a sedimentary rock that mineralogically consists of clays and contains pores with a range of pore throat sizes from 5 nm to 50 nm.3 The permeability of shale is so low that its value is up to nD, leading to an unformed filter cake.4 As showed in Fig. 1a, a filter cake was formed in a wellbore during a drilling operation for conventional drilling fluid, which prevents further invasion of water from the shale formation. Conventional fluid loss agents are modified cellulose, modified humic acid, modified lignite and synthetic products,8,9 which are micro polymers. These commonly used conventional fluid loss agents are too large to enter into the nanopores of the shale formation (Fig. 1b). Following the invasion of water through the nanopore throats into the shale formation weakens the wellbore and leads to problems such as a stuck pipe and hole collapse.5–7 The solution to this problem is to engineer a nano fluid loss agent in the drilling fluid to plug the nanopores of shale and shut off the loss of water. As showed in Fig. 1c, a nano fluid loss agent can enter into the nanopores of shale formation and can be adsorbed to the surface of the wellbore. Nanomaterials and nanotechnology have attracted a wide variety of research in the past decade with numerous applications in a variety of industries.10–14 Furthermore, nanomaterials and nanotechnology have been applied in water based drilling fluids in recent years.15–17 But their works cannot solve the problem of wellbore instability completely due to serious aggregation and vast addition of nanomaterials. This is a novel work to synthesize a kind of inexpensive nano fluid loss agent without serious aggregation of a water based drilling fluid to drill into a shale formation.
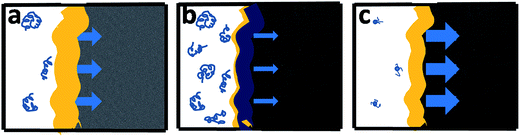 |
| | Fig. 1 The thickness of a filter cake is dependent on the fluid loss or leak off into the formation. (a) The conventional fluid loss agent in sand formation; (b) the conventional fluid loss agent in low permeability shale formation; and (c) nano-fluid loss agent in low permeability shale formation. | |
Polyacrylamide (PAM) and derivatives were widely applied in oil fields.18–21 Their products were used as flocculating agent, fluid loss agent, viscosities, viscosity reducer, solid coat stabilizer, oil displacement agent, gel plugging agent and drag reducer. The products were widely applied materials and showed fine compatibility with other agents. Polyacrylamide and derivatives used to synthesize nanomaterials by grafting on the surface of nanosilica have attracted much attention in the recent decade.22–25 Generally, there were two main approaches to chemically attach polymer chains on the surface of nanosilica: covalent attachment of end-functionalized polymers to the surface (“grafting to” method) and in situ monomer polymerization with monomer growth of polymer chains from immobilized initiators (“grafting from” method). Therefore, the development of grafting strategies, so as to tailor the surface properties of mineral substrates, is of great current interest.26,27 The “grafting from” technique, also called surface-initiated polymerization appears to be a very promising and versatile method.
A large variety of initiating mechanisms, including free radical polymerizations have been applied.28,29 The preparation of organic/inorganic nanocomposites via surface-initiated polymerizations has been reviewed by several groups.30,31 Our group synthesized a nano copolymer based on an AM/AMPS/M-SiO2 grafted polymer with controlled molecular weight under polymerization conditions. The size of most of the copolymer was from 0 to 50 nm, and it was matching with nanopores of shale formation. What is more important, it was inexpensive and without serious aggregation not only in water but also in a drilling fluid. The copolymer exhibited high performance as a fluid loss agent in various media.
2. Materials and methods
2.1 Materials
AM (98%) and AMPS (98%) were commercial products from the Beijing Chemical reagent company and AM was purified by recrystallization with acetone. Modified nano-silica (20 nm, 99%) which was modified by methacryloxy propyl trimethoxyl silane (KH570) was purchased from the Xianfeng Chemical Reagent Company. Sodium hydrogen sulfite (99%) and ammonium peroxydisulfate (99%) were purchased from Alfa. Sodium hydroxide and other reagents were purchased from a domestic reagent company. All the reagents were not purified further.
2.2 Methods
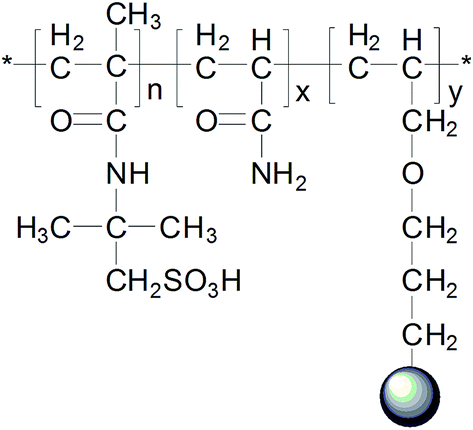
2.2.1 Synthesis of the AM/AMPS/M-SiO2 grafted copolymer. The nano grafted copolymer of AM/AMPS/M-SiO2 was synthesized by free radical polymerization in a water solution. The chemical structure of the modified AM/AMPS/M-SiO2 grafted copolymer was showed in Fig. 2. AM (18 g), AMPS (2 g) were mixed in 100 ml water. Then the water solution was poured into a flask. Sodium hydroxide was added into the solution and stirred to adjust the pH to 7–8. M-SiO2 (0.5 g) was poured into ethanol (10 ml) and stirred until M-SiO2 was completely dissolved in ethanol. And then the two solutions were mixed, heated and kept in 60 °C for 1 h. Then sodium hydrogen sulfite (0.20 g) and ammonium peroxydisulfate (0.60 g) were added into the solution and the reaction was left for 6 h. The product was cooled at room temperature. The solution was used for property evaluation. Further treatment was carried out for H-NMR and IR-FT testing. The product was precipitated using acetone and dried at 70 °C for 24 h. The dried product was ground into powder, and then the powder was purified by soxhlet extraction with acetone. The powder was dried at 70 °C for 24 h.
 |
| | Fig. 2 Chemical structure of the AM/AMPS/M-SiO2 grafted copolymer. | |
2.2.3 Fluid property tests. Fluid property tests were measured according to American Petroleum Institute (API) specifications and Chinese SY/T5621-93. The API filtrate volume of the mud was determined with a ZNZ-D3-type medium-pressure filtration apparatus (Qingdao Bairuida Machinery Corporation, China). A volume of water-montrillonite suspension was loaded on the filter press equipped with a filter paper and fixed pressure in 0.7 MPa. Over time, a low permeability filter cake was formed on the filter paper, which resembled the filter cake created during drilling. The filtrate volume was recorded in 30 min, which was accustomed to be denoted by API in engineering. In other words, API was defined as the 30 min filtrate volume based on API specifications. The rheological parameters, such as the apparent viscosity (AV), the plastic viscosity (PV) and yield point (YP) of the nano copolymer suspension, were determined through measurements of the viscosities at two rotation rates of 600 rpm and 300 rpm using a ZNN-D6L rotational viscometer (Qingdao, China) at room temperature. Calculated from the value of Ø600 (reading of the viscosity at 600 rpm) and Ø300 (reading of the viscosity at 300 rpm) by the following formulas:
| Apparent viscosity (AV) = 0.5 Ø600 (mPa s) |
| Plastic viscosity (PV) = Ø600 − Ø300 (mPa s) |
| Yield point (YP) = 0.5(2Ø300 − Ø600) (Pa) |
Aging experiments of montrillonite with nano copolymer fluids were carried out in a GW300-type frequency conversion rolling oven (Qingdao Jiaonan Tongchun Machinery Plant, China) through hot rolling at appointed temperature (80 °C, 100 °C, 120 °C, 140 °C, 150 °C). A series of 400 ml fresh water drilling fluids were prepared.
A certain concentration of copolymer was added into the fluid while stirring at 8000 rpm for 20 min. The mixture fluid was put into a digestion tank and then was taken to the roller oven. The rolling time was fixed at 16 h. The temperature was installed as requirement. The fluid property tests were performed before and after the thermal aging experiments.
2.3 Structure characterization techniques
2.3.1 Nuclear magnetic resonance (1H-NMR) measurements. 1H-NMR spectral analysis of the AM/AMPS/M-SiO2 grafted copolymer was recorded on a JNM-ECA 600. 2 mg sample was dissolved in 1 ml D2O. The solution was poured into an NMR tube.
2.3.2 Fourier transform infrared spectroscopy (FT-IR) measurements. FT-IR spectral analysis of SiO2, M-SiO2 and the AM/AMPS/M-SiO2 grafted copolymer were recorded using a Magna-IR 560 spectrometer. 2 mg samples and 200 mg KBr were fully blended. The mixture was put into the mold and kept in 50 MPa pressure by a hydraulic press.
2.3.3 Scanning electron microscopy (SEM). SEM analyses were performed by a Quanta 200F scanning electron microscope. 800 ml fresh-water based fluid was prepared. 8 g copolymer was added into 400 ml fresh-water based fluid. The solution and another 400 ml fresh-water based fluid were loaded on the filter press equipped with a filter paper and fixed pressure in 0.7 MPa. Two parts of filter liquor and filter paper were used. The filter liquor was used for TEM test and particle size analysis. The filter papers were dried at 60 °C for 24 h. The dried samples were adhered to adhesive tapes, and then metal sprayed for 2 min.
2.3.4 Transmission electron microscopy (TEM). TEM analyses were performed using a F20 transmission electron microscope. One sample was prepared as follows: a 20 ml 0.010 wt% MMT solution was prepared. The solution was divided into two. 10 mg copolymer was poured into one solution. The solutions were dispersed by ultrasonicator at room temperature for 2 min. The other sample was the filter liquor gained from the filter press. 1 drop of the solution was added to the carbon membrane. The carbon membranes were dried under infrared light for 20 min.
2.3.5 Atomic force microscopy (AFM). AFM analyses were performed using a SPM-9600 instrument. 50 ml of a 0.01 wt% concentrated copolymer solution was prepared. The solutions were dispersed by ultrasonicator at room temperature for 2 min, and then the solutions were diluted 5 times and stored for 24 h. 10 μl solutions were added to a mica sheet. The samples were dried at room temperature for 6 h.
2.3.6 Particle size analysis. The suspensions were analysed using a Zetasizer Nano ZS instrument. 20 ml 0.1 wt% MMT suspensions were prepared and dispersed by ultrasonicator at room temperature for 20 min. 10 mg copolymer was added into 10 ml MMT aqueous suspension to make a MMT/copolymer suspension.
3. Results and discussions
3.1 AM/AMPS/M-SiO2 grafted copolymer characterization
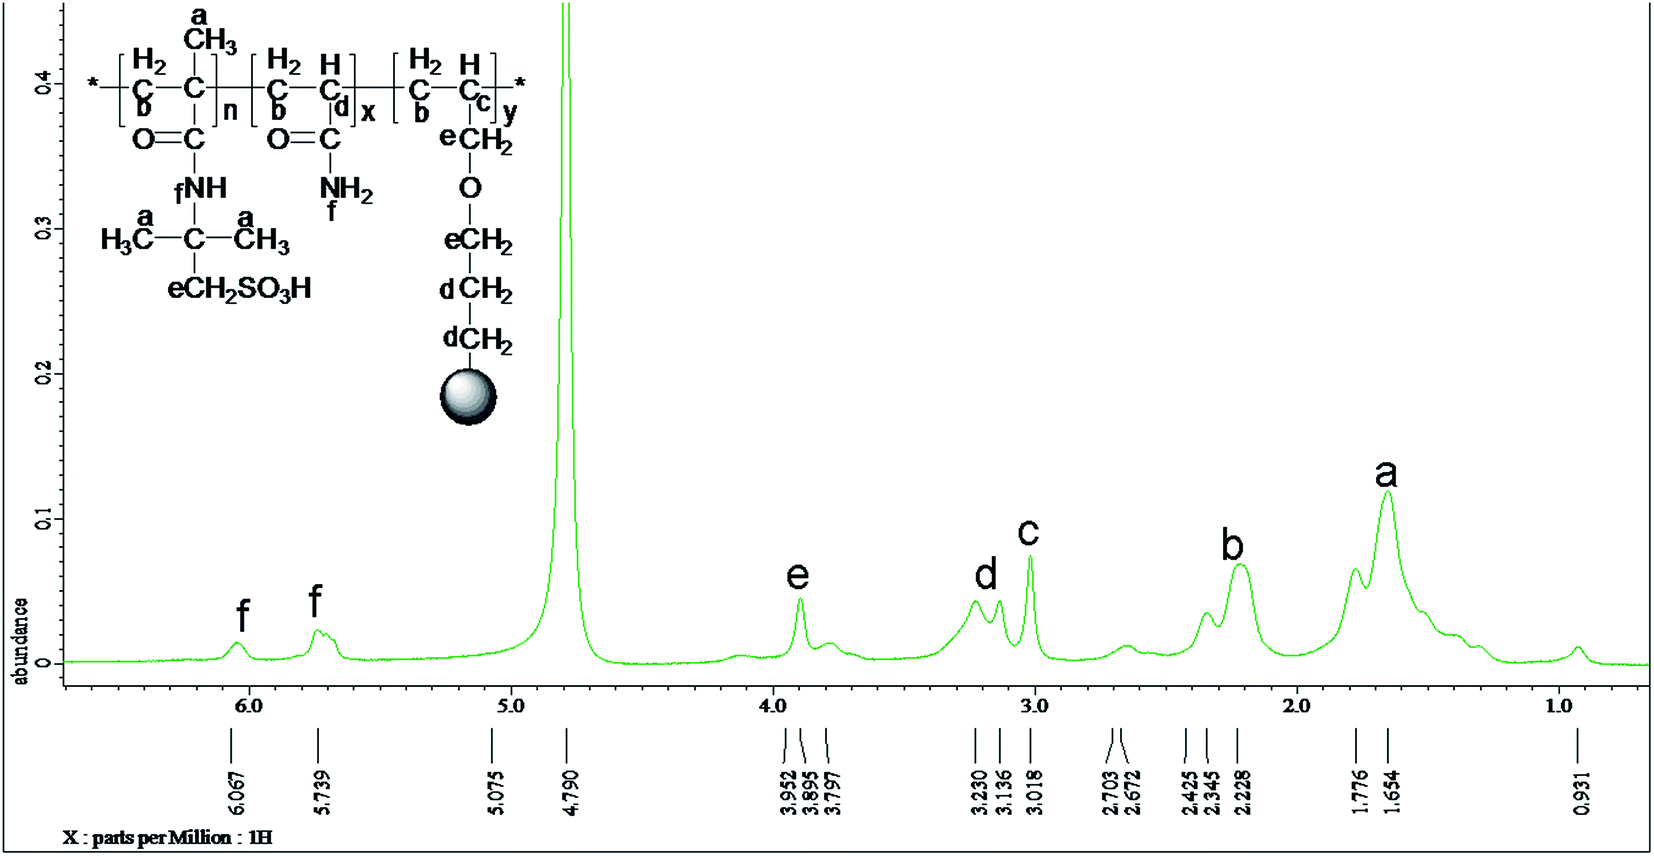
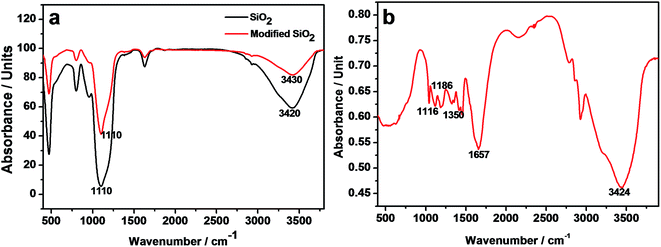
The nano-fluid loss agent was synthesized based on an AM/AMPS/M-SiO2 grafted copolymer. An 1H-NMR spectrum of the copolymer is showed in Fig. 3. The structural formula of the copolymer and the corresponding peaks were labeled (a–f). All the peaks were assigned to the formula. The results exhibited that AM and AMPS were grafted on the surface of M-SiO2 successfully. FT-IR spectra of SiO2 and M-SiO2 are exhibited in Fig. 4a. In the pristine spectra of SiO2, 3420 cm−1 was the O–H stretching band and 1110 cm−1 was the Si–O stretching band. Compared to the pristine spectra of SiO2, the stretching band of O–H (3430 cm−1) in M-SiO2 showed a red shift 10 cm−1 due to the interaction between O–H in the surface of SiO2 and KH570. The FT-IR spectrum of the copolymer is showed in Fig. 4b. The major characteristic peaks are as follows: 3424 cm−1 was the N–H stretching band. 1657 cm−1 was the C![[double bond, length as m-dash]](https://www.rsc.org/images/entities/char_e001.gif) O stretching band. 1350 cm−1 and 1186 cm−1 were the SO stretching band. 1116 cm−1 was the Si–O stretching band and it was red shifted 6 cm−1, compared to pristine SiO2. The O–H stretching band (3420 cm−1) coincided with the N–H stretching band (3424 cm−1). There was no CC band at 1645–1620 cm−1. The results exhibited that the copolymer was an AM/AMPS/M-SiO2 grafted copolymer.
O stretching band. 1350 cm−1 and 1186 cm−1 were the SO stretching band. 1116 cm−1 was the Si–O stretching band and it was red shifted 6 cm−1, compared to pristine SiO2. The O–H stretching band (3420 cm−1) coincided with the N–H stretching band (3424 cm−1). There was no CC band at 1645–1620 cm−1. The results exhibited that the copolymer was an AM/AMPS/M-SiO2 grafted copolymer.
 |
| | Fig. 3 1H-NMR spectrum of the AM/AMPS/M-SiO2 grafted copolymer. The peaks in the spectrum and the corresponding structure were labeled (a–f). | |
 |
| | Fig. 4 FT-IR spectra of SiO2, modified SiO2 and the AM/AMPS/M-SiO2 grafted copolymer. (a) SiO2, modified SiO2;(b) AM/AMPS/M-SiO2 grafted copolymer. | |
An amount of microspheres can be seen in the TEM image of the copolymer (Fig. 5a). The size of the microsphere was about 20 nm, indicating that the nano copolymer was synthesized successfully. The according AFM image is showed in Fig. 5b. The copolymer was dispersed in nm scale. The thickness of the microsphere was labeled on the right. The average thickness was 7.42 nm, indicating that the diameter of the microsphere was about 7.42 nm. In spite of the calculation not being precise due to the sample being dried in the process of preparation, the size of the microsphere under 50 nm was accurate. As showed in Fig. 6, there were three peaks in nm scale in the particle size analysis. One of peaks was from 0 nm to 50 nm, and the intensity of this peak was up to 6%. The intensity of the 100 nm microsphere was 10 times lower than that of the 10 nm microsphere. The 6% intensity of the peak under 50 nm exhibited a strong intensity. The analysis showed that there was a large amount of copolymer under a size of 50 nm.
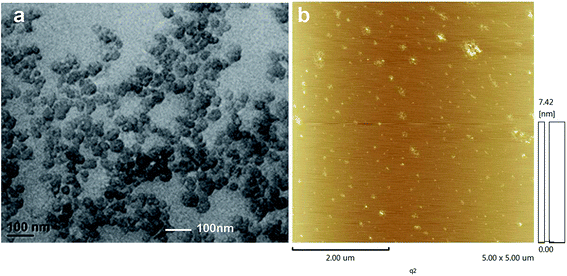 |
| | Fig. 5 TEM and AFM images of the AM/AMPS/M-SiO2 grafted copolymer. (a) TEM; (b) AFM. | |
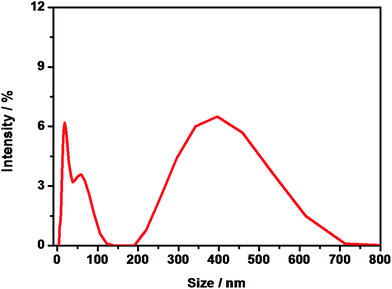 |
| | Fig. 6 Particle size analysis of the AM/AMPS/M-SiO2 grafted copolymer. | |
3.2 Property evaluations
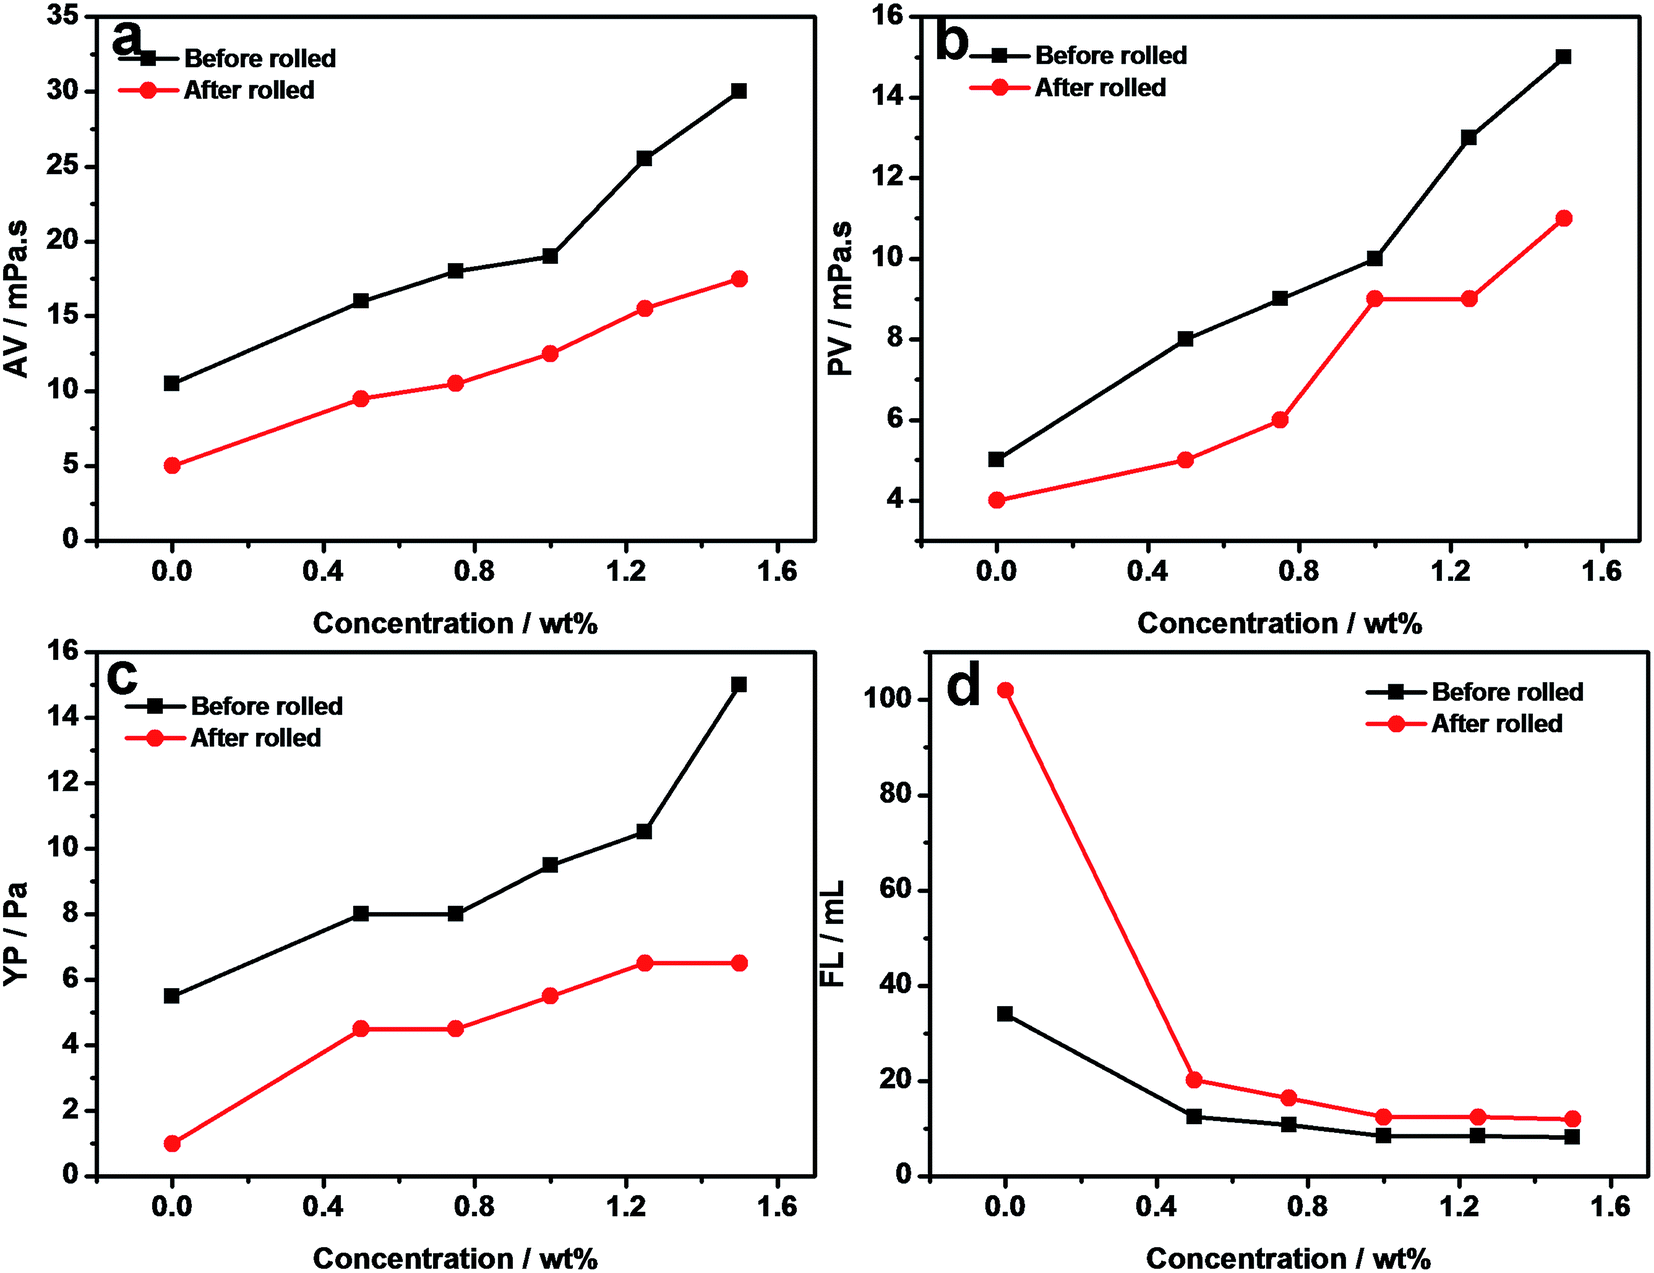
Based on the evaluation procedure of the fluid loss agent in the drilling fluid, the most frequently used methods were used to evaluate the fluid loss agent property according to the American Petroleum Institute (API) specifications and Chinese SY/T5621-93. The API filtrate volume of mud was determined with a ZNZ-D3-type medium-pressure before and after it was rolled at a fixed temperature. The value of the API filtrate volume was under 12 ml for commonly used fluid loss agents at room temperature in a fresh water drilling fluid. 15 ml was rational after being rolled at fixed temperature. The fixed temperature was considered as bare temperature. The rheological parameters, such as the apparent viscosity (AV), the plastic viscosity (PV) and yield point (YP), were used to exhibit the rheological properties of the drilling fluid. The larger the AV the worse the rheological properties. And a larger YP indicated a better cutting carrying ability. The ratio of YP/PV represented the suspension capability of the drilling fluid. A larger ratio showed a better suspension capability. A value of AV over 80 was not rational in the fresh water drilling fluid system. The rheological properties were worse for the drilling fluid. The worse rheological properties were considered as the major factor of the wellbore problems. The rheological properties and API filtrate volume were used to evaluate the fluid loss agent in the drilling fluid. The API filtrate volume after rolling at a fixed temperature was used to evaluate the heat resistance. The addition of salt was used to evaluate the salt resistance. The copolymer was synthesized under fixed reaction conditions based on previous work. Fig. 7 showed that the change of rheological properties and filtrate volume of the copolymer with the addition of the copolymer before and after rolling. The apparent viscosity increased with the addition of the copolymer before and after being rolled (Fig. 7a). When the concentration of the copolymer was up to 1.5 wt% the apparent viscosity was about 30.0 mPa s which is less than for a commonly-used fluid loss agent. The apparent viscosity was kept on 17.5 mPa s after rolling at 150 °C for 16 h. The plastic viscosity and the yield point curve showed a similar trend. What was more important, the value of the plastic viscosity was lower than 15 mPa s when the concentration of the copolymer was up to 1.5 wt%, meanwhile the yield point was about 15 Pa. The ratio of YP/PV was up to 1.0. Even after rolling at 150 °C for 16 h, the ratio of YP/PV still remained 0.59. In addition of 0.5 wt% copolymer, the filtration volume sharply declined, and the filtration volume was 12.4 ml which was equal to the commonly-used fluid loss agent. With the increase in copolymer the filtration volume reduced. With the addition of 1.5 wt% copolymer, the filtration volume was 8.4 ml. The filtration volume sharply declined after being rolled at 150 °C for 16 h, compared to the fresh water fluid. The filtration volume was up to 12.4 ml with a 1.0% addition of the copolymer. The results showed that the copolymer as a fluid loss agent exhibited high-performance rheological and fluid loss properties. The heat temperature was up to 150 °C.
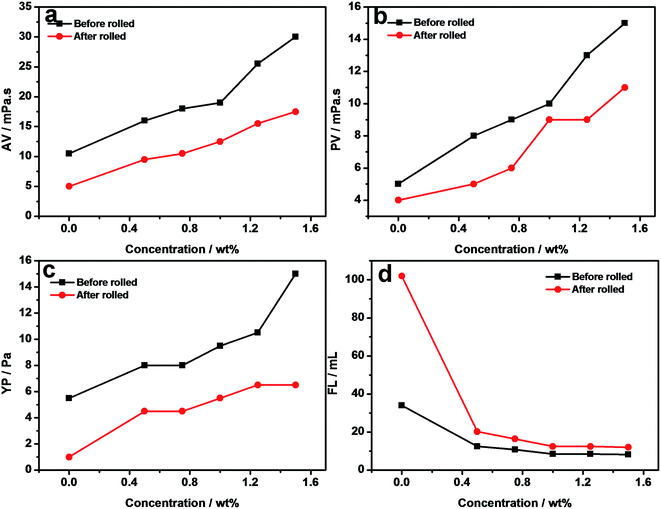 |
| | Fig. 7 Change of rheology parameters and filtration volume of the AM/AMPS/M-SiO2 grafted copolymer with different concentrations of the copolymer after and before being rolled (rolled at 150 °C). (a) Apparent viscosity; (b) plastic viscosity; (c) yield point; (d) filtration volume. | |
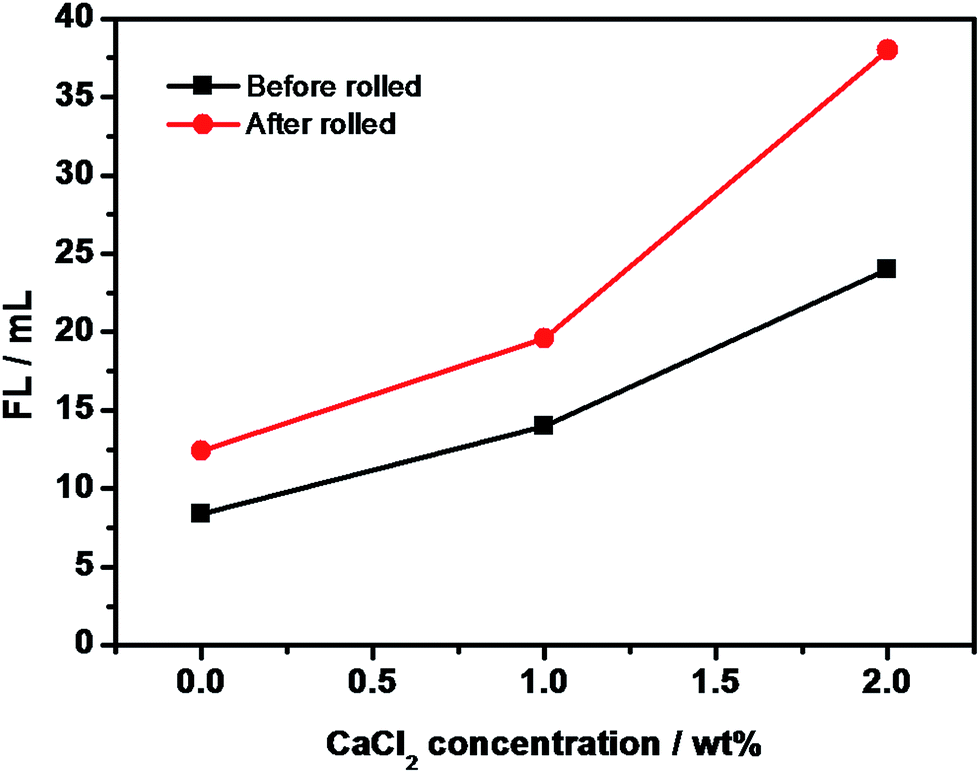
The high-temperature resistance was evaluated by heat rolling at different temperatures (Fig. 8). The filtration volume increased with temperature. The filtration volume was 8.6 ml without rolling and the volume remained on 12.4 ml after rolling at 150 °C. The filter papers with and without the copolymer after rolling (at 150 °C for 24 h) and before rolling were showed in Fig. 9. The filter papers with the copolymer both at room temperature and after rolling were obviously thinner than filter papers without the copolymer. In addition of the copolymer, the space grid structure was formed between the copolymer and MMT, resulting in a lower filtration volume. The salt resistance of the copolymer was exhibited in Fig. 10. The suspension of the copolymer and the fresh water drilling fluid was prepared. NaCl was gradually added to the suspension, and the filtration volume was recorded at room temperature. In spite of the gradual increase, the value remained at 12 ml with saturating the salt, indicating that the copolymer is a good fluid loss agent from minimal salt to saturation. The sulfonic acid group assigned to AMPS resulted in the copolymer resistance to salt up to saturation. For the evaluation of resistance to salt, the same suspension was prepared. The gradual addition of CaCl2 was carried out. Calcium resistance was presented in Fig. 11. The filtration volume without calcium was 8.6 ml and 12.6 ml after rolling (at 150 °C for 24 h). After 1 wt% calcium was added to the suspension fluid, the filtration volume increased to 14 ml before rolling and 19 ml after rolling. When continuing to add calcium, the filtration volume sharply increased both before rolling and after rolling. It was obvious that the copolymer as fluid loss agent was non-resistant to calcium. Calcium as a divalent cation has troubled engineers and experts in drilling operations all the time. The little amount of commonly used fluid loss agent can bear over 2 wt% calcium in the fresh water drilling fluid after rolling at 150 °C. We evaluated the fluid loss property in various media fluids. The data was presented in Table 1. In general, the rheology property was exhibited by rheology parameters obtained from 600 rpm and 300 rpm mentioned in the method section. Presenting all the rotation speeds was another commonly used method to show rheology property. The value of 10 s and 10 min was obtained from 3 rpm based API specifications. The value of 10 s was defined as initial shear and 10 min was defined as final shear, which was an important parameter to indicate the suspension capability. The fluids were prepared as described in the method section. In the fresh water fluid, the filtration volume was 8.8 ml. The volume was 20 ml in the saturated salt water fluid. The data were similar to the result mentioned in Fig. 10. In the complex salt water fluid, the filtration volume was up to 22.8 ml. The rheological properties in various salt water fluids changed slightly before and after adding the copolymer, but 10 s and 10 min were obviously reduced. The results exhibited that the copolymer can be used in various salt water fluids as a fluid loss agent.
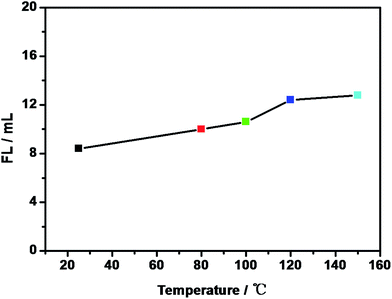 |
| | Fig. 8 Change of the filtration volume with temperature. The concentration of the copolymer was 1 wt%. | |
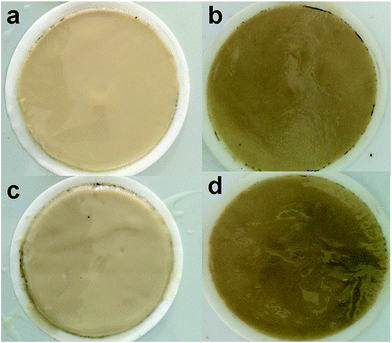 |
| | Fig. 9 Images of the filter paper with and without the copolymer after rolling (at 150 °C for 24 h) and before rolling. (a) With the copolymer before being rolled; (b) with the copolymer after being rolled; (c) without the copolymer before being rolled; (d) without the copolymer after being rolled. | |
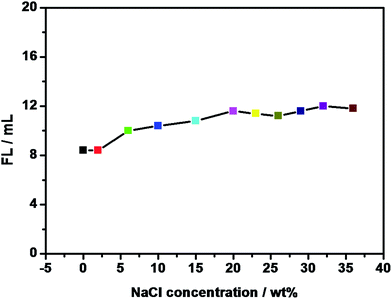 |
| | Fig. 10 Change of the filtration volume with NaCl concentration. | |
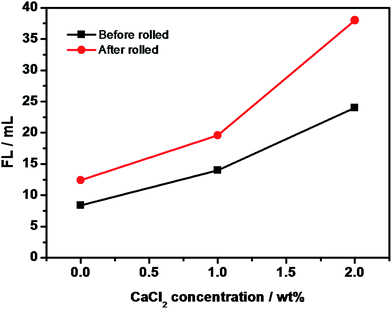 |
| | Fig. 11 Change of the filtration volume with CaCl2 concentration. | |
Table 1 Rheology properties and filtration volume of the AM/AMPS/M-SiO2 grafted copolymer were evaluated in various media fluids. (a) Fresh-water fluid; (b) salt-water fluid; (c) saturated salt-water fluid; (d) complex salt-water fluid
| Sample |
600 rpm |
300 rpm |
200 rpm |
100 rpm |
6 rpm |
3 rpm |
10 s |
10 min |
API (ml) |
| a |
19 |
16 |
14 |
12 |
9 |
8 |
8 |
9 |
27 |
| a + 1% polymer |
35 |
28 |
23 |
20 |
11 |
10 |
9 |
11 |
8.8 |
| b |
14 |
11 |
9 |
8 |
6 |
6 |
6 |
11 |
56.8 |
| b + 5% polymer |
14 |
9 |
8 |
6 |
4 |
4 |
4 |
4 |
12.4 |
| c |
27 |
21 |
19 |
16 |
11 |
10 |
10 |
13 |
105.6 |
| c + 5% polymer |
21 |
12 |
9 |
5 |
3 |
3 |
3 |
3 |
20 |
| d |
13 |
11 |
10 |
8 |
6 |
6 |
6 |
9 |
73.6 |
| d + 5% polymer |
14 |
9 |
8 |
6 |
4 |
4 |
4 |
6 |
22.8 |
3.3 Copolymer in the drilling fluid
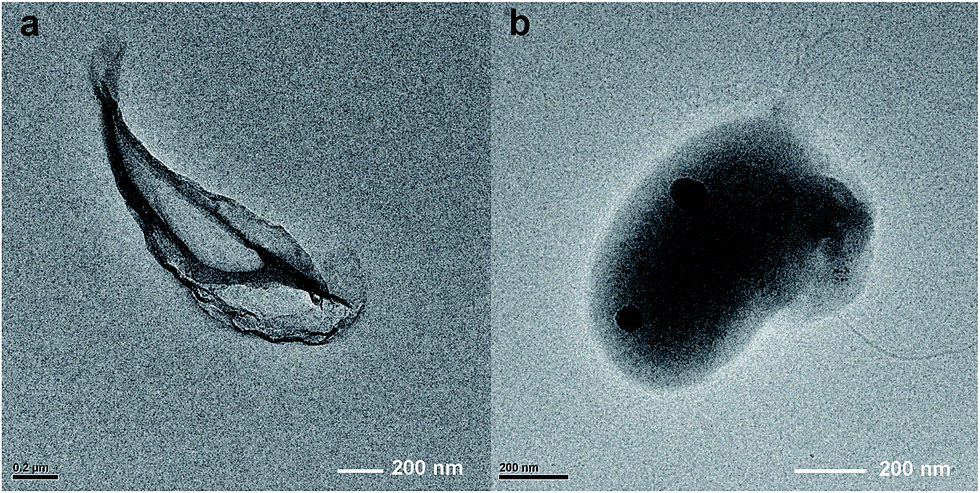
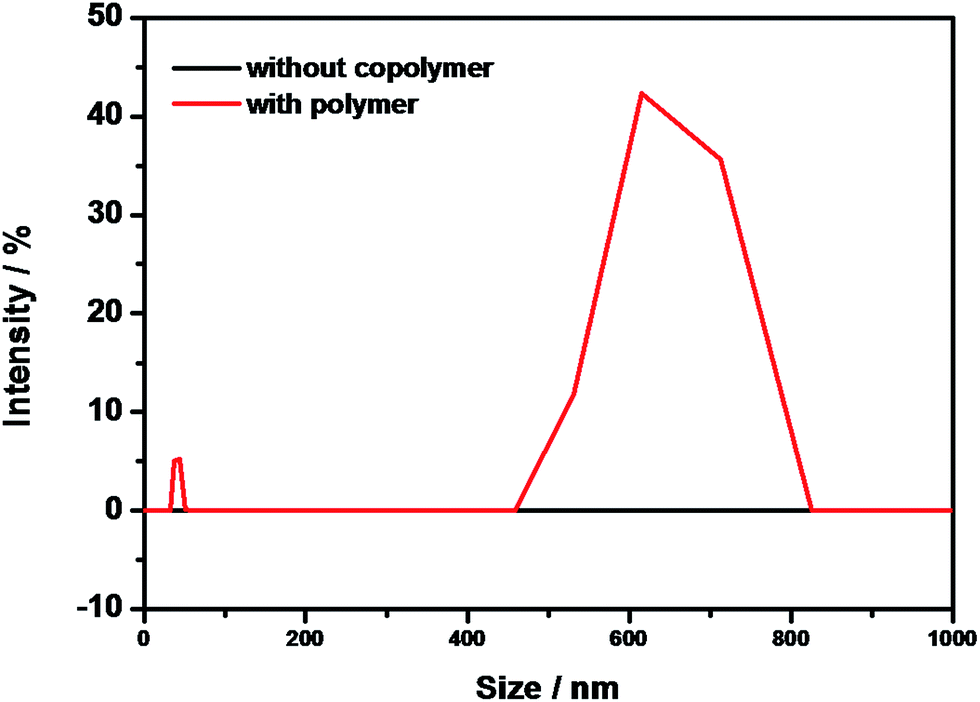
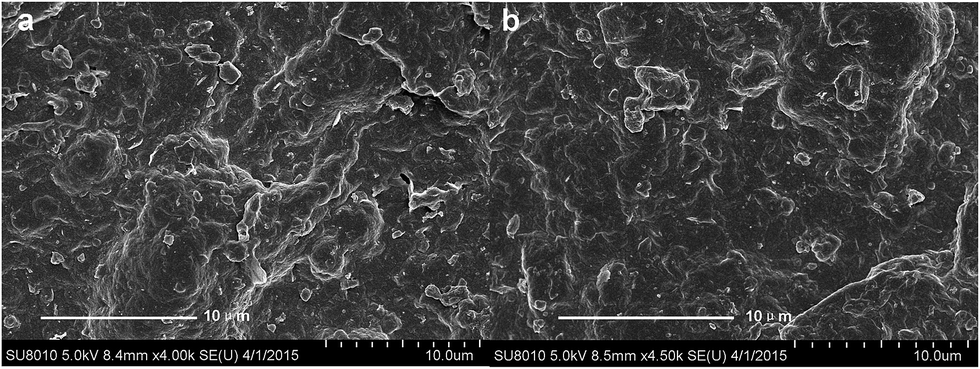
The copolymer in nm scale has been proven in the above analysis. Firstly, we should prove that the copolymer was in nm scale. What is even more important, we should prove that the copolymer was in nm scale in the MMT solution which was the important additive to prepare the drilling fluid. The particle size analysis of the MMT solutions with and without the copolymer was showed in Fig. 12. The peak from 2000 nm to 5000 nm was observed in the MMT solution and no peak in nm scale appeared. In the MMT solution with the copolymer, there was one peak in nm scale observed. Another peak was in 1000 nm scale and the 5 μm peak appeared. In the addition of the copolymer, part of the copolymer resulted in the aggregation of MMT due to the repulsion of the negative charge and the other part was dispersed in the MMT solution in nm scale. A similar observation is showed in the TEM images (Fig. 13). A sheet of MMT was observed in the image without the copolymer. No nano particle appeared (Fig. 13a). Two nano particles were observed on the MMT sheet and the size of the MMT sheet increased due to the interaction between MMT and the copolymer. Further proof was given that part of the copolymer was still in nm scale in the MMT solution and of the strong interaction between the copolymer and MMT. To further study the size of the copolymer in the drilling fluid, the filter liquors of the MMT solution with and without the copolymer were prepared as described in the method section. The particle size analysis of the filter liquor is showed in Fig. 14. No peak under 1000 nm appeared in the filter liquor without the copolymer. One of the peaks under 100 nm and another peak under 1000 nm were observed in the filter liquor with the copolymer. The results showed that the copolymer as a nano fluid loss agent was in nm scale in the drilling fluid. The place of the peaks were different from the peaks mentioned in Fig. 12. The residual MMT in the filter liquor went through the pores of the filter paper. Most of MMT had been blocked by the filter paper. The size of the composition of MMT in the filter liquor was different from the pristine MMT solution. Most of the copolymer had been interacted with MMT and a small amount of the copolymer passed through the filter paper and entered into the filter liquor. The different solutions lead to the different peaks. TEM images of the filter liquor are presented in Fig. 15. The sheet of MMT is shown in Fig. 15a. The size of the sheet was over 100 nm. It is a typical characterization of the MMT sheet. In addition of the copolymer, some small sheets under 100 nm appeared. It was in accord with the data mentioned in Fig. 14. Surface area analyses of rock with the copolymer and without were measured using a surface area analyzer (BET). As showed in Table 2, surface area, pore volume and pore size reduced with the copolymer. The results exhibited that pores of shale have been partly plugged by the copolymer. Nano silica and modified nano silica were inorganic nano materials. These nano materials aggregated seriously in the water solution. They could not enter into the nanopores of shale due to aggregation. SEM images of the filter cake of the fluid with and without the copolymer are showed in Fig. 16. The filter cake of the fluid without the copolymer was sag and crest, indicting the filter cake was loose. The filter cake was smooth after adding the copolymer. The compact film was made due to the interaction between the copolymer and the MMT particle. This compact film resulted in the high performance fluid loss property of the copolymer.
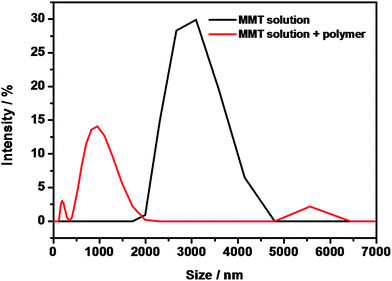 |
| | Fig. 12 Particle size analysis of MMT solutions with and without the copolymer. | |
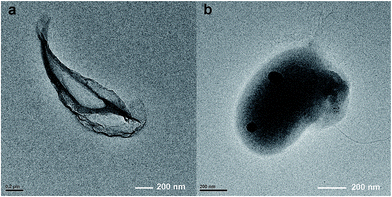 |
| | Fig. 13 TEM images of the MMT solutions with and without the copolymer. (a) Without the copolymer and (b) with the copolymer. | |
 |
| | Fig. 14 Particle size analysis of the filter liquor based on the fluid with and without the copolymer. | |
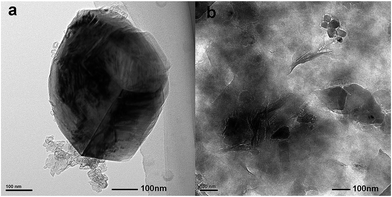 |
| | Fig. 15 TEM images of the filter liquor based on the fluid with and without the copolymer. (a) Without the copolymer and (b) with the copolymer. | |
Table 2 Surface area analysis of rock with the copolymer and without the copolymer
| Sample |
Surface area (m2 g−1) |
Pore volume (cm3 g−1) |
Pore size (nm) |
| Rock |
16.17 |
0.0186 |
4.65 |
| Rock + nano-polymer |
13.83 |
0.0165 |
4.52 |
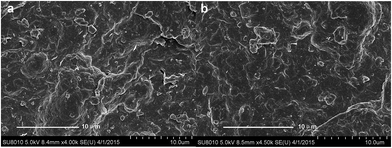 |
| | Fig. 16 SEM images of the filter cake based on the fluid with and without the copolymer. (a) Without the copolymer; (b) with the copolymer. | |
3.4 Probable mechanism
The copolymer was synthesized by free radical polymerization in a water solution based on acrylamide (AM), 2-acrylamido-2-methyl-1-propane sulfonic acid (AMPS) and modified nano-silica (M-SiO2). The polymerization degree was controlled by interaction conditions. AM and AMPS was polymerized and grafted on the surface of M-SiO2, the negative charge of the grafted copolymer resulted in the stabilization of the nano copolymer based on the Cullen theorem. The results mentioned above proved that the copolymer was still on a nano scale both in water solution and MMT solution. AM was widely used to produce oil chemistry products. Acylamino in AM and AMPS was a strong adsorption group, which can be adsorbed on the surface of the rock through hydrogen bonds. AMPS exhibited high temperature and salt resistance. M-SiO2 showed high temperature resistance. The addition of AMPS and M-SiO2 enhanced the temperature resistance. The adsorption groups were adsorbed on the surface of MMT duo to high performance of the fluid loss property. Meanwhile the copolymer can enter into the nanopores of shale to plug the nanopores. The cooperative interaction of the filtration property and the plugging of the nanopores of shale endowed the copolymer with high performance as a fluid loss agent in various drilling fluid systems.
4. Conclusion
In summary, we synthesized a nano grafted copolymer under fixed reaction conditions based on previous work. The structure was characterized in that AM and AMPS were grafted on the surface of M-SiO2 and the grafted copolymer was in nm scale both in water and MMT solution. The negative charge of the grafted copolymer resulted in the stabilization of the nano copolymer as the same charges repel each other. The filtration property of the copolymer was studied using a drilling fluid filter press in a fresh water drilling fluid system and different kinds of salt water drilling fluid systems. The filtration property of the copolymer was equal to a conventional fluid loss agent in a fresh water drilling fluid system. The resistance properties to salinity, calcium and high temperature were studied, and the results showed that the copolymer was resistant to a temperature of 150 °C, resistant to salt up to saturation and calcium to 1 wt%. The interaction mechanism between montrillonite (MMT) and the copolymer was studied using a particle size analyzer, transmission electron microscopy, scanning electron microscopy and a surface area analyzer. The adsorption of the copolymer on the surface of MMT was a major driving force. Compared to pristine MMT, the addition of the copolymer resulted in new peaks in the particle size analyzer image. The filter liquor of the drilling fluid with a copolymer showed two peaks in nm scale and the filter liquor of the drilling fluid without the copolymer showed that no peak appeared under 1000 nm. All the results presented that the copolymer as fluid loss agent was a nano material in the drilling fluid. Surface area analyzer (BET) results showed the reduction of the surface area of natural rock after treatment with the copolymer, indicating that the copolymer entered into nanopores of shale because of the adsorption on the surface of shale. The copolymer exhibited high performance as a fluid loss agent. Some problems still exist. The mechanism of the copolymer needs to be studied further and the plugging property needs to improve. The compatibility with other agents was not clear. The next work is in progress.
Acknowledgements
We would like to thank for the financial support from the National Natural Science Foundation of China (51474231), Foundation for innovative Research Groups of the Natural Science Foundation of China (51221003), National 863 Foundation of China (2013AA064803 and 2012AA091502) and New method and technology Foundation of China National Petroleum Corporation (2014A-4212) for this work.
References
- M. K. Rahman, D. Naseby and S. S. Rahman, J. Pet. Sci. Eng., 2000, 28, 13–31 CrossRef CAS.
- M. A. Mohiuddin, K. Khan, A. Abdulraheem, A. Al-Majed and M. R. Awal, J. Pet. Sci. Eng., 2007, 55, 83–92 CrossRef CAS.
- M. Josh, L. Esteban, C. Delle Piane, J. Sarout, D. N. Dewhurst and M. B. Clennell, J. Pet. Sci. Eng., 2012, 88–89, 107–124 CrossRef CAS.
- G. Chen, M. E. Chenevert, M. M. Sharma and M. Yu, J. Pet. Sci. Eng., 2003, 38, 167–176 CrossRef CAS.
- F. Civan, C. S. Rai and C. H. Sondergeld, SPE Journal, 2012, 717–726 CrossRef.
- F. Boukadi, Y. Sardooee Nsab, A. Hayatdavoudi and G. Mensa-Wilmot, Shale Drilling: The Impact of Shale Chemo-physical Constituents on the Issue of Poor Drilling Performance at Depth, Society of Petroleum Engineers, 2013, SPE-164092 Search PubMed.
- V. X. Nguyen and Y. N. Abousleiman, Real-Time Wellbore-Drilling Instability in Naturally Fractured Rock Formations with Field Applications, Society of Petroleum Engineers, 2010, SPE-135904 Search PubMed.
- O. T. Salami and J. Plank, J. Appl. Polym. Sci., 2013, 129, 2544–2553 CrossRef CAS.
- A. Büyükyağcı, G. Tuzcu and L. Aras, Cem. Concr. Res., 2009, 39, 629–635 CrossRef.
- J. A. Shatkin and W. North, Risk Analysis, 2010, 30, 1627–1633 CrossRef PubMed.
- Y. Song, Y. Luo, C. Zhu, H. Li, D. Du and Y. Lin, Biosens. Bioelectron., 2016, 76, 195–212 CrossRef CAS PubMed.
- M. Sopotnik, A. Leonardi, I. Križaj, P. Dušak, D. Makovec, T. Mesarič, N. P. Ulrih, I. Junkar, K. Sepčić and D. Drobne, Carbon, 2015, 95, 560–572 CrossRef CAS.
- S. F. Oliveira, G. Bisker, N. A. Bakh, S. L. Gibbs, M. P. Landry and M. S. Strano, Carbon, 2015, 95, 767–779 CrossRef CAS.
- H. Wigger, S. Hackmann, T. Zimmermann, J. Köser, J. Thöming and A. von Gleich, Sci. Total Environ., 2015, 535, 160–171 CrossRef CAS PubMed.
- S. Akhtarmanesh, M. J. A. Shahrabi and A. Atashnezhad, J. Pet. Sci. Eng., 2013, 112, 290–295 CrossRef CAS.
- M. Riley, S. Young, E. Stamatakis, Q. Guo, L. Ji, G. De Stefano, K. Price and J. Friedheim, Wellbore Stability in Unconventional Shales - The Design of a Nano-Particle Fluid, Society of Petroleum Engineers, 2012, SPE-153729 Search PubMed.
- M. M. Sharma, M. E. Chenevert, Q. Guo, L. Ji, J. Friedheim and R. Zhang, A New Family of Nanoparticle Based Drilling Fluids, Society of Petroleum Engineers, 2012, SPE-160045 Search PubMed.
- S. Gou, T. Yin, Z. Ye, W. Jiang, C. Yang, Q. Xia and M. Wu, J. Appl. Polym. Sci., 2015, 132, 41238 CrossRef.
- R. D. Lentz, Geoderma, 2015, 241–242, 289–294 CrossRef CAS.
- N. Limparyoon, N. Seetapan and S. Kiatkamjornwong, Polym. Degrad. Stab., 2011, 96, 1054–1063 CrossRef CAS.
- W. Song, X. Wang, Q. Wang, D. Shao and X. Wang, Phys. Chem. Chem. Phys., 2015, 17, 398–406 RSC.
- M. Z. Rong, M. Q. Zhang, Y. X. Zheng, H. M. Zeng, R. Walter and K. Friedrich, Polymer, 2001, 42, 167–183 CrossRef CAS.
- M. Z. Rong, M. Q. Zhang, Y. X. Zheng, H. M. Zeng and K. Friedrich, Polymer, 2001, 42, 3301–3304 CrossRef CAS.
- L. F. Cai, X. B. Huang, M. Z. Rong, W. H. Ruan and M. Q. Zhang, Polymer, 2006, 47, 7043–7050 CrossRef CAS.
- S. Hayashi, Y. Takeuchi, M. Eguchi, T. Iida and N. Tsubokawa, J. Appl. Polym. Sci., 1999, 71, 1491–1497 CrossRef CAS.
- R. Yokoyama, S. Suzuki, K. Shirai, T. Yamauchi, N. Tsubokawa and M. Tsuchimochi, Eur. Polym. J., 2006, 42, 3221–3229 CrossRef CAS.
- J. Ueda, S. Sato, A. Tsunokawa, T. Yamauchi and N. Tsubokawa, Eur. Polym. J., 2005, 41, 193–200 CrossRef CAS.
- Y. Shirai, K. Shirai and N. Tsubokawa, J. Polym. Sci., Part A: Polym. Chem., 2001, 39, 2157–2163 CrossRef CAS.
- M. Satoh, K. Shirai, H. Saitoh, T. Yamauchi and N. Tsubokawa, J. Polym. Sci., Part A: Polym. Chem., 2005, 43, 600–606 CrossRef CAS.
- H. Zou, S. Wu and J. Shen, Chem. Rev., 2008, 108, 3893–3957 CrossRef CAS PubMed.
- L. Ghannam, J. Parvole, G. Laruelle, J. Francois and L. Billon, Polym. Int., 2006, 55, 1199–1207 CrossRef CAS.
|
| This journal is © The Royal Society of Chemistry 2016 |
Click here to see how this site uses Cookies. View our privacy policy here. 
![[thin space (1/6-em)]](https://www.rsc.org/images/entities/char_2009.gif) 000 rpm and aged for 24 h at room temperature. The nano copolymer was poured into montrillonite suspensions slowly while stirring. The nano copolymer fluids were stirred for 20 min at 10
000 rpm and aged for 24 h at room temperature. The nano copolymer was poured into montrillonite suspensions slowly while stirring. The nano copolymer fluids were stirred for 20 min at 10