S. Pouchab,
F. Triozonab,
N. Chevalierab,
T. Mélinc,
Y.-M. Niquetad and
Ł. Borowik*ab
aUniv. Grenoble Alpes, F-38000 Grenoble, France
bCEA, LETI, MINATEC Campus, F-38054 Grenoble, France. E-mail: Lukasz.Borowik@cea.fr
cInstitut d'Electronique de Microélectronique et de Nanotechnologie, CNRS-UMR 8520, Avenue Poincaré, CS 60069, 59652 Villeneuve d'Ascq Cedex, France
dCEA, INAC-SP2M, L_Sim, Grenoble, France
First published on 11th January 2016
Kelvin force microscopy provides a spatially resolved measurement of the surface potential, which is related to the energetic band structure of a material. The goal of this work is to investigate the surface potential on Al0.7Ga0.3As and GaAs heterostructures with a decreasing layer thickness up to a few nanometers. We show that all the Kelvin force microscopy measurements on such a structure show a decreasing contrast relative to the layer thickness which remains the same despite the fact that measurements are done with various atomic force microscopy tip apexes. We prove that this contrast limitation is not due to the resolution limit of the Kelvin force microscopy technique, but is due to an intrinsic property of the sample. We evaluate by a self-consistent simulation, that the depletion layers located at the Al0.7Ga0.3As and GaAs interfaces of the narrowest stripes recover each other, which results in the partial or total loss of the contrast between Al0.7Ga0.3As and GaAs layers. Consequently, by Kelvin force microscopy we are able to detect the surface potential signal in the nanometer scale which is induced by the band bending between Al0.7Ga0.3As and GaAs and does not depend only on the experimental setup.
BAM-L200 sample [Fig. 1] is fabricated by the “Bundesanstalt für Materialforschung und prüfung” company.15 It consists in Al0.7Ga0.3As layers with decreasing thicknesses, on GaAs substrate. The thickness of each layer is certified by transmission electron microscopy. For this study we will use two regions of BAM-L200 sample represented on Fig. 1(a1) and (a2). The Al0.7Ga0.3As/GaAs doublet layers indexed from P1 to P8 and from P9 to P14 are respectively certified from 587 to 76.5 nm and from 76.5 nm to 17.5 nm. There is also another area where: the doublet layers indexed from P15 to P17 are certified from 13.3 nm to 6.9 nm and the doublet layers indexed from P18 to P20 are not certified but estimated from 4.6 nm to 2 nm. Separated Al0.7Ga0.3As layers indexed W8, W10 and W11 are certified at 38 nm, 14.2 nm and 3.5 nm. The sample area with In0.2Ga0.8As layers will not be analyzed in this work. More information on how the certification was made can be found in the certification report of the sample.17 The sample is homogeneously n doped (Si), with n = 5 × 1017 cm−3.
Fig. 1 (a1) and (a2) Represents two regions of interest on BAM L-200 sample. The Al0.7Ga0.3As/GaAs doublet layers indexed from P1 to P8 and from P9 to P14 are respectively certified from 587 to 76.5 nm and from 76.5 nm to 17.5 nm. The separated Al0.7Ga0.3As layers indexed W8, W10 and W11 are certified at 38 nm, 14.2 nm and 3.5 nm. Area with the thinnest doublet layers indexed from P15 to P17 are certified from 13.3 nm to 6.9 nm, the doublet layers indexed from P18 to P20 are not certified but estimated from 4.6 nm to 2 nm. (b) Band diagram for GaAs/Al0.7Ga0.3As junction.18–20 |
On Fig. 1(b) we present the band diagram for the GaAs/Al0.7Ga0.3As heterojunction.18–20 Specifically, the energy diagram of AlxGa1−xAs with respect to the concentration x of aluminum was calculated using the work of Levinstein et al.19 We obtain χ (electronic affinity), Eg (band gap) and m* (effective electron mass) for Al0.7Ga0.3As. The values of χ and m* for both materials are given in the theoretical section. Afterwards, m* is related to Nc (equivalent density of state in the conduction band, in cm−3)20 by equation: Nc = 4.83 × 10¹⁵(m* × T)3/2, where m* is the effective mass in units of the electron mass, and T is the temperature in Kelvins. Knowing the concentration of donor dopants n = 5 × 1017 cm−3, we calculate the difference between the Fermi level Ef and the conduction band energy Ec for GaAs and Al0.7Ga0.3As using Fermi–Dirac statistics:20
Here we use KFM to investigate BAM L-200 structure, which is one of the techniques used to detect the contact potential difference (CPD) which is equal to the work function difference between sample and atomic force microscopy (AFM) tip (see ref. 21 for further information). In KFM, an electrostatic excitation (DC + AC voltage) is applied to the tip at the cantilever resonance frequency. The electrostatic excitation generates a cantilever oscillation (or resonance frequency shift) if the cantilever DC bias does not match the CPD. To measure CPD, a DC bias feedback is introduced in order to nullify the cantilever oscillation (i.e. amplitude modulation) or frequency shift (i.e. frequency modulation) at the electrostatic excitation angular frequency. This generates a CPD map. Here, we use both amplitude modulation (AM) and frequency modulation (FM) KFM systems, besides, we use non-contact AFM22 and KFM modes simultaneously.
All measurements have been performed with an Omicron Nanotechnology VT-AFM UHV system with a Nanonis controller (SPECS Zürich). In this study we use three kinds of tips. The first is Budgetsensors ElectriMulti75 G (EM75) Cr–Pt coated tips commonly used for electric modes like KFM. Its tip radius is around 25 nm, its fundamental resonant frequency is around 67 kHz. The second consists in an EM75 tip overcame by a tungsten overtip (EM75W), deposited by electron beam-induced deposition in a focused ion-beam microscope. The third is a nanosensors super sharp silicon (SSS) tip often used for high resolution measurements. Its tip radius is between 2 and 5 nm, its fundamental resonance frequency around 300 kHz. SSS tip was sputtered with an argon beam at 4 keV during 20 min in order to get rid of isolating silicon oxide. Using the method derived from the work of Giessibl,23 we estimate the AFM peak-to-peak oscillation amplitude. Distance between sample and oscillating tip is measured by using approach–retract curves as a function of cantilever detuning frequency Δf.
At each position of the tip, the self-consistent calculation is performed for 3 values of the tip potential, which defines a parabola for the tip voltage dependence of the vertical component of the force Fz(Vtip). It has been checked that the parabolic approximation is very good despite the non-linear relation between the free carrier density and the potential. The extremum of the parabola gives the tip voltage which minimizes the force, which is measured in AM-KFM. Simulations were performed at various tip-sample distances ranging from 1 nm to 21 nm. This allowed extracting the tip voltage which minimizes the force derivative dFz/dz, which is measured in FM-KFM.
To check the best spatial resolution that our instrument is able to achieve we switch to the sample region presented in the Fig. 1(a2). A systematic study (not shown here) has been performed to adjust the detuning frequency shift and the oscillation amplitude to maximize the CPD sensitivity. We also adjusted the scan speed and all feedback gains to not have artificial influence on CPD. We present here averaged (20 lines) CPD cross sections in order to compare CPD measurements. At the beginning, we made the measurement by AM KFM [Fig. 3(a)], but finally we choose FM KFM mode, which provides a higher CPD difference (between Al0.7Ga0.3As and GaAs layers) comparing to the AM KFM measurement. Such higher CPD difference is due to the fact that the FM mode signal is proportional to the force gradient and not to the force directly as in AM mode.21 As described previously, FM KFM sample characterizations were performed with three kinds of AFM tips: EM75, EM75W, SSS [Fig. 3(a–c)].
All KFM measurements show a decreasing contrast relative to the layer thickness. Apart from the AM KFM characterization which is indeed less resolved, we notice that every FM KFM cross-section is very similar in terms of relative differences of CPD. The potential tendency seems to remain the same despite the fact that each of these measurements was done using different AFM tips.
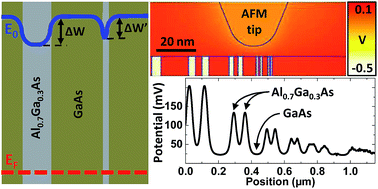
For the better understanding of CPD evolution on BAM-L200 sample we performed 3D simulations of the electrostatic potential. Firstly, we simulate only the sample structure without the AFM tip apex on the same sample region as characterized by KFM on Fig. 3. On Fig. 4(a1) we present the 2D potential cross-section made perpendicularly to sample surface, through all the layers of interest. The 1D potential cross-sections using 1, 3 and 9 nm distances from the sample surface are shown on Fig. 4(a2), where decrease of the electrostatic potential as a function of distance is visible due to receding from the Al0.7Ga0.3As/GaAs interface dipoles.
By comparing experimental CPD and calculated electrostatic potential values we conclude that the decreasing tendency is very similar. Consequently, the assumption that CPD evolution for BAM L-200 sample depends only on the KFM experimental setup is wrong. Here this evolution is intrinsic to the sample electronic properties.
In order to compare the calculated electrostatic potential with a KFM CPD signal, we introduce to our simulation the AFM tip apex and we calculate the CPD signal. To do so, we use the theoretical protocol described elsewhere,25 and we model AFM tip with respect to EM75 geometry. Therefore, we are able to implement tip position anywhere above the sample surface and to calculate CPD. On Fig. 4(b1) we present the 2D potential cross-section made perpendicularly to sample surface, through all the layers of interest and the AFM tip. FM KFM CPD calculated using 1, 3 and 9 nm distances between the tip and the sample is presented on the Fig. 4(b2). In that case, the CPD variations are equivalent to the electrostatic potential variations but convoluted with the shape of the tip. Thus, it is natural that CPD variations follow the variations of electrostatic potential.
For the quantitative comparison of the experimental and calculated results we introduce a contrast parameter, defined as:
On Fig. 4(c) we compare calculated and experimental contrasts for the area designed in Fig. 1(a2) by using the results presented on Fig. 3(b–d) and Fig. 4(a2 and b2) considering 3 nm of distance from the sample surface. Measurements and simulation using FM KFM, as well as, simulation of electrostatic potential without AFM tip show very similar contrast evolution. For the thickest GaAs layer (38.5 nm), the contrast is around 30%, and it decreases to 0 for the smallest layers (<5 nm). The decreasing contrast tendency is the same for each curve. Resemblance of all FM KFM contrasts with electrostatic potential simulated 3 nm above the sample surface confirms that CPD evolution depends mainly on the intrinsic evolution due to the sample electronic properties and not only KFM resolution limit.
We understand that this phenomenon is due to the narrowness of the Al0.7Ga0.3As and GaAs layers. A carrier depletion layer creates a band bending at every interface between two semi-conductors. Moreover, in the case of very thin layers, the depletion layers will overlay, creating a band bending covering. Such phenomenon becomes more and more important as the thickness of the layers decreases. Due to the band bending covering, the energy difference (ΔW′) between the local vacuum levels of GaAs and Al0.7Ga0.3As becomes smaller than the work function difference between the thick layers (ΔW = 0.5 eV) [Fig. 4(d)]. As we have found before, the thickness of the depletion layer between Al0.7Ga0.3As and GaAs is L ≈ 50 nm. Thus, in the case of analyzed area (the regions from P9 to P20, where the layer thickness changes from 38.5 nm to 1 nm), the band bending covering is affecting our entire FM KFM measurement. Consequently, FM KFM is able to detect changing in the band bending at a nanometer scale, and reliable quantitative contrast values (i.e. not significantly influenced by FM KFM resolution limit) between Al0.7Ga0.3As and GaAs layers.
This journal is © The Royal Society of Chemistry 2016 |