 Open Access Article
The importance of raw graphite size to the capacitive properties of graphene oxide†
Haoran
Yu
a,
Keyu
Xie
*a,
Jingzhi
Hu
a,
Chao
Shen
a,
Jian-gan
Wang
a and
Bingqing
Wei
*ab
aState Key Laboratory of Solidification Processing and Center for Nano Energy Materials, Northwest Polytechnical University, Xi’an 710072, China. E-mail: kyxie@nwpu.edu.cn
bDepartment of Mechanical Engineering, University of Delaware, Newark, DE19716, USA. E-mail: weib@udel.edu; Fax: +1-302-831-3619; Tel: +1-302-831-6438
First published on 29th January 2016
Abstract
Carbon-based materials have been widely used in energy storage and conversion devices. Among them, graphene oxide (GO) holds much promise for supercapacitor applications due to its high-capacitance, low-cost, etc. Nevertheless, intrinsic characteristics related to the capacitive properties of GO are far from being fully understood. Little attention has been paid to the size effect of raw graphite on the electrochemical characteristics of GO. In order to investigate the relationship between raw graphite size and the capacitive properties of GO, electrochemical performances of GO, prepared from raw graphite of three different sizes using a modified Hummer’s method, were compared. Experimental results indicated that the capacitance of a GO electrode was enhanced with the increasing size of the raw graphite. The GO electrode prepared with the largest size of raw graphite achieved a specific capacitance as high as 94.4 F g−1 at 0.1 A g−1 due to a medium-sized specific surface area and smaller charge transfer resistance. It is concluded that more attention should be paid to the prevention of agglomeration or even restacking of the graphene-based material after the heat drying of graphene-based solutions because of residual intercalated water molecules, which contribute to strong hydrogen bonding interactions between layers.
Introduction
With the development of society and the economy, the energy crisis and environmental pollution are becoming the most important issues.1–3 There is a high demand for environmentally friendly and novel renewable energy power sources. With fast and safe charge/discharge capabilities, long-term cycle stability and excellent reversibility, supercapacitors, also called electrochemical capacitors or ultracapacitors, are becoming attractive substitute sources.4–6In a common supercapacitor, carbon materials play a principal and irreplaceable role in the energy-storage performance.7–9 Currently, there is a wide variety of carbon-based materials that have served as electrodes for supercapacitors, including activated carbons, carbon gels, carbon fibers, carbon nanotubes, graphene, and graphene oxide (GO).10 Among them, graphene has high electrical conductivity and a large theoretical surface area of 2670 m2 g−1, which make it an ideal electrode material of supercapacitors. However, there are a few short-comings to the synthesis of high quality graphene: mechanical exfoliation of graphite flakes is a serendipitous method that only contributes to uneven films and is not suitable for large-scale production; epitaxial growth is a high-temperature process that is beyond the control of morphology and adsorption energy; the reduction of GO is a promising approach but the reduction to graphene is only partial with a fragile stability of the colloidal dispersion.11–13 Therefore, graphene still needs to compete with activated carbons in terms of cost and performance in order to be utilized in actual production. Nonetheless, the intermediate GO bears an interesting potential as a supercapacitor electrode material owing to its low cost and high capacitance. During the formation of GO, the conjugated structure is disrupted and the π-electrons are localized by the embedding of covalent functional groups. Afterwards, the covalent functional groups enhance the total capacitance through pseudo-capacitance. Also, they are functional sites and offer more opportunities for a secondary modification, such as doping with nitrogen or phosphorus.14 Taking its lower cost and high capacitance into account, GO may be a better choice than graphene as an electrode material for supercapacitors.15 A capacitance of up to 159 F g−1 in H2SO4 and 82 F g−1 in (C2H5)4NBF4/acetonitrile was reported for GO,10 and it showed a much higher volumetric capacitance than the majority of other carbon materials, which is a key factor for the development of energy storage devices. A higher capacitance of up to 189 F g−1 was obtained with GO electrodes in a symmetrical two-electrode cell.15 However, little attention has been focused on the size effect of raw graphite on the electrochemical characteristics of GO for supercapacitors. It would be valuable to study the relationship between raw material size and the electrochemical performances of GO.
Herein, this paper mainly addresses a comparison of the electrochemical performances of GO prepared using a modified Hummers method from three different raw graphite sizes. It was found that the capacitance of the GO electrode is enhanced with the increasing size of the raw graphite. In addition, how to prevent GO from agglomerating or even restacking is also discussed. Our work will provide practical guidance to the synthesis of GO-based electrode materials for supercapacitors.
Experimental
Synthesis of GO
GO was prepared using a well-known modified Hummer’s method, which has been described in detail elsewhere.16,17 The raw materials were natural graphite particles with sizes of 80–120 mesh, 750–850 mesh, and 2000 mesh (Aladdin), and the corresponding samples were designated as GO (100 mesh), GO (800 mesh), and GO (2000 mesh), respectively. Briefly, these raw graphite particles (0.5 g) were preoxidized with sulfuric acid (25 ml) for 30 min at room temperature. Then, sodium nitrate (0.5 g) and potassium permanganate (3 g) were slowly dispersed into the mixture, which was immediately transferred into an ice bath with a temperature below 20 °C for 2 h. Next, this mixture was stirred when the temperature was increased to 35 °C. After oxidizing for 3 h, the obtained mixture was diluted with 140 ml of deionized water and stirred for another 2 h while being heated to a temperature of 95 °C. Then, hydrogen peroxide was poured into the mixture until the color of the mixture changed from brown to light yellow with no air bubbles being generated.. Afterwards, the obtained solution was washed with deionized water until the pH value became 6–7 to obtain GO. The GO suspension was sonicated for 30 min at a power of about 200 W. After a short rest for about 10 min, the suspension was ultrasonicated for 10 min (UP400S, 0.4 cycle, 80% intensity). The procedure above was repeated three times and the GO dispersion was obtained after centrifugation. Finally, the GO dispersion was dried at 80 °C in an air dry oven for about 24 h to get GO.Characterization techniques
The GO morphology was characterized using scanning electron microscopy (SEM, JSM6700E) and transmission electron microscopy (TEM, JEOL JEM-3010F). Raman spectra were obtained using a HORIBA JOBIN YVON HR 800 and a Renishaw inVia instrument. X-ray photoelectron spectroscopy (XPS) was performed on an ESCALAB250xi XPS system. XRD data were measured using an X-ray diffractometer (D/max-2400, Rigaku Tokyo, Japan). Nitrogen adsorption–desorption isotherms of the samples were determined using a Surface Area and Porosity Analyzer (ASAP 2020 HD88). Square resistances were tested using a four-point probe meter (SZT-2A).Electrochemical measurements
The electrochemical performances were tested on a workstation (Solartron analytical 1400 + 1470E) using a three-electrode system at room temperature. Consequently, nickel foam (15 mm × 15 mm) dipped into the active material slurry was selected as the working electrode. The active material (about 4 mg per electrode after drying) contained GO, carbon black and a polyvinylidene fluoride (PVDF) binder at a mass ratio of 7![[thin space (1/6-em)]](https://www.rsc.org/images/entities/char_2009.gif) :
:![[thin space (1/6-em)]](https://www.rsc.org/images/entities/char_2009.gif) 2
2![[thin space (1/6-em)]](https://www.rsc.org/images/entities/char_2009.gif) :
:![[thin space (1/6-em)]](https://www.rsc.org/images/entities/char_2009.gif) 1 dissolved in N-methyl-2-pyrrolidone (NMP). The electrode was dried at 60 °C in a vacuum oven for 24 h. Finally, the nickel foam coated with the active materials as the working electrode, a platinum foil as the counter electrode, a saturated calomel electrode as the reference electrode, and 6 M potassium hydroxide solution as electrolyte were used. Cyclic voltammetry (CV) was performed with a potential window from −0.8 V to 0 V at different scan rates (5, 10, 20, 30, and 50 mV s−1). Galvanic cycling (GC) was carried out with a voltage from −0.7 V to 0 V at various current densities (0.1, 0.2, 0.5, 1, and 2 A g−1). In addition, the cyclic stability of the GO electrodes at a current density of 1 A g−1 for 1500 cycles was measured using GC. Electrochemical Impedance Spectroscopy (EIS) measurements were performed over a frequency range of 0.01 Hz to 10 kHz.
1 dissolved in N-methyl-2-pyrrolidone (NMP). The electrode was dried at 60 °C in a vacuum oven for 24 h. Finally, the nickel foam coated with the active materials as the working electrode, a platinum foil as the counter electrode, a saturated calomel electrode as the reference electrode, and 6 M potassium hydroxide solution as electrolyte were used. Cyclic voltammetry (CV) was performed with a potential window from −0.8 V to 0 V at different scan rates (5, 10, 20, 30, and 50 mV s−1). Galvanic cycling (GC) was carried out with a voltage from −0.7 V to 0 V at various current densities (0.1, 0.2, 0.5, 1, and 2 A g−1). In addition, the cyclic stability of the GO electrodes at a current density of 1 A g−1 for 1500 cycles was measured using GC. Electrochemical Impedance Spectroscopy (EIS) measurements were performed over a frequency range of 0.01 Hz to 10 kHz.
Results and discussion
Morphological and structural characterizations
The shape, size and intrinsic structure of raw graphite powders are characterized using SEM, these images of graphite powders with 2000 mesh, 850–750 mesh and 120–80 mesh are presented in Fig. 1(a–c). In Fig. 1(a), the particles have a wide particle distribution, but basically the particle size is less than 20 μm. As indicated in Fig. 1(b), the particle size is about 20 to 40 μm. Fig. 1(c) shows a relatively integrated slice of graphite with a size of more than 100 μm. Fig. 1(d) shows a TEM image of GO (2000 mesh) prepared using the modified Hummer’s method. It demonstrates clearly that the prepared GO shows a silk veil-waves morphology with thin nanosheets.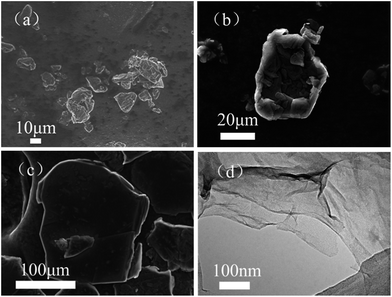 | ||
| Fig. 1 SEM images of the raw graphite. (a) 2000 mesh graphite, (b) 850–750 mesh graphite and (c) 120–80 mesh graphite. (d) TEM image of GO (2000 mesh). | ||
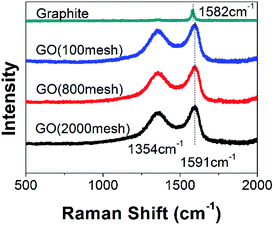
It is well known that the G band of a Raman spectrum is a typical representation of the E2g vibrational modes of the aromatic domains, whereas the D band is generated from the breathing modes of the graphitic domains.18–21 As shown in Fig. 2, obvious D and G bands are located at 1354 cm−1 and 1591 cm−1, respectively, the latter of which shifts a bit from the graphite Raman spectrum peak (1580 cm−1) after chemical oxidation. In addition, the intensity ratio of the D band to the G band (ID/IG) is used to estimate the degree of disorder in graphene.18 Compared to that of raw graphite, the ID/IG of all of the GOs obtained from different graphite sizes was increased dramatically, indicating high disorder in the GOs, arising from the addition of oxygen-containing functional groups.22 However, the sizes of the raw graphite have almost no effect on the Raman spectra, showing that the three samples have a similar graphitic degree.
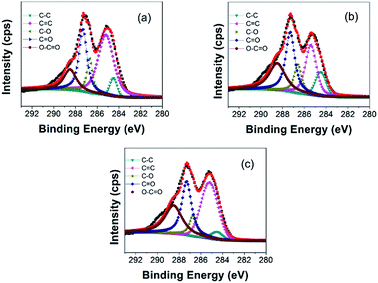
XPS characterizations are further employed to analyze the elemental compositions and the configurations of the oxygen-containing functional groups in GO. The binding energy of C–C is located at around 284.5 eV, and therefore the peaks of the oxygen-containing functional groups added to the graphite have a shift with respect to the C–C bond. In Fig. 3(a), the C1s spectrum of the GO (2000 mesh) can be fitted into five peaks centered at 284.5, 285.2, 286.7, 287.2, and 288.6 eV, which could be assigned to the non-oxygenated ring C atoms sp3 C (C–C) and sp2 C (C![[double bond, length as m-dash]](https://www.rsc.org/images/entities/char_e001.gif) C), the C atoms in the epoxy/ether groups (C–O), the carbonyl C structure (C
C), the C atoms in the epoxy/ether groups (C–O), the carbonyl C structure (C![[double bond, length as m-dash]](https://www.rsc.org/images/entities/char_e001.gif) O), and the carboxyl C structure (O–C
O), and the carboxyl C structure (O–C![[double bond, length as m-dash]](https://www.rsc.org/images/entities/char_e001.gif) O), respectively.23 It can be clearly seen that the XPS spectra of GO (800 mesh) (Fig. 3(b)) and GO (100 mesh) (Fig. 3(c)) are similar to that of GO (2000 mesh). Meanwhile, the molar ratios of C/O for GO (2000 mesh), GO (800 mesh), and GO (100 mesh) are obtained as 2.2, 2.1, and 2.2, respectively, indicating that the oxidation of the three different raw materials is at almost the same level.
O), respectively.23 It can be clearly seen that the XPS spectra of GO (800 mesh) (Fig. 3(b)) and GO (100 mesh) (Fig. 3(c)) are similar to that of GO (2000 mesh). Meanwhile, the molar ratios of C/O for GO (2000 mesh), GO (800 mesh), and GO (100 mesh) are obtained as 2.2, 2.1, and 2.2, respectively, indicating that the oxidation of the three different raw materials is at almost the same level.
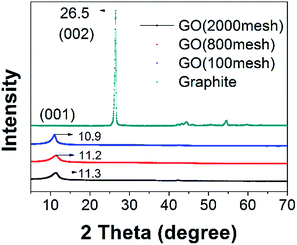
Fig. 4 shows XRD patterns of raw graphite, GO (2000 mesh), GO (800 mesh), and GO (100 mesh). In the XRD pattern of the raw graphite, there appears a (002) basal reflection with a sharp peak at 26.5°, and in the patterns for GO (2000 mesh), GO (800 mesh), and GO (100 mesh), broad peaks corresponding to (001) diffraction are found at 2θ = 11.3°, 11.2° and 10.9°, respectively. Using the following Bragg equation:
2d![[thin space (1/6-em)]](https://www.rsc.org/images/entities/char_2009.gif) sin sin![[thin space (1/6-em)]](https://www.rsc.org/images/entities/char_2009.gif) θ = nλ θ = nλ | (1) |
The hypothesis mentioned above is exactly substantiated by previous work.23,27 The formation of pristine GO occurs via the diffusion of an oxidizing agent into the graphite interlayer gallery, followed by a chemical reaction. Above all, this is the rate-determining step, and is diffusion-controlled by the oxidant replacing the acid intercalant.27 Consequently, graphite with a small size is oxidized significantly faster than large graphite, corresponding to there being more oxygen-containing functional groups between the layers under the same degree of oxidation, which contributes to strong hydrogen bonding interactions. Hence, hydrogen bonding interactions lead to the different interlayer spacing of the three samples, after the heat drying of GO solution, which coincides well with the XRD patterns. It is apparent that, in the preparation of GO, the GO would spontaneously agglomerate if there were no protective measures when heat drying GO solution.
Nitrogen adsorption–desorption isotherms at 77 K and pore size distributions of the three samples are shown in Fig. 5. It can be observed that all three samples belong to the type-I species according to IUPAC classification.28–30 The type-I isotherm evidently levels off below a relative pressure of 0.1 indicating that the GO samples are exclusively microporous. Moreover, the pore size distribution curves based on nonlinear density functional theory (NLDFT) confirm that the majority of these pores for the three GO samples were found to be less than 2 nm in diameter. As shown in Fig. 5, GO (2000 mesh), GO (800 mesh) and GO (100 mesh) have an undeveloped porosity with a specific surface area of 32, 89 and 62 m2 g−1, respectively, which is contributed to by the defects and structure of GO. The data obtained here are a little lower than previous results.15 This result may be attributed to the agglomeration, or even the restacking of GO destroying the pore structure and thus reducing the specific surface area. As for smaller particles, GO (2000 mesh) originally tended to possess a larger surface area, however, it contains more oxygen functional groups so that stronger hydrogen bonding interactions led to greater damage to the structure. This could be the reason that the specific surface area of GO (2000 mesh) is lower than that of GO (800 mesh). Evidently, GO suffers from severe restacking between individual sheets and thus loses its material identity and advantages. Therefore, the most important and challenging hurdle to achieve a high capacitance is to hinder the restacking of GO sheets. One of the approaches to solving this problem is the use of nonpolar aprotic “solvent”, which doesn’t interact with the oxygen groups of GO, thereby leading to the formation of crumpled non-stacked GO. For example, hydrophobic hexane as an anti-solvent was introduced to fabricate highly crumpled non-stacked GO nanosheets. By using hexane, it could be easily seen that the diffraction peak of GO was shifted from 11.38° to 10.36°.24 Another solution to eliminate hydrogen bonding is via a condensation reaction of the hydroxyl end groups of polymer monomers with the hydroxyl or carboxylic acid groups on the GO sheets. For instance, GO was functionalized in a solution state with melamine resin monomers and the hydrogen bonding interactions were successfully prevented.26 In fact, rapid freeze-drying may be useful to remove water molecules, because the fluffy porous structure could be maintained by freezing in less than 5 seconds. For example the specific area of GO (100 mesh) can be improved to 158 m2 g−1 using rapid freeze-drying (ESI Fig. S1†).
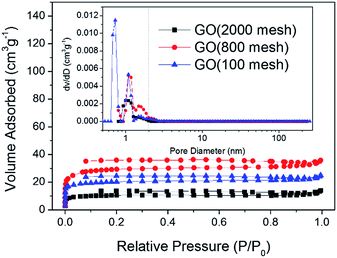 | ||
| Fig. 5 Nitrogen adsorption–desorption isotherms and pore size distribution curves (inset) for GO (2000 mesh), GO (800 mesh), and GO (100 mesh). | ||
Electrochemical analysis
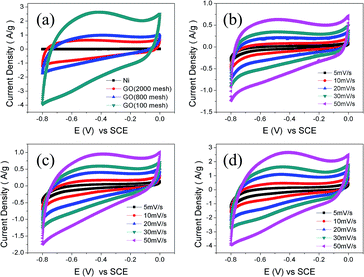
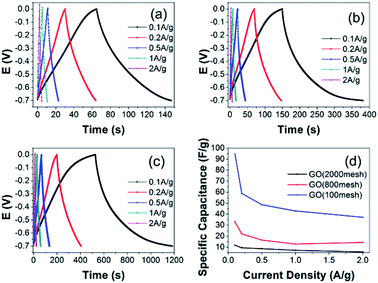
Cyclic voltammogram analysis is a universal method to evaluate capacitive behavior. As is known, GO has low conductivity. The square resistances of the GO samples are about 120 MOhm sq−1, measured using a four-point probe meter. Therefore a small quantity of carbon black was added to the electrode and nickel foam was used as a current collector. The CV curves of nickel foam and the three GO electrodes at 50 mV s−1 are shown in Fig. 6(a). Obviously, the current collector, nickel foam, has a negligible capacitance. The integrated areas for the GO electrodes intuitively grow with the increase of the raw graphite size, which is an indication of superior capacity and rapid diffusion of electrolyte ions from the solution into the pores of the electrodes made from larger raw materials. As shown in Fig. 6(b)–(d), the CV curves of GO (2000 mesh), GO (800 mesh), and GO (100 mesh) measured at low scan rates, exhibit an almost rectangular shape, while the CV curves become a little distorted at a high scan rate. Xu et al. investigated the rate capability of GO electrodes and demonstrated that the oxygen-containing functional groups could participate in quick pseudo-faradaic charge–discharge reactions. That means that GO electrodes have a quick charge propagation capability of both double layer capacitance and pseudo-capacitance.15To obtain a more accurate specific capacitance of the GO electrodes for supercapacitors, galvanic cycle tests were further performed according to eqn (2):
| C = (IΔt)/(mΔU) | (2) |
Typical Nyquist plots of the GO electrodes are shown in Fig. 8. The plots consist of a small semicircle at the high frequency region, which reflects the charge transfer process, and the inclined line in the low frequency range, representing the Warburg impedance, which shows the quick adsorption of ions onto the electrode surface and fast diffusion of ions. The observed equivalent series resistance (ESR) of GO (2000 mesh), GO (800 mesh), and GO (100 mesh) are similar and their charge transfer resistances decrease with the increase in raw graphite size. What’s more, GO (100 mesh) has the fastest diffusion of ions while GO (800 mesh) has the slowest, which may be ascribed to different porous structure. Based on the above experimental results, GO (800 mesh) possesses the largest specific surface area, yet the corresponding electrode does not have the highest specific capacitance, among the GO samples prepared from the three different sizes of raw graphite. The reason for this is that the electrode containing GO (800 mesh) has a larger charge transfer resistance and the lowest diffusion of ions. Hence, it could be concluded that the capacitive properties of GO-based electrodes for supercapacitors are highly dependent on pore structure, specific surface area and electrical conductance properties.
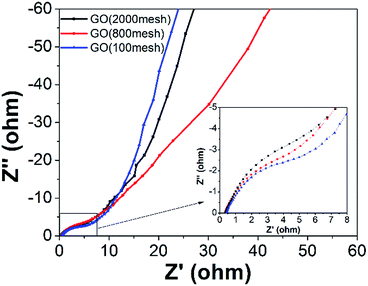 | ||
| Fig. 8 The Nyquist plots of the three GO electrodes (the inset shows the enlarged EIS in the high frequency region). | ||
Cycling lifetime is another important requirement to judge the electrochemical performances of electrodes. As shown in Fig. 9, there is almost no attenuation in the specific capacitance of all three GO electrodes after 1500 cycles, indicating that all of the GO samples have outstanding cycling stability. The XPS spectra of C1s in GO (100 mesh) after 1500 cycles show that some oxygen-containing functional groups were removed (ESI Fig. S2†), and the molar ratios of C/O of it increased to 2.7 from 2.2, which means that at least 82% of the oxygen-containing functional groups are stable, which maintains high capacitance.
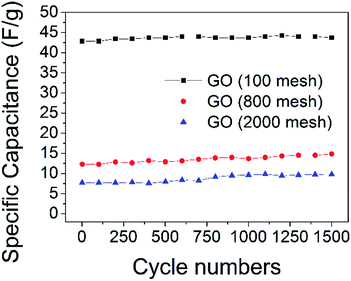 | ||
| Fig. 9 Specific capacitance of the GO electrodes for 1500 cycles, charge–discharge tests at a current density of 1 A g−1. | ||
Conclusions
To sum up, a comparison of the electrochemical performances of GO electrodes from three different raw graphite sizes was systematically performed. The specific capacitance of the electrodes was 94.4, 33.1 and 11.7 F g−1 for GO (100 mesh), GO (800 mesh) and GO (2000 mesh), respectively, at a current density of 0.1 A g−1. The capacitance of the GO electrodes is enhanced with the increasing size of the raw graphite. This is because the specific surface area and charge transfer resistance simultaneously have a significant influence on the performances of the GO electrodes. At the same time, the three GO electrodes possess preeminent cycling stability.As for the problem that appeared in the synthesis of GO, the decrease in specific surface area is from the contribution of hydrogen bonding interactions caused by intercalated water molecules. Further, small particles are more likely to agglomerate or even restack because of strong interactions between the GO layers. Thus, more attention should be paid to this problem in terms of synthesizing graphene oxide-based electrode materials for supercapacitors or other energy storage devices.
Acknowledgements
The authors acknowledge the financial support of this work by the National Natural Science Foundation of China (51302219, 51472204 and 51402236), the Natural Science Foundation of Shaanxi Province (2015JM2045), the Research Fund of the State Key Laboratory of Solidification Processing (NWPU), China (Grant No. 06-QP-2014), and the Fundamental Research Funds for the Central Universities (3102014JCQ01019 and 3102015BJ(II)MYZ02).Notes and references
- C. Liu, Z. Yu, D. Neff, A. Zhamu and B. Z. Jang, Nano Lett., 2010, 10, 4863–4868 CrossRef CAS PubMed.
- Y. Wang, Z. Shi, Y. Huang, Y. Ma, C. Wang, M. Chen and Y. Chen, J. Phys. Chem. C, 2009, 113, 13103–13107 CAS.
- Y. A. Kim, T. Hayashi, J. H. Kim and M. Endo, J. Energy Chem., 2013, 22, 183–194 CrossRef CAS.
- M. D. Stoller, S. Park, Y. Zhu, J. An and R. S. Ruoff, Nano Lett., 2008, 8, 3498–3502 CrossRef CAS PubMed.
- Q. Zhang, K. Scrafford, M. Li, Z. Cao, Z. Xia, P. M. Ajayan and B. Wei, Nano Lett., 2014, 14, 1938–1943 CrossRef CAS PubMed.
- Y. Huang, J. Liang and Y. Chen, Small, 2012, 8, 1805–1834 CrossRef CAS PubMed.
- E. B. Secor, P. L. Prabhumirashi, K. Puntambekar, M. L. Geier and M. C. Hersam, J. Phys. Chem. Lett., 2013, 4, 1347–1351 CrossRef CAS PubMed.
- T. Yumura and A. Yamasaki, Phys. Chem. Chem. Phys., 2014, 16, 9656–9666 RSC.
- X. Wang and G. Shi, Energy Environ. Sci., 2015, 8, 790–823 CAS.
- B. Lobato, R. Wendelbo, V. Barranco and T. A. Centeno, Electrochim. Acta, 2014, 149, 245–251 CrossRef CAS.
- C. Soldano, A. Mahmood and E. Dujardin, Carbon, 2010, 48, 2127–2150 CrossRef CAS.
- C. H. Lui, L. Liu, K. F. Mak, G. W. Flynn and T. F. Heinz, Nature, 2009, 462, 339–341 CrossRef CAS PubMed.
- P. W. Sutter, J. I. Flege and E. A. Sutter, Nat. Mater., 2008, 7, 406–411 CrossRef CAS PubMed.
- F. Su, C. K. Poh, J. S. Chen, G. Xu, D. Wang, Q. Li, J. Lin and X. W. Lou, Energy Environ. Sci., 2011, 4, 717–724 CAS.
- B. Xu, S. Yue, Z. Sui, X. Zhang, S. Hou, G. Cao and Y. Yang, Energy Environ. Sci., 2011, 4, 2826 CAS.
- W. S. Hummers Jr and R. E. Offema, J. Am. Chem. Soc., 1958, 1339 CrossRef.
- X. Zhang, K. Li, H. Li and J. Lu, J. Colloid Interface Sci., 2013, 409, 1–7 CrossRef CAS PubMed.
- A. C. Ferrari, Solid State Commun., 2007, 143, 47–57 CrossRef CAS.
- L. M. Malard, M. A. Pimenta, G. Dresselhaus and M. S. Dresselhaus, Phys. Rep., 2009, 473, 51–87 CrossRef CAS.
- Z. Ni, Y. Wang, T. Yu and Z. Shen, Nano Res., 2010, 1, 273–291 CrossRef.
- Z. H. Ni, T. Yu, Y. H. Lu, Y. Y. Wang, Y. P. Feng and Z. X. Shen, ACS Nano, 2008, 2301–2305 CrossRef CAS PubMed.
- S. Park and R. S. Ruoff, Nat. Nanotechnol., 2009, 4, 217–224 CrossRef CAS PubMed.
- D. R. Dreyer, S. Park, C. W. Bielawski and R. S. Ruoff, Chem. Soc. Rev., 2009, 39, 228–240 RSC.
- Y. Yoon, K. Lee, C. Baik, H. Yoo, M. Min, Y. Park, S. M. Lee and H. Lee, Adv. Mater., 2013, 25, 4437–4444 CrossRef CAS PubMed.
- M. Acik, C. Mattevi, C. Gong, G. Lee, K. Cho, M. Chhowalla and Y. J. Chabal, ACS Nano, 2010, 4, 5861–5868 CrossRef CAS PubMed.
- J. H. Lee, N. Park, B. G. Kim, D. S. Jung, K. Im, J. Hur and J. W. Choi, ACS Nano, 2013, 7, 9366–9374 CrossRef CAS PubMed.
- A. Dimiev and J. M. Tour, ACS Nano, 2014, 8, 3060–3068 CrossRef CAS PubMed.
- M. Kruk and M. Jaroniec, Chem. Mater., 2000, 12, 1961–1968 CrossRef CAS.
- M. Kruk and M. Jaroniec, Chem. Mater., 2001, 13, 3169–3183 CrossRef CAS.
- R. Ryoo, I.-S. Park, S. Jun, C. W. Lee, M. Kruk and M. Jaroniec, J. Am. Chem. Soc., 2001, 123, 1650–1657 CrossRef CAS PubMed.
- Y. Li, M. Zhou, X. Cui, Y. Yang, P. Xiao, L. Cao and Y. Zhang, Electrochim. Acta, 2015, 161, 137–143 CrossRef CAS.
- R. N. Reddy and R. G. Reddy, J. Power Sources, 2006, 156, 700–704 CrossRef CAS.
Footnote |
| † Electronic supplementary information (ESI) available. See DOI: 10.1039/c5ra24501j |
| This journal is © The Royal Society of Chemistry 2016 |

