Bruce S. Dien*a,
J. Y. Zhub,
Patricia J. Sliningera,
Cletus P. Kurtzmanc,
Bryan R. Moserd,
Patricia J. O'Bryana,
Roland Gleisnerb and
Michael A. Cottaa
aBioenergy Research Unit, National Center for Agricultural Utilization Research, USDA-ARS, 1815 N. University, Peoria, IL 61604, USA. E-mail: Bruce.Dien@ars.usda.gov; Fax: +1-309-681-6427; Tel: +1-309-681-6270
bUS Forest Service, Forest Products Laboratory, USDA, Madison, WI, USA
cBacterial Foodborne Pathogens and Mycology Research Unit, National Center for Agricultural Utilization Research, USDA-ARS, Peoria, IL, USA
dBio-Oils Research Unit, National Center for Agricultural Utilization Research, USDA-ARS, Peoria, IL, USA
First published on 10th February 2016
Douglas fir is the dominant commercial tree grown in the United States. In this study Douglas fir residue was converted to single cell oils (SCO) using oleaginous yeasts. Monosaccharides were extracted from the woody biomass by pretreating with sulfite and dilute sulfuric acid (SPORL process) and hydrolyzing using commercial cellulases. A new SPORL process that uses pH profiling was compared to the traditional method. Both processes yielded 77 g l−1 concentration of sugars. The SPORL generated sugars were evaluated for conversion to SCO using yeasts Lipomyces tetrasporus and Yarrowia lipolytica in batch cultures containing SPORL sugars diluted to 60% v/v supplemented with nitrogen at an appropriate C:
N ratio of 75
:
1. An extended lag phase was observed for both yeasts, which was eliminated by including SPORL sugars diluted to 40% v/v in the seed cultures for acclimation. The maximum lipid concentrations were 3.18–5.13 g l−1. This corresponded to yields of 0.06–0.17 g lipid per g beginning sugars and productivities of 0.99–1.42 g l−1 d−1. Lipid concentrations for L. tetrasporus were further amplified by using two schemes incorporating multiple batch cultures. In the first, the yeast was grown in 40% v/v SPORL sugars and the entire contents of this fermentation transferred to undiluted SPORL sugars not supplemented with nitrogen. The result was the production of 13.4 g l−1 lipids within 3 days. This corresponds to a yield of 0.174 g g−1 and a productivity of 4.47 g l−1 d−1. The second approach was to thrice transfer the yeast cells in 60% v/v SPORL sugars supplemented with limited nitrogen to promote further lipid formation. The end result was 18.1 g l−1 of lipids with a process yield and productivity of 0.104 g g−1 and 1.29 g l−1 d−1, respectively. This is the first report that the authors are aware of demonstrating the feasibility of converting unconditioned woody biomass to single cell oil.
SCO can be produced from sugars using bacteria, filamentous fungi, micro-algae, or yeasts.5 Most heterotrophic SCO research has focused on yeasts because of their ability to grow to high cell densities in bioreactors, achieve high lipid titers, and suitability for industrial production.4,8 Yeasts are classified as oleaginous if they accumulate at least 20% of their cell mass as lipids.9 The lipids are in the form of TAGs and stored as intracellular globules and have a similar profiling to that of vegetable oils.8 There are over 70 oleaginous yeast species identified or approximately 4% of the known 1600 yeast species.8 Yeasts accumulate lipids in response to excess carbohydrate and in response to a scarcity of nitrogen or other macro-element (i.e. P or S).10–12 Lipid production is commonly induced by adjusting the molecular C:
N ratio. While the biochemistry and regulation of lipid over-production is thought to be conserved, lipid titers can vary significantly with hyper producers accumulating as much as 70% of their cell mass as lipids.13–15 Earlier, we conducted a screen of the Lipomyces clade on synthetic media and identified hyper lipid producing Lipomyces tetrasporus strains, of which one was observed to accumulate 59% w/w of its cell mass as lipids and grow on sugar mixtures similar to those present in biomass hydrolysates.16 This strain also was observed to outperform other commonly used oleaginous yeast strains including Cryptococcus aerius, Lipomyces starkeyi, and Rhodosporidium toruloides on synthetic media and on herbaceous hydrolysates.17
Prior studies have demonstrated the biological feasibility of converting various agricultural residues to lipids using yeasts.18–20 However, the conversion of wood waste has not been explored with two exception.21,67 This is a notable omission in as far as it is estimated that 45 million tons per year of woody biomass are available from the United States forestry and forest products industry.6 Herein plantation Douglas fir harvesting forest residue is explored as a potential feedstock for lipid production. Douglas fir (Pseudotsuga menziesii) is a softwood tree species that grows in the Pacific Northwest. It is the most commercially important domestic lumber tree with approximately 34.6 million managed acres.22 Conversion of Douglas fir biomass to lipids is a multistep process that includes: pretreatment, enzymatic saccharification of pretreated wood to sugars, conversion of sugars to lipid production, and lipid recovery from the yeast.
Lignocelluloses, particularly wood, are highly recalcitrant to enzymatic extraction of sugars.23 Efficient enzymatic conversion to sugars is dependent upon effective pretreatment of the biomass with low production of microbial inhibitors.24,25 There have been several methods researched for extracting sugars from woody biomass, but few have been demonstrated at pilot scale with robust performance. One that has and shows promise for commercialization is the SPORL (Sulfite Pretreatment to Overcome Recalcitrance of Lignocellulose) pretreatment.26 SPORL has proven highly effective for conversion of softwoods into ethanol with Saccharomyces cerevisiae using simultaneous saccharification and fermentations (SSF).26 The SPORL pretreatment consists of treating wood with sulfite and acid catalyst in a pulping digester followed by disc milling to reduce size.25,27 The SPORL process is superior to other pretreatment procedures because it results in high sugar yields, requires low energy inputs, and is easily scalable since it uses pulping equipment.28
Recently, a variation of the SPORL process was invented where the acid catalyst is added midway through the pretreatment after the temperature is lowered. This new “pH-profiling” method gave higher ethanol titers in comparison to the normal method, presumably because the hydrolysate was less inhibitory.26 Hydrolysates from acid pretreatments often require additional conditioning (e.g. over-liming or ammonization), beyond neutralization, prior to fermentation to neutralize the inhibitors.29,30 A notable feature of the pH-profiling SPORL pretreatment is that the unconditioned hydrolysate was fermented to ethanol. This is desirable because conditioning adds further processing costs.
Here the SPORL pretreatment is used as a platform for possible biodiesel production by converting SPORL generated sugars to lipids using oleaginous yeasts. The two yeasts evaluated are Lipomyces tetrasporus and Yarrowia lipolytica. Both strains were observed to be robust for growth and lipid production hydrolysates prepared from switchgrass.17 Lipid titers for L. tetrasporus are dramatically improved by implementing a repeated batch culture strategy first developed using herbaceous hydrolysates.17
After the SPORL treatment, the pretreated materials were recovered in two streams: the unwashed wet solids that contain all water insoluble wood components and approximately 65% of the pretreatment spent liquor and the freely drainable spent liquor. The wet solids remained in the form of wood chips and were size reduced together with the free drainable spent liquor using a laboratory disk mill (Andritz Sprout-Bauer Atmospheric Refiner, Springfield, OH). The materials were processed at a plate gap of 3.2 mm followed by a second pass at a gap of 0.8 mm. No dilution water was used in refining. The refined material was then separated into a wet cake and spent liquor by pressing in a canvas bag.
Cultures were inoculated to 2.0 OD600. Flasks were incubated at 25 °C and mixed at 200 rpm in a refrigerated shaker (Innova 4230, New Brunswick, NJ). Lipid production cultures were sampled every 1–2 days by withdrawing 1 ml of broth to a micro-centrifuge tube. Samples were clarified by centrifugation (10 min, 16000 × g). The liquid was transferred to a HPLC target vial and analyzed immediately for chemical composition. The pellet was washed with 1 ml of dH2O and re-suspended to 1 ml and stored at −20 °C for lipid analysis. All flask culture experiments were performed in triplicate.
Pre-cultures were prepared by transferring a single colony grown on solid YP2D (10 g l−1 yeast extract, 20 g l−1 peptone, and 20 g l−1 glucose supplemented with 15 g l−1 Bacto agar) to a 250 ml Erlenmeyer flask filled with either 50 ml of YP2D or (acclimated with) 40% v/v SPORL-EH supplemented with YP and incubated (200 rpm, 25 °C) for 48 h. Yeast cells were harvested, centrifuged, and re-suspended in diluent (per liter: 8.5 g NaCl, 0.3 g KH2PO4, 0.6 g Na2HPO4, 0.4 g peptone) to an OD600 of 50. Each hydrolysate culture was inoculated with 0.8 ml of cells.
Lipids were measured using the phosphoric vanillin lipid (PVL) assay,16 which was modified from ref. 34. The yeast suspension (50 μl) was mixed with 1 ml of 18 M sulfuric acid in 13 × 100 mm Pyrex™ test tube (Corning # 9826-13) and heated at 100 °C for 10 min in a dry heating bath. The solution was cooled for 5 min in an ambient water bath. Next, 2.5 ml of the vanillin–phosphoric acid was added and reacted for 15 min at 37 °C. The test tube was cooled for 10 min in an ambient water bath. The absorbance of each reaction was read at 530 nm against a reference sample prepared with 50 μl water.
Absorbance measurements at 530 nm were converted to lipid concentration using a calibration curve prepared using refined corn oil. Corn oil (100 mg) was dissolved in 2:
1 chloroform
:
methanol (20 ml) and the stock solution was loaded into the assay mixture at 50–250 μg. A standard curve was run with each set. The vanillin–phosphoric acid solution was prepared the same day by dissolving 0.12 g vanillin in 20 ml dH2O, and adjusting the volume to 100 ml with 85% o-phosphoric acid.
The PVL assay for quantitative measurement of lipids for these yeasts was validated in a prior study.16 Lipids were isolated from L. tetrasporus and run side-by-side with corn oil and the outcome was that both had similar responses. Next, the PVL assay was calibrated on varying concentrations of Y. lipolytica and L. tetrasporus whole cells. The responses were perfectly correlated (e.g. 1.00) with the amounts of added yeast lipids and the slopes were similar for Y. lipolytica and L. tetrasporus compared to corn oil (0.93 and 0.99, respectively). Finally, the PVL assay was run on refined olive and corn oils side-by-side and the assay responses were within 3% agreement (data not shown).
Fatty acid composition was determined on extracted lipids by gas chromatography as previously described.35 Briefly, conversion to FAMEs (via methanolic KOH) was performed and analyzed using a PerkinElmer (Waltham, MA) Clarus 580 GC equipped with an FID and an HP88 capillary column (30 m × 0.25 mm i.d., 0.20 μm film thickness). Carrier gas was H2 with a flow rate of 15.0 ml min−1. The temperature program was: hold at 100 °C for 5 min, ramp from 100 °C to 220 °C at 10 °C min−1 and hold at 220 °C for 15 min. Injection volume was 1.0 μl with a split ratio of 10.0:
1. The concentration of sample in hexane was approximately 20 mg ml−1. The injector and detector temperatures were 240 °C and 280 °C, respectively. FAME peaks were identified by comparison to reference standards (>99%; Nu-Chek Prep, Inc., Elysian, MN).
Sugar, furans, and acetic acid concentrations were measured in culture broths using a SpectraSystem™ liquid chromatography system (Thermo Electron Corporation, CA) equipped with an automatic sampler, column heater, isocratic pump, refractive index detector, and computer based integrator running Chromquest ver. 2.5 (Thermo Electron Corporation, CA). Samples (20 μl) were injected onto a organic acid analysis column (Aminex HPX-87H Column, 300 × 7.8 mm, Bio Rad Laboratories, Inc., Hercules, CA) and eluted with 5 mM sulfuric acid at 0.6 ml min−1 and 65 °C as previously described. The non-glucose sugars co-elute on the organic column. For the one-stage batch cultures, individual sugars were resolved using an analytical sugar column (Aminex HPX-87P Column, 300 × 7.8 mm, Bio Rad Laboratories, Inc., Hercules, CA) with samples eluted with water at 0.6 ml min−1 and 65 °C.
Dilution% v/v | % disappearanceb | Biomass OD600 | Lipids g l−1 | |||
---|---|---|---|---|---|---|
Sugarsa | Acetate | HMF | Furfural | |||
a Composition of undiluted liquor: glucose (8.5 g l−1), xylose (5.6 g l−1), galactose (4.8 g l−1), mannose (18.8 g l−1), and arabinose (2.0 g l−1), acetate (6.7 g l−1), furfural (14.0 mM), HMF (14.3 mM). The sugar liquor was supplemented with basal medium.b % of initial sugars or compounds that have been consumed or disappeared based upon beginning concentrations. | ||||||
10% | 100 ± 0 | 98.7 ± 1.1 | 100 ± 0 | 100 ± 0 | 4.44 ± 0.29 | 0.54 ± 0.08 |
20% | 91.9 ± 1.0 | 97.4 ± 0.3 | 100 ± 0 | 100 ± 0 | 6.71 ± 1.2 | 0.93 ± 0.01 |
40% | 90.8 ± 1.1 | 97.4 ± 0.3 | 100 ± 0 | 100 ± 0 | 15.3 ± 5.3 | 2.7 ± 0.4 |
60% | 90.6 ± 0.4 | 97.2 ± 0.1 | 100 ± 0 | 100 ± 0 | 18.3 ± 1.0 | 3.9 ± 0.6 |
80% | 1.9 ± 1.8 | 4.4 ± 1.9 | 57.2 ± 2.2 | 55.7 ± 0.0 | 0.0 ± 0.0 | 0.0 ± 0.0 |
100% | 0.0 ± 0.0 | 0.0 ± 0.0 | 0.0 ± 0.0 | 22.2 ± 0.0 | 0.0 ± 0.0 | 0.0 ± 0.0 |
Component | (Concentration in g l−1) | |
---|---|---|
Normal | pH profile | |
Glucose | 50.1 ± 4.1 | 50.9 ± 4.1 |
Galactose | 5.5 ± 2.2 | 5.1 ± 1.9 |
Mannose | 14.9 ± 2.0 | 15.2 ± 0.3 |
Xylose | 6.7 ± 1.8 | 6.2 ± 2.0 |
Acetate | 6.1 ± 0.5 | 5.0 ± 0.1 |
HMF | 1.0 ± 0.1 | 1.1 ± 0.1 |
Furfural | 0.56 ± 0.06 | 0.62 ± 0.0 |
Total sugars | 77.2 | 77.4 |
L. tetrasporus and Y. lipolytica were evaluated on each SPORL-EH supplemented with medium A in triplicate batch cultures (Table 3). Y. lipolytica was included because it is a yeast species used for commercial fermentations and the specific strain chosen is exceptionally robust for growth on hydrolysates.17 The SPORL-EHs were diluted to 60% v/v for lipid production as recommended by the prior minimum inhibitory concentration (MIC) experiment. Y. lipolytica had a higher yield than L. tetrasporus but growth was 2–3× slower. For both yeasts, the lipid cultures were slower for the normal than for the pH profiling SPORL-EH (unacclimated L. tetrasporus and Y. lipolytica; Table 3). Lipid yields for the normal and pH profiling were similar (Table 3).
Yeast | Hydrolysate | Days for max. lipids | Maximum lipidsa (g l−1) | Cell biomass (g l−1) | % sugars consumedb | Lipid content (% w/w) | % metabolic yield | Process lipid yield (g g−1) |
---|---|---|---|---|---|---|---|---|
a Differences are significant (P < 0.05) for values appearing with different superscripts.b % of total neutral sugars present in the culture consumed at the time of maximum lipid production.c Control culture contained synthetic medium with sugar mixture similar to that of the diluted hydrolysate. | ||||||||
Lipomyces tetrasporus | ||||||||
Unacclimated | Normal | 3–4 | 3.31 ± 0.23a | 14.08 ± 3.02 | 72.7 ± 9.0 | 23.9 ± 3.3 | 24.4 ± 1.9 | 0.062 ± 0.00 |
pH profile | 3 | 3.31 ± 0.34a | 15.10 ± 2.86 | 70.7 ± 9.6 | 22.4 ± 4.2 | 37.2 ± 7.2 | 0.060 ± 0.00 | |
Acclimated | Normal | 2–3 | 3.18 ± 0.12a | 11.53 ± 0.68 | 54.9 ± 9.5 | 27.7 ± 2.2 | 33.9 ± 5.6 | 0.067 ± 0.01 |
pH profile | 2–3 | 3.98 ± 0.08a | 12.80 ± 1.13 | 64.4 ± 11.7 | 31.2 ± 2.4 | 31.3 ± 5.1 | 0.080 ± 0.03 | |
Controlc | 2 | 7.31 ± 1.04b | 17.41 ± 1.08 | 100.0 ± 0.0 | 41.8 ± 3.4 | 47.7 ± 6.8 | 0.17 ± 0.02 | |
![]() |
||||||||
Yarrowia lipolytica | ||||||||
Unacclimated | Normal | 9 | 4.13 ± 0.46A | 10.08 ± 0.09 | 81.2 ± 0.7 | 41.0 ± 4.3 | 33.2 ± 4.0 | 0.091 ± 0.01 |
pH profile | 6 | 3.57 ± 0.17A | 12.48 ± 0.15 | 85.4 ± 1.5 | 28.6 ± 1.7 | 27.4 ± 1.1 | 0.079 ± 0.00 | |
Acclimated | Normal | 5 | 4.94 ± 0.43B | 12.69 ± 1.42 | 71.9 ± 5.9 | 39.4 ± 6.6 | 44.3 ± 2.7 | 0.11 ± 0.01 |
pH profile | 5 | 5.13 ± 0.31B | 13.85 ± 0.24 | 81.5 ± 7.4 | 37.0 ± 1.6 | 37.3 ± 4.1 | 0.10 ± 0.01 | |
Controlc | 4 | 6.43 ± 0.20C | 15.57 ± 0.59 | 95.5 ± 0.6 | 41.3 ± 0.2 | 44.1 ± 1.1 | 0.15 ± 0.06 |
The slow growth for both yeasts observed for normal SPORL-EH resulted from longer lag phases. Extended lag phases are often associated with microbiological inhibitory chemicals that are generated during pretreatment. Typical inhibitors include furfural, HMF, and acetic acid. However, the two hydrolysates had similar amounts of these chemicals (Table 2), so, the poor (slow) performances of the normal versus pH-profiling hydrolysate cultures are probably associated with differences in the concentrations or types of phenolic (e.g. lignin derived) inhibitors. A prior study comparing the two SPORL methods for conversion of the same Douglas fir forest residue to ethanol also concluded the pH-profiling was superior.26
However, in this prior study, lower furan concentrations were detected in the pH-profiling than normal SPORL hydrolysate. Our results suggest the difference in inhibitory responses might be related to other compounds as well.
It was undesirable to dilute the SPORL-EHs further because the sugar concentrations would become too dilute. We hypothesized that if the yeast cells were exposed to a limited amount of the hydrolysate during seed propagation, natural genetic diversity within the population and adjustment of cell metabolism would enhance robustness to inhibitors. Accordingly, the seed culture for L. tetrasporus was grown in media containing 0–40% v/v normal SPORL-EH supplemented with glucose (20 g l−1) and YP. The seed cultures were next inoculated into the 60% v/v normal SPORL-EH supplemented with medium A at an OD600 of 2.0. Synthetic medium containing the same sugar concentration as the 60% v/v SPORL-EH was included as a control. As predicted, the only yeast culture to grow on 60% v/v diluted SPORL-EH was the inocula grown on 40% v/v SPORL-EH (Fig. 1). This yeast culture used nearly all of the sugars (Table S1‡). Notable, results were inconsistent for the yeast seed grown on 20% v/v diluted SPORL-EH. One culture used all the sugars and the other was partially stalled and only consumed 1/2 of the non-glucose sugars. It was concluded that acclimating the L. tetrasporus population by growing the seed in the presence of 40% v/v SPORL-EH is favorable for lipid production on 60% v/v SPORL-EH.
![]() | ||
Fig. 1 Growth of L. tetrasporus on 60% v/v pH profiling SPORL-EH following acclimation on various concentrations of pH-profile SPORL-EH in the seed culture. |
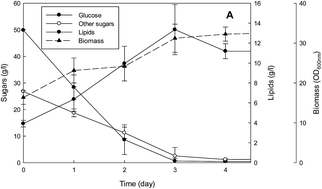
Subsequently acclimated L. tetrasporus and Y. lipolytica seed cultures were evaluated for lipid production on 60% v/v normal and pH profiling SPORL-EH supplemented with medium A. Synthetic medium cultures were also included as controls. Sugar consumption, cell growth, and lipid production were monitored for all three L. tetrasporus (Fig. 2A–C) and Y. lipolytica cultures (Fig. 3A–C). This strategy was successful in significantly increasing the rates of sugar consumption. The durations of the cultures were reduced by 1–4 days (Table 3) and for the preferred pH-profiling SPORL-EH there was no observable lag phase for either yeast (Fig. 2B and 3B). For Y. lipolytica cultures, acclimation led to significantly higher (P < 0.05) lipid production. For both yeast species, the synthetic medium cultures produced significantly (P < 0.05) more lipids than any of the hydrolysate cultures.
![]() | ||
Fig. 2 L. tetrasporus in batch culture growing on (A) normal SPORL-EH, (B) pH profile SPORL, and (C) synthetic mixed sugars medium. Means and standard deviations are plotted for triplicate runs. |
![]() | ||
Fig. 3 Y. lipolytica in batch culture growing on (A) normal SPORL-EH, (B) pH profile SPORL, and (C) synthetic mixed sugars medium. Means and standard deviations are plotted for triplicate runs. |
Acclimation appeared to largely remove the differences observed earlier between the pH profiling and normal SPORL-EH grown cultures. In the case of L. tetrasporus, the pH profiling SPORL-EH culture consumed sugars slightly faster and produced 0.61 g l−1 more lipids than the normal SPORL-EH culture (Table 3 and Fig. 2A and B). Both SPORL-EH cultures had lower lipid yields and grew 1 day later than the synthetic control culture (Fig. 2C). For Y. lipolytica, lipid yields and took an added day to complete compared to the synthetic medium control (Fig. 3C). Over the entire course of the cultures, both yeast nearly exhausted all of the added sugars in the hydrolysates and all of the sugars in the synthetic medium (Fig. 2 and 3). It is of interest that the hydrolysate cultures continued to consume sugars even after the cultures achieved their maximum lipid concentrations. It can be supposed that sugar not directed to biosynthesis was used for cell maintenance.
The % metabolic yields were 24.4–47.7% for L. tetrasporus and 27.4–44.1% for Y. lipolytica (Table 3); the maximum metabolic lipid yield is 0.336 g lipid per g consumed glucose.39 The % theoretical metabolic yields are calculated using the maximum lipid concentrations and amounts of consumed sugars. The process yields were 0.060–0.17 g g−1 for L. tetasporus and 0.079–0.15 g g−1 for Y. lipolytica. The process yields are lower than the metabolic yields because they are not adjusted for unconsumed sugars. For both yeasts, results on synthetic medium were far superior to those observed for the hydrolysates. The lower yields can be attributed to the presence of inhibitors.
Consumption rates of individual sugars were followed for each single-stage batch culture and are displayed as supplemental results (Fig. S1–S2‡). Y. lipolytica was observed to preferentially consume glucose followed by mannose and galactose (S1A–C‡). L. tetrasporus shows a similar pattern of sugar consumption with xylose being consumed last (S2A–C‡). Both yeast consumed sugars faster in the synthetic sugar medium than hydrolysates. L. tetrasporus consumed all the sugars present within 2 d and Y. lipolytica consumed all the sugars except for 0.9 g l−1 of xylose within 4 d. We have found that in an earlier study that Y. lipolytica YB-437 was able to slowly consume xylose.17
When comparing the two yeast strains grown on pH profiling SPORL-EH, Y. lipolytica produced more lipids (5.03 g l−1) than did L. tetrasporus (3.98 g l−1). However, Y. lipolytica also took twice as long to consume the sugars. Interestingly, L. tetrasporus had a higher lipid yield (7.31 g l−1) in the synthetic medium culture compared to that of the Y. lipolytica (6.43 g l−1). Despite the superior yield obtained with Y. lipolytica on SPORL-EHs, L. tetrasporus was chosen for further experiments because it had superior productivity compared to L. tetrasporus and was observed to have exceptional lipid production yields and robustness in our prior studies.16,17,40 Furthermore, lipid yields are very sensitive to the C:
N ratio (ibid) and it was expected (and later shown) that the lower than desired yield L. tetrasporus might be remedied by reducing the amount of added nitrogen.
Even though we chose to continue with L. tetrasporus, Y. lipolytica YB-437 might be of interest for applications other than production of lipids because of its robustness for growth in hydrolysate (this study and ref. 17). Y. lipolytica is used for production of citric and isocitric acids, enzymes (e.g. lipases), polyalcohols, single-cell protein, flavor compounds and bioremediation.41,42 It is also amendable to genetic engineering and an engineered strain has recently been commercialized for production of polyunsaturated fatty acids.43 Y. lipolytica is sometimes mistakenly considered non-oleaginous – despite its species name – because of the ability of some isolates to produce very high titers of citric acid under nitrogen limited growth. However, lipid contents of 23–43% have been reported for growth on various sugars and glycerol (this study and ref. 44). Furthermore, lipid titers of 55 g l−1 and 39 g l−1 were observed, respectively, for highly engineered Y. lipolytica strains cultured on glucose.45,46 The former also produced approximately 15 g l−1 on dilute-acid corn stover.46 The capacity of the yeast to produce organic acids versus lipids likely depends upon the genetic background (e.g. isolate). It has also been recently observed that Y. lipolytica produces both citrate and lipids within a range of low N:
C ratios (0.085–0.021) and solely lipids below this range.47 The physiology of fatty acid production in Y. lipolytica is further complicated because it does not produce a cytosolic malic enzyme and, therefore, relies on the pentose phosphate pathway48 and possibly isocitrate dehydrogenase to generate sufficient NADPH for fatty acid synthesis.49
In the second strategy, we allowed for continued cell growth and lipid formation by transferring the yeast in 60% v/v SPORL-EH supplemented with nutrients sufficient to allow for some cell growth but low enough to favor lipid formation. The yeast cells were grown in 60% v/v SPORL-EH, harvested, and transferred to fresh 60% v/v SPORL-EH, and this process repeated once more. In total the yeast were cycled 3× and thus exposed to 3× more sugars than in the single stage fermentation.
The appropriate C:
N ratio to use here is unclear. Too much N and the yeast would catabolize their lipids, but too little nutrients and the yeast would become metabolically inactive, as was observed previously. Therefore, two C
:
N ratios were evaluated for this experiment. The two C
:
N ratios investigated were 60% v/v pH-profiling SPORL enzymatic hydrolysate supplemented with 1× medium A and 0.5× medium A, which corresponded to C
:
N ratios of 75
:
1 and 150
:
1, respectively. Recommended molar C
:
N ratios are 40
:
1 to 100
:
1 and higher.13,14,50 Given the wide range of carbon sources (i.e. glycerol, waste lipids, whey etc.) and species, a broad range of recommended C
:
N ratios is not unexpected. Two earlier studies that used L. tetrasporus for normal batch growth with conversion of hydrolysates prepared from dilute-acid pretreated switchgrass and AFEX pretreated corn stover reported an optimal C
:
N ratio of 62
:
1 and 75
:
1–173
:
1, respectively.17,40
Yeast cultures were transferred between batch cultures after the majority of sugars had been consumed. The culture times were 5 days each for the 1 and 0.5× medium A (Table 4). As predicted, lipids titers increased during each stage. In particular, the amount of lipids at least doubled during the course of the 2nd stage. The step cultures containing less nitrogen produced more lipids (18.1 g l−1) than the other (12.2 g l−1). Lipid contents were 48.6% w/w for the 0.5× M and 35.8% for full strength basal medium. The lipid production yield is based upon the total amount of sugars added to the culture and is not adjusted for residual sugars. The lipid yields varied from 0.063–0.106 g g−1 and were the highest once again for the step cultures containing 0.5× M. A yield of 0.106 is 32% of theoretical (0.33 g lipid per g sugar), demonstrating that there is much room for progress.
Culture | Transfera | Non-glucose sugar% consumed | Biomass (g l−1) | Lipid titer (g l−1) | Lipid content (% w/w) | Lipid yield (g g−1) |
---|---|---|---|---|---|---|
a Maximum lipid titers were achieved on day 5, except for transfer 3, which was reached on day 4. | ||||||
0.5× medium (150![]() ![]() ![]() ![]() |
1 | 71.0 ± 24.1 | 17.6 ± 6.3 | 5.9 ± 0.5 | 33.7 ± 9.01 | 0.10 ± 0.00 |
2 | 89.8 ± 4.9 | 32.5 ± 4.3 | 12.1 ± 1.5 | 37.3 ± 0.6 | 0.11 ± 0.01 | |
3 | 73.6 ± 14.0 | 36.7 ± 2.1 | 18.01 ± 2.9 | 48.6 ± 1.2 | 0.10 ± 0.02 | |
1.0× medium (75![]() ![]() ![]() ![]() |
1 | 65.3 ± 2.5 | 15.1 ± 0.2 | 4.2 ± 1.1 | 27.7 ± 0.91 | 0.073 ± 0.02 |
2 | 71.3 ± 21.6 | 25.8 ± 5.9 | 7.2 ± 1.6 | 28.5 ± 1.9 | 0.063 ± 0.01 | |
3 | 57.7 ± 18.3 | 34.1 ± 5.7 | 12.2 ± 0.97 | 35.8 ± 1.0 | 0.071 ± 0.01 |
It is also notable that for the first batch stage, halving the nitrogen resulted in the final lipid titer increasing from 4.2 g l−1 to 5.9 g l−1 (Table 4). Therefore a high C:
N ratio (150
:
1) appears to be favorable for lipid production when using this yeast. Addition of cellulases contributed a minor amount of usage nitrogen, which was accounted for in calculating the C
:
N ratios. Therefore, a C
:
N ratio of 75
:
1 for the acclimated L. tetrasporus cultures (Table 3) might have contributed to their lower than desired lipid yields.
Similar trends were observed for lipid cultures using the 75:
1 and 150
:
1 C
:
N ratios as graphed for the latter (Fig. 5). Glucose was used first followed by mannose/xylose. Glucose was exhausted and 57.7–89.8% of the mannose/xylose was consumed. Optical densities increased most during the first and second cultures and relatively little for the final culture. Lipid production was observed to increase with time and batch. In summary, sequential batch allowed for an approximately 300% increase in lipid titer.
The final lipid samples were also characterized for fatty acid composition (Table S2‡). Compositions were similar for both C:
N ratios and 84.2–87.5% consisted for three fatty acids. These were by decreasing rank of abundance: oleic (18
:
1), stearic (18
:
0), and palmitic (16
:
0). Lipid yields from oleaginous yeasts are typically enriched for oleic, palmitic, stearic, and linoleic (18
:
2) acids and the fatty acid composition observed here falls within the published range of values.15,51 The high oleic content observed here, and common for yeasts, is considered favorable for biodiesel applications.52 Furthermore, based upon a statistical model, it has been concluded that yeast oils would be appropriate for use as biodiesel provided it was blended with diesel in a similar manner to vegetable oil derived biodiesel.51
Results from this study are compared to other studies that used biomass hydrolysates in Table 5. Recently, one study reported on the conversion of steam exploded woody biomass to SCO using the yeast Rhodococcus opacus.21 The hydrolysate was conditioned using over liming and adsorption and the maximum lipid concentration observed was 0.31 g l−1. In this study, the hydrolysate was not treated other than neutralizing and the maximum observed lipid concentration was 58 fold higher. Conditioned Douglas fir hydrolysate was used to produce lipids using Mortierella isabellina in a very recent study.67 Using lime-conditioned hydrolysate, this study achieved a lipid titer of 8.4 g l−1 with a yield of 0.18 g g−1 following a 168 h fermentation. The only other reference to woody biomass for SCO production is brief mention in a very old review.53 This is not unexpected because wood is more recalcitrant than herbaceous plants and therefore requires more severe pretreatments. Pretreatment severity is often correlated with inhibitor concentration and high inhibitor concentrations are undesirable.
Yeast strain | Substrate | Conditioning | Lipid content (%w/w) | Titer & yield | References |
---|---|---|---|---|---|
a Results reported for best performing strain.b Yields are based upon beginning sugar concentrations as reported. | |||||
Cryptococcus curvatusa | Dilute acid wheat straw | None | 33.5% | 5.8 g l−1; 0.207 g g−1 | 57 |
Cryptococcus sp. | Dilute-acid corn cob | None | 60.2% | 7.6 g l−1; 0.13 g g−1 | 58 |
Candida lipolytica | Steam exploded corn cob | Adapted strain | 19.4% | 1.6 g l−1; not reported | 59 |
Lipomyces kononenkoae | Dilute-acid switchgrass (2-stage) | None | 59% | 28.1 g l−1; 0.146 g g−1 | 17 |
L. tetrasporus | SPORL Douglas fir (multi-stage) | None | 48.6% | 18.0 g l−1; 0.104 g g−1b | This study |
SPORL Douglas fir (2-stage) | None | 31.2% | 13.4 g l−1; 0.174 g g−1b | This study | |
AFEX corn stover | None | 36% | 10.7 g l−1; 0.1 g g−1 | 40 | |
Dilute-acid switchgrass (2-stage) | None | 53% | 29.0 g l−1; 0.142 g g−1 | 17 | |
Microsphaeropsis sp. | Steam exploded wheat straw | None | Approx. 34% | 2.6 g l−1; 0.14 g g−1 | 60 |
Mortierella isabellina | Dilute-acid rice hulls | None | 64.3% | 3.6 g l−1; 0.138 g g−1 | 18 |
Mortierella isabellina | Dilute-acid corn stover | None | 34% | 4.78 g l−1; 0.154 g g−1 | 61 |
Mortierella isabellina | Alkaline corn stover | None | 23% | 2.78 g l−1; 0.088 g g−1 | 61 |
Trichosporon cutaneum | Dilute-acid corncob | Activated carbon | 36% | 8.0 g l−1; 0.174 g g−1 | 62 |
Trichosporon dermatis | Orgosolv corn cobs | None | 40.1% | 9.8 g l−1; 0.163 g g−1 | 63 |
Trichosporon fermentans | Dilute-acid sugar cane bagasse | Activated carbon | 39.9% | 15.8 g l−1; 0.128 g g−1 | 64 |
Trichosporon fermentans | Dilute-acid rice straw | Ca(OH)2 | 40.1% | 11.5 g l−1; 0.111 g g−1 | 65 |
Rhodococcus opacus | Sweetgum autohydrolysate | Ca(OH)2 & XAD-4 | 28.6% | 0.25 g l−1; 0.291 g g−1 | 21 |
R. opacus | Pine autohydrolysate | Ca(OH)2 & XAD-4 | 28.3% | 0.31 g l−1; 0.157 g g−1 | 21 |
Rhodosporidium toruloides | Dilute acid switchgrass | None | 61% | 26.2 g l−1; 0.132 g g−1 | 17 |
Yarrowia lipolytica | Dilute-acid sugarcane bagasse | Ca(OH)2 | 58.5% | 6.68 g l−1; NA | 66 |
SPORL Douglas fir | None | 35.9% | 5.02 g l−1; 0.10 g g−1 | This study |
Often these toxins are removed using expensive conditioning methods that add considerable expense and generate waste.54 It is a highly desirable characteristic of the SPORL pretreatment process that it can be fermented to ethanol without further conditioning other than neutralization. This work extends these pivotal ethanol findings to include production of lipids for either food or biodiesel applications.
However, even when compared to lipid yields reported using herbaceous biomass, the yields reported herein are noteworthy. Perhaps the best overall result for the SPORL-EH was the two-stage scheme. The lipid concentration and yield are among the highest listed on Table 5, with the exception results reported earlier from our laboratory for dilute-acid switchgrass hydrolysate. The productivity (0.186 g l−1 h−1) is also respectable compared to other studies. This result concurs with prior studies that promote the advantages of multistage processes. Allowing for lipid amplification or fattening, in a separate culture than growth, is an effective method for boosting overall lipid production and yield.17,53 In this regard, it should be noted that a future direction of this research might include further optimization of the 2-stage culture system. The other trend noted was that among the highest lipid yields listed were achieved using L. tetrasporus NRRL-Y-11562. This yeast strain is advantageous because of its potential for high lipid yields, broad sugar utilization, and robustness for growth on hydrolysates.
An advantageous trait of oleaginous yeasts is their collective utility for growth on wide range of substrates including oils, alcohols, and carbohydrates. So, while this study is focused on lignocelluloses, it is possible that the yeasts characterized here could be evaluated on further C-sources. Possibilities include glycerol, olive and palm waste streams, food enriched starch streams, whey, industrial fats, and volatile fatty acids.51,55 Crude glycerol is of interest because it is generated as a side-product of biodiesel production. It has approximately a 10% lower theoretical lipid yield (0.30 g g−1) but typical yields are closer to 0.2 g g−1.56 While conversion of waste streams allow for valorization of low-cost substrates combined with opportunities for waste-water treatment.
Footnotes |
† Disclaimer: The mention of trade names or commercial products in this article is solely for the purpose of providing specific information and does not imply recommendation or endorsement by the U.S. Department of Agriculture. USDA is an equal opportunity provider and employer. |
‡ Electronic supplementary information (ESI) available. See DOI: 10.1039/c5ra24430g |
This journal is © The Royal Society of Chemistry 2016 |