Photosynthesis of cyanobacteria in a miniaturized optofluidic waveguide platform

Jin Ho Jung , Kang Soo Lee, Sunghyuk Im, Ghulam Destgeer, Byung Hang Ha, Jinsoo Park and Hyung Jin Sung*
Department of Mechanical Engineering, KAIST, 291 Daehak-ro, Yuseong-gu, Daejeon 34141, Republic of Korea. E-mail: hjsung@kaist.ac.kr

Received 18th November 2015 , Accepted 18th January 2016

First published on 20th January 2016


Abstract

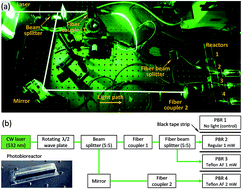
We investigated the effect of increasing the optical penetration length, inside polydimethylsiloxane (PDMS)-based photobioreactors (PBRs), upon the photosynthetic cell growth of cyanobacteria. A thin layer of Teflon amorphous fluoropolymer (Teflon AF) was applied inside the PDMS-based PBRs to prevent light loss at the solid–liquid interface. The Teflon AF layer, with a refractive index (nTeflon = 1.31) lower than PDMS (nPDMS = 1.442) and higher than the culture medium (nmedium = 1.332), constructed the light waveguide in the PBRs via the total internal reflection. Such a combination of refractive indices led to the prevention of light loss at the interface. The cell growth rate and the optical cell density were measured periodically for 5 days under different light power and Teflon AF-coating conditions. The local or global auto-fluorescence signal and the optical density at 450 nm wavelength (OD450) were measured in parallel by a fluorescence microscope and a micro plate reader, respectively. The optofluidic waveguide-based PBR improved the photosynthetic cell growth up to ∼9% compared to a regular PBR.


Introduction

Since most of the recent technological advances heavily depend on petroleum products to meet the ever increasing demands for energy, global supplies are quickly running out, and we are in dire need of alternative energy resources. Moreover, over-use of fossil fuels has resulted in detrimental environmental consequences such as air/water pollution and global warming.1–4 In an effort to improve the environment, alleviate global warming, and preserve natural habitats, many researchers have been studying alternative energy resources that are affordable, sustainable, and environmentally-friendly. In a quest for such alternatives, the scientific community has shown an increasing interest in biofuel technology. Readily available biomass feedstock, such as corn, canola, soybean, or palm oil that can be cultivated in bulk quantities, has enabled a rapid growth in biofuel technology. However, biomass-based technology has a major drawback in that these crops require large areas of land to grow and long cultivation time, yet their oil yields are low.1

To overcome these limitations, cyanobacteria can be used as an alternative feedstock.5 Certain types of cyanobacteria have high yields, require little land usage, and can be cultivated with a regular supply of sunlight and CO2 without any additional energy input. Moreover, CO2 emitted from the burning of fossil fuels can be recycled for the photosynthesis of cyanobacteria. The extraction of CO2, after removal of NOX and SOX from exhaust, will contribute to global carbon capture and storage (CCS) project.6–9 Furthermore, biofuels produced by cyanobacteria can be used for microbial fuel cells that utilize the by-products of photosynthetic process (H2O, O2, and free electrons) to generate electrical potential.10

Photobioreactors (PBRs), classified as open or closed systems based on the chamber structure, are used to cultivate the microalgae under light. Open PBR systems have low operational costs, but the efficiency of fuel production is low because of environmental factors (temperature and light distribution) that are hard to control precisely. On the contrary, closed systems allow easier control of environmental conditions and reduce the microalgae contamination. Thus, tubular closed PBRs have been mostly used for the efficient cultivation.1,11–13 One of the major obstacles that limits the cell cultivation in both closed and open systems is the ineffective distribution of light energy to the bacteria. The cyanobacteria cells near the light source experience a higher light intensity than the required saturation limit for cellular growth; while the cells farther from the light source are underexposed due to the shadow effect and scattering, which leads to a lower return on investment (ROI).14,15 In order to address this disproportionate light propagation through the chamber, previous studies used surface-plasmon-based light backscattering with silver nanoparticles,16 a slab waveguide system and its stackable platform,17,18 evanescent wave,19–21 wavelength-selective plasmonics,22 and medium mixing based on the flash light effect14,15 to deliver the light efficiently to cells within the PBR. However, most of the reported techniques required additional system preparation protocols and complex operations. Cyanobacterial cultures, that utilize the evanescent field, suffered from a low cell growth in regions with low light levels. A well-designed PBR with efficiently distributed light usually needed additional devices or design features, thereby increasing overall operating costs. A light leakage (loss) at the solid–liquid interface decreases the light penetration length along the PBR in conventional small PBRs that results in an inhomogeneous and insufficient cell growth. The light penetration length inside the PBR along the light propagation direction can be maximized by using an optical waveguide system that reduces the light leakage.23–25 Optofluidic waveguides, composed of a liquid media encompassed by a solid media,26 are classified into two categories viz. total internal reflection-based and interference-based waveguides.27,28 These systems have their own merits and demerits which are not the subject of the present work.

The present paper describes an efficient cyanobacterial cultivation protocol that utilizes a thin Teflon amorphous fluoropolymer (Teflon AF) layer coated on the inner walls of polydimethylsiloxane (PDMS) PBR to build a total internal reflection-based optofluidic waveguide. The core liquid medium in the waveguide has a higher refractive index (nmedium = 1.332) than the Teflon AF (nTeflon AF = 1.31) that ensures a total internal reflection and consequent extended penetration length. The absorbance and the auto-fluorescence of the cyanobacterial chlorophyll during the cell growth were measured under monochromatic light (fluorescence microscopy). The cell coverage of the PBR, cell density, and cell growth rate were estimated to characterise the performance of the device. The optical density (OD450) of the microalgae was also measured in parallel using a micro plate reader to correlate the results.

Materials and methods

Experimental setup

Light guiding through the Teflon AF-coated PBR was observed using a charged coupled device (CCD) camera (DP72, Olympus). A linearly polarized continuous wave neodymium-doped yttrium aluminum garnet (CW Nd:YAG) laser (λ = 532 nm, Quantum laser) was used as a light source. An optical fiber with core/cladding of 50/125 μm and a numerical aperture (NA) of 0.2 was used to deliver the light into the PBR. The experimental setup (Fig. 1) was designed to allow simultaneous cultivation of cyanobacteria in 4 different PBRs. The first and second PBRs were regular devices without the Teflon AF coating, whereas the third and fourth PBRs had a thin layer of Teflon AF coated on the channel inner walls. A single light beam was divided into two beams by using a half-wave plate (Thorlabs Inc.) and beam splitters (Thorlabs Inc.). The wave plate controls the polarization of the incident beam while the beam splitter divides it into two beams based on the polarization ratio. The intensity of each light beam could be adjusted independently through the wave plate. One of the beams is further split into two equal intensity beams by using a fiber beam splitter. The powers of the beams radiated from the optical fiber to the PBRs, as measured by a photometer (Edmund Optics, Inc.) placed right before a beam encountered the device, were 0 and 1 mW for the regular PBRs, and 1 and 2 mW for the Teflon AF-coated PBRs, respectively. The cells were cultivated in a dark room (no external light) at 25 °C. Therefore, the laser beam was the only light source. Black tape strips were attached to the outer walls of the PBRs to prevent any light cross-contamination between the PBRs.
image file: c5ra24344k-f1.tif
Fig. 1 (a) Experimental setup for the cell culture. (b) Schematic of the experimental setup. Inset shows the fabricated PDMS photobioreactor (PBR).

Device fabrication and operation

The step by step fabrication process of the PDMS-based PBR is shown in Fig. 2. The polymer mixture was prepared by adding the PDMS base into the curing agent (Sylgard 184, Dow Corning) at a weight ratio of 10[thin space (1/6-em)]:[thin space (1/6-em)]1. The mixture was poured into a Petri dish, degassed, and cured at 65 °C for 2 h. A thick slab was cut from the cured PDMS for the next step in PBR fabrication. A separate mixture of PDMS was prepared and then poured onto a Borosilicate glass rod (dimensions 5 × 5 × 60 mm3, VitroCom) placed on top of the cured PDMS slab (prepared in the previous step). After degassing, the newly poured PDMS was cured in a similar manner at 65 °C for 2 h. One end of the cross-linked PDMS was sliced to remove the glass rod and form a cavity for cell culture. Glass slides (Marienfeld) were attached to the top and bottom sides of the PDMS PBR by O2 plasma bonding to prevent thermal cracks that may develop during the high-temperature Teflon AF-coating process later on. To promote adhesion of the Teflon AF layer with the PDMS inner walls, 2 wt% 1H,1H,2H,2H-perfluorodecyltriethoxysilane (Sigma Aldrich) in FC-40 (3M) was gently injected into the cavity.24,25 After removing the solution from the cavity, by manual application of a negative pressure using a syringe, the PDMS was heated for 10 min at 110 °C. Then, the Teflon AF solution (601-S2, DuPont Corp) was injected into the cavity. Once the solution filled the cavity, it was removed by applying a negative pressure via a syringe pump (Nemesys Centoni GmbH) at a volumetric flow rate of −62.5 μL s−1. The thickness of the Teflon AF layer increases with the mean velocity at which the solution is removed, and can be estimated by Bretherton's law as:29
 
image file: c5ra24344k-t1.tif(1)
where h is the thickness of the residual Teflon AF solution, r is the width of the glass rod, Ca is the capillary number, η is the liquid viscosity, λ is the surface tension of the liquid, and V is the mean velocity of the retrieving solution. The PDMS was heated at 155 °C for the solvent evaporation and 175 °C for the glass transition for 20 min each. The thickness of the Teflon AF layer was estimated to be ≥3 μm which is sufficient to prevent the light coupling through the Teflon AF layer into the PDMS wall. After punching the inlet and outlet ports, the sliced (open) end of the PDMS was enclosed by attaching a cover glass with a UV-curable epoxy (NOA 81, Norland Product Inc.). During the experiments, the optical density (OD450) and fluorescence were measured independently to estimate the cellular density and the growth rate, respectively. To measure the local fluorescence intensity at a particular location, a glass slide with a lattice imprinted on its surface (Matsunami Glass) was used. In such experiments, the bottom of the PBR (PDMS slab) was replaced by the latticed glass slide to track the location of cyanobacteria within the PBR.

image file: c5ra24344k-f2.tif
Fig. 2 Fabrication process for the Teflon AF-coating. A slide glass was used rather than the PDMS base for measurements of fluorescence.

Inoculum

Synechococcus elongatus PCC 7942 (ATCC, USA) in BG-11 growth medium (Sigma Aldrich, Korea) was used for all experiments. Before cultivation in the PBR, cells were pre-cultured at room temperature (25 °C) in glass bottles under four desk lamps with total irradiance of 30 μE m−2 s−1, determined by a photo/radiometer (HD9021, Delta Ohm). Before measurements of cell cultivation within the PBR, the initial cell densities in 4 different PBRs were matched by diluting the samples. The PBRs were sterilized by using 70% isopropyl alcohol (IPA) before the cell inoculation.

Measurement of cell density

The cyanobacterial growth was estimated by measuring the auto-fluorescence.30,31 The field-of-view of a single image under the microscope was 4 × 4 mm2, and the complete picture of the channel was recorded by moving the PBR in a one specific direction on the fluorescent microscope stage (IX 71, Olympus). A slide glass with a lattice, attached at the bottom of the FBR, was used to record the position of an individual CCD image within the PBR during the fluorescence measurements. The fluorescence intensity was calculated at each lattice unit to quantify the cell growth. In parallel, the OD450 of the cell culture was measured every 24 h to quantify the growth.32–34 The cyanobacteria in the PBRs were put into 96-well plates (Generic Bio-one), and the OD450 was measured by a micro plate reader (Paristar, Berthold Tech.). The initial OD450 was maintained at about 0.3 in all experiments by dilution. The pre-cultured cyanobacteria were inoculated into the PBRs through the punched holes on the top of the PBRs.

Results and discussion

Light guiding in the Teflon AF coated PBR

Fig. 3 shows the schematics and the CCD images of the light propagation along the regular and the Teflon AF-coated PDMS PBRs, respectively. Deionized (DI) water was used as a working fluid in these experiments. For the regular PBR device, the light freely spreads out through the PDMS wall, which indicates that undesirable optical loss seems inevitable (see Fig. 3(a) and (b)).
image file: c5ra24344k-f3.tif
Fig. 3 (a) Schematic description and (b) CCD image of the light propagation in the regular PDMS PBR: light travels freely along the beam propagation direction, leading to the undesirable loss at the solid–liquid interface. (c) Schematic description and (d) CCD image of the light propagation in the Teflon AF-coated system: light confines in the PBR chamber due to the waveguide.

For a Teflon AF coated PBR, the light beam is confined within the liquid medium, minimizing the light loss (see Fig. 3(c) and (d)). The light is totally reflected at the liquid/solid interface and does not propagate through the surrounding solid layer, when the refractive index of the liquid is greater than that of the surrounding solid wall and the incident angle of the light beam is larger than the critical angle (θc). The critical angle is expressed by35

 
θc = sin−1[thin space (1/6-em)]n1/n2, (2)
where n1 and n2 are the refractive indices of the surrounding solid layer (Teflon AF, nTeflon AF = 1.31) and the liquid (cell culture medium, nmedium = 1.332), respectively, which results in θc = 79.57°. In this manner, the light was confined within the PDMS channel due to the successive total internal reflections at the solid–liquid interfaces. The penetration length of the light beam along the channel can be significantly increased by using this optofluidic waveguide-based PBR. Since most solid materials have higher refractive indices than the liquids (especially aqueous medium), the Teflon AF proves to be a most suitable choice for a coating material that have refractive index less than that of liquid media. Moreover, its biocompatibility ensures the use of the present system for various cell strains cultivation.

The microalgae in the PBR can act as an individual point scatter after interplaying with the incident light. In this study, we neglect this effect because (1) most of the scattering takes place as a forward scattering form with θ < 20°, (2) the initial cell density is not high and (3) the microalgae culture period is up to 5 days, which is short.36

Cell growth in Teflon AF-coated PBR

Several parameters have been employed to assess the photosynthesis of cyanobacteria, e.g., oxygen production,37 hydrogen production,38 CO2 consumption,39 dry cell mass concentration,40 and auto-fluorescence from the cell membrane.4,18,41 In this study, we quantified the local/global cell growth rate and the cell density by measuring the auto-fluorescence signal which is simple, reliable and accurate. The fluorescence intensity was measured at a wavelength of 670 nm on the bottom layer of the PBRs using a fluorescence microscope with 2× and 20× objectives, respectively. Fig. 4 shows the cell populations on day-0 to day-5. The average fluorescence intensity of each lattice grid was calculated by an in-house code written in C (programming language). As the cyanobacteria grew, the average fluorescence intensity increased. To assess the interrelation between the cell growth and location within the PBR, the cell growth of each lattice was measured by calculating the average intensity.
image file: c5ra24344k-f4.tif
Fig. 4 Fluorescence images of cells grown in (a) regular PDMS PBR, 1 mW (b) Teflon AF-coated PBR, 1 mW and (c) Teflon AF-coated PBR, 2 mW on day-0 and day-5. The top images were taken by a 2× objective lens, and the bottom images by a 20× objective lens. The scale bars are 1 mm and 100 μm, respectively.

Fig. 5(a) shows the average fluorescence intensity under 4 different input power conditions on each day. For the calculations, a specific threshold value (cut-off value) was subtracted from the intensity profile for the noise reduction. The intensity of the control PBR (without light) increased slightly because the microalgae began to settle down on the bottom of the PBR. At 1 mW laser power, the cell growth rate was greater in the Teflon AF-coated PBR than in the regular device, and it was even greater in the Teflon AF-coated PBR at 2 mW. During the 5 day cell cultivation, the fluorescence intensity increased by 13.02% and 20.03% for the regular and Teflon AF-coated PBRs, respectively, at 1 mW light illumination. Meanwhile, it increased by 24.18% in the Teflon AF-coated PBR with 2 mW light illumination. The optofluidic waveguide platform gave rise to the 7.01% growth enhancement, compared to the regular PBR at 1 mW light illumination. The system obtained further 4.15% improvement by doubling the laser power (from 1 to 2 mW), which verified the effectiveness of the Teflon AF-coated optofluidic waveguide PBR. In order to zoom into more details, the average fluorescence intensities were depicted along the channel longitudinal direction, as shown in Fig. 5(b). Irrespective of whether the PBR was coated with Teflon AF layer or not, the fluorescence intensities (i.e., cell growth) were quite similar until 15 mm from the point of light incidence. However, the fluorescence intensity in the regular PBR began to decrease after 15 mm, while it slightly increased for the Teflon AF-coated PBR. This implies that the optical penetration length was approximately 15 mm for the regular PBR, whereas it increased up to 2-folds or more by employing the Teflon AF coating. The heat maps, shown in Fig. 6, present an avid difference between the two cases, where the calculated average fluorescence intensities at each lattice grid successfully describe the tracking of local cell growth tendency. The maximal fluorescence was observed between 15 and 35 mm from the light source, which supports the interpretations in Fig. 5.


image file: c5ra24344k-f5.tif
Fig. 5 (a) Fluorescence intensity of cells grown under different light conditions from day-0 to 5. (b) Fluorescence intensity of cells grown under different light conditions at different locations from the PBR inlet on day-5.

image file: c5ra24344k-f6.tif
Fig. 6 Heat maps of fluorescence intensity in the 4 PBRs at different locations over the course of 5 days.

Fig. 7(a) shows the OD450 which were measured in parallel to the fluorescence intensity acquisition. The OD450 of cells grown without the light (i.e., control) did not significantly change (ranging from 0.2832 to 0.2855; 0.8%). At 1 mW light illumination, it increased from 0.2912 to 0.4538 (55.84%) for cells grown in the regular PBR, while increased from 0.2966 to 0.4803 (61.94%) for cells grown in the Teflon AF-coated PBR. For Teflon AF-coated PBR maintained at 2 mW optical power, the optical density increased from 0.2916 to 0.5175 (77.47%). After several trials, the range of light intensity used in these experiments was set to be lower than the saturation point at which additional irradiance did not contribute to the cell growth rate. Graham et al.4 investigated the irradiance for the saturation of the cell growth in a microfluidic platform and found that it is 41 μmol m−2 s−1. Fig. 7(b) shows the specific growth rate of the cyanobacteria based on the measured OD450 data. The specific growth rate (μ, d−1) is defined by.42

 
image file: c5ra24344k-t2.tif(3)
where Nt and N0 are the cell densities on the first and last days, respectively, and Δt is the time interval (in this study, 5 days). In darkness, the specific growth rate was 0.0016, indicating the negligible cell growth. At 1 mW, the specific growth rate of cells in the Teflon AF-coated PBR was 8.68% greater than that in the regular PBRs (0.0887 vs. 0.0964 d−1). In addition, the specific growth rate of cells in the Teflon AF-coated PBR with 2 mW light illumination was 0.1147 d−1, an 18.96% increase over that of cells grown in 1 mW Teflon AF-coated PBR. Considering the improvement in the growth rate magnitude by the illuminated light power change from 1 to 2 mW (18.96%), the optofluidic waveguide-based PBR system realized the reasonable performance enhancement (9%). The results of the fluorescent intensity and the optical density were well correlated.


image file: c5ra24344k-f7.tif
Fig. 7 (a) Optical density (OD450) of cells grown under different lighting conditions from day-0 to day-5. (b) Specific growth rate of cells grown under different lighting conditions based optical density values on day-0 and day-5.

Conclusions

This study demonstrated the feasibility of the thin layer coating of Teflon AF for the total internal reflection-based waveguide construction, leading to the efficient cell growth strategy in micro- and meso-scale photobioreactors (PBRs). The Teflon AF solution formed a thin solid layer that had lower refractive index than the liquid medium within the PBRs. As the light from the optical fibre propagated through the reactor, the total internal reflection took place at the solid–liquid interface (between the Teflon AF layer and the culture medium). Experiment was performed for 5 days and the optical penetration length could be extended up to 2 times by employing the proposed optofluidic waveguide-based PBR. For comparison, cyanobacteria were cultured in both the regular and the Teflon AF-coated PBRs simultaneously under the various light conditions. The auto-fluorescence images and the cell growth indicator were obtained using the fluorescence microscopy and both the local and global auto-fluorescence signals were calculated by the in-house code with noise reduction. In parallel, the optical density (OD450) was measured every day as an independent measurement of cell growth for the correlation with the fluorescence intensity results. The optofluidic waveguide-based PBR improved the cell growth by 7.01% and 8.68% (from the fluorescence intensity and the OD450 data, respectively) compared to the regular PBR.

Acknowledgements

This work was supported by the Creative Research Initiatives (No. 2015-001828) program of the National Research Foundation of Korea (MSIP).

Notes and references

  1. Y. Chisti, Biotechnol. Adv., 2007, 25, 294–306 CrossRef CAS PubMed.
  2. R. H. Wijffels and M. J. Barbosa, Science, 2010, 329, 796–799 CrossRef CAS PubMed.
  3. Y. Chisti, Trends Biotechnol., 2008, 26, 126–131 CrossRef CAS PubMed.
  4. P. J. Graham, J. Riordon and D. Sinton, Lab Chip, 2015, 15, 3116–3124 RSC.
  5. D. Erickson, D. Sinton and D. Psaltis, Nat. Photonics, 2011, 5, 583–590 CrossRef CAS.
  6. T. Takeshita, Appl. Energy, 2011, 88, 3481–3491 CrossRef CAS.
  7. Y. F. Shen, RSC Adv., 2014, 4, 49672–49722 RSC.
  8. R. Dineshkumar, S. K. Dash and R. Sen, RSC Adv., 2015, 5, 73381–73394 RSC.
  9. A. Karemore and R. Sen, RSC Adv., 2015, 5, 70929–70938 RSC.
  10. H. Lee and S. Choi, Lab Chip, 2015, 15, 391–398 RSC.
  11. E. M. Grima, F. G. A. Fernandez, F. G. Camacho and Y. Chisti, J. Biotechnol., 1999, 70, 231–247 CrossRef.
  12. C. U. Ugwu, H. Aoyagi and H. Uchiyama, Bioresour. Technol., 2008, 99, 4021–4028 CrossRef CAS PubMed.
  13. F. Lehr and C. Posten, Curr. Opin. Biotechnol., 2009, 20, 280–285 CrossRef CAS PubMed.
  14. A. K. Gebremariam and Y. Zarmi, J. Appl. Phys., 2012, 111, 034904 CrossRef.
  15. E. Greenwald, J. M. Gordon and Y. Zarmi, Appl. Phys. Lett., 2012, 100, 143703 CrossRef.
  16. S. Torkamani, S. N. Wani, Y. J. Tang and R. Sureshkumar, Appl. Phys. Lett., 2010, 97, 043703 CrossRef.
  17. E. E. Jung, M. Kalontarov, D. F. Doud, M. D. Ooms, L. T. Angenent, D. Sinton and D. Erickson, Lab Chip, 2012, 12, 3740–3745 RSC.
  18. M. Kalontarov, D. F. R. Doud, E. E. Jung, L. T. Angenent and D. Erickson, RSC Adv., 2013, 3, 13203 RSC.
  19. M. D. Ooms, V. J. Sieben, S. C. Pierobon, E. E. Jung, M. Kalontarov, D. Erickson and D. Sinton, Phys. Chem. Chem. Phys., 2012, 14, 4817–4823 RSC.
  20. S. C. Pierobon, M. D. Ooms and D. Sinton, J. Micromech. Microeng., 2014, 24, 045017 CrossRef.
  21. M. D. Ooms, L. Bajin and D. Sinton, Appl. Phys. Lett., 2012, 101, 253701 CrossRef.
  22. M. D. Ooms, Y. Jeyaram and D. Sinton, Appl. Phys. Lett., 2015, 106, 063902 CrossRef.
  23. S. H. Cho, J. Godin and Y.-H. Lo, IEEE Photonics Technol. Lett., 2009, 21, 1057–1059 CrossRef CAS PubMed.
  24. K. S. Lee, S. B. Kim, K. H. Lee, H. J. Sung and S. S. Kim, Appl. Phys. Lett., 2010, 97, 201109 CrossRef.
  25. S. H. Cho, C. H. Chen, F. S. Tsai, J. M. Godin and Y. H. Lo, Lab Chip, 2010, 10, 1567–1573 RSC.
  26. C. Monat, Nature, 2007, 1, 106–114 CAS.
  27. H. Schmidt and A. R. Hawkins, Microfluid. Nanofluid., 2008, 4, 3–16 CrossRef CAS PubMed.
  28. A. R. Hawkins and H. Schmidt, Microfluid. Nanofluid., 2008, 4, 17–32 CrossRef CAS PubMed.
  29. E. A. Van Nierop, B. Scheid and H. A. Stone, J. Fluid Mech., 2008, 602, 119–127 Search PubMed.
  30. B. R. Liu, Y. W. Huang and H. J. Lee, BMC Microbiol., 2013, 13, 57 CrossRef CAS PubMed.
  31. H. S. Kim, T. L. Weiss, H. R. Thapa, T. P. Devarenne and A. Han, Lab Chip, 2014, 14, 1415–1425 RSC.
  32. E. G. Andrizhiyevskaya, T. M. E. Schwabe, M. Germano, S. D'Haene, J. Kruip, R. van Grondelle and J. P. Dekker, Biochim. Biophys. Acta, Bioenerg., 2002, 1556, 265–272 CrossRef CAS.
  33. C. Churro, E. Alverca, F. Sam-Bento, S. Paulino, V. C. Figueira, A. J. Bento, S. Prabhakar, A. M. Lobo, A. J. Calado and P. Pereira, J. Appl. Phycol., 2008, 21, 429–442 CrossRef.
  34. E. Dias, M. Oliveira, D. Jones-Dias, V. Vasconcelos, E. Ferreira, V. Manageiro and M. Canica, Front. Aquat. Microbiol., 2015, 6, 799 Search PubMed.
  35. G. R. Fowles, Introduction to modern optics, Holt, Rinehart and Winston, New York, 2nd edn, 1975 Search PubMed.
  36. A. K. Gaigalas, H. J. He and L. L. Wang, J. Res. Natl. Inst. Stand. Technol., 2009, 114, 69–81 CrossRef CAS.
  37. T. D. B. Mackenzie, R. A. Burns and D. A. Campbell, Carbon status constrains light acclimation in the cyanobacterium Synechococcus elongatus, Plant Physiol., 2004, 136, 3301–3312 CrossRef CAS PubMed.
  38. C. Y. Chen, C. M. Lee and J. S. Chang, Biochem. Eng. J., 2006, 32, 33–42 CrossRef CAS.
  39. P. H. Chen, H. L. Liu, Y. J. Chen, Y. H. Cheng, W. L. Lin, C. H. Yeh and C. H. Chang, Energy Environ. Sci., 2012, 5, 8318 CAS.
  40. H. S. Kwon, J. H. Lee, T. Kim, J. J. Kim, P. Jeon, C. H. Lee and I. S. Ahn, RSC Adv., 2015, 5, 7151–7159 RSC.
  41. A. Volgusheva, G. Kukarskikh, T. Krendeleva, A. Rubin and F. Mamedov, RSC Adv., 2015, 5, 5633–5637 RSC.
  42. K. Issarapayup, S. Powtongsook and P. Pavasant, J. Biotechnol., 2009, 142, 227–232 CrossRef CAS PubMed.

Footnote

These authors contributed equally.

This journal is © The Royal Society of Chemistry 2016
Click here to see how this site uses Cookies. View our privacy policy here.