An electrochemical sensor for determination of tryptophan in the presence of DA based on poly(L-methionine)/graphene modified electrode
Yingzi Wang,
Xiaoqian Ouyang,
Yaping Ding*,
Bingdi Liu,
Duo Xu and
Lanfeng Liao
Department of Chemistry, Shanghai University, Shanghai 200444, P. R. China. E-mail: wdingyp@sina.com; Fax: +86 21 66132797; Tel: +86 21 66134734
First published on 15th January 2016
Abstract
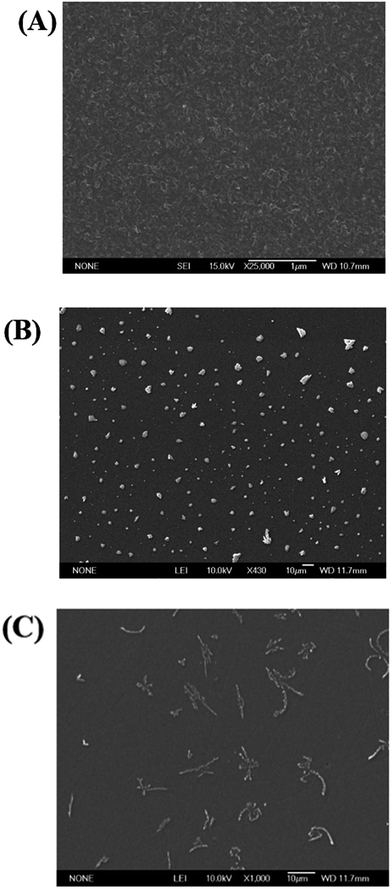
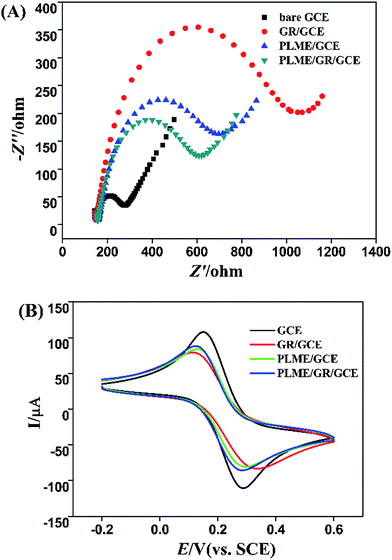
A glassy carbon electrode modified with poly(L-methionine) and graphene composite film (PLME/GR/GCE) was fabricated by electropolymerization for determination of L-tryptophan (L-Trp) in the presence of dopamine (DA). The morphology and structure of the composite film were investigated by scanning electron microscopy (SEM), Fourier transform infrared spectroscopy (FT-IR), Raman spectroscopy and electrochemical impedance spectroscopy (EIS). Differential pulse voltammetry (DPV) was utilized to investigate the electrocatalytical oxidation of L-Trp from the potentially interfering species on the PLME/GR/GCE. Under optimum conditions, the proposed method exhibited a wide linear dynamic range 0.2–150 μM, with a detection limit (S/N = 3), and good reproducibility and high selectivity. Moreover, the proposed modified electrode has been successfully applied to determine L-Trp in milk and human serum samples.
1. Introduction
L-Tryptophan (Trp) is an essential amino acid with biochemical, nutritional and clinical significance in humans and herbivores.1 It is a derivative of alanine with an indole substituent on the β carbon.2 Substituted indole rings are widely used in biochemistry. Trp is an indispensable amino acid since our body cannot synthesize it from other compounds through chemical reactions. It is commonly synthesized in plants and microorganisms from shikimic acid.3 Trp is abundantly present in oats, milk, chocolates, bananas, yogurt, dried dates, etc. as component of dietary protein while it is scarcely present in vegetables. Apart from playing a pivotal role in the production of nervous system messengers, it acts as a precursor for many neurotransmitters and neurochemicals, including serotonin and melatonin.4,5 Melatonin is known to help improve sleep, and serotonin is needed to improve mood and mental health.6 Dopamine (DA) is also a kind of neurotransmitters, which is found in whole human body and brain the same with Trp. The connection of those two is an important part in psychiatry. Simultaneous determination of Trp and DA is important, since both occur together in biological systems. The Trp supplements have been used for some time as antidepressants, sleep aids and weigh-loss aids. Improper metabolism of Trp accumulates toxic products in brain which causes hallucinations, delusions and schizophrenia.7 An overdose of Trp creates drowsiness, nausea, dizziness and loss of appetite.8 Meanwhile, DA system plays a central role in important medical conditions including Parkinson's disease, attention deficit hyperactivity disorder, schizophrenia, and drug addiction. Therefore, it is relevant to develop a simple, fast, inexpensive and accurate method for the determination of Trp in food products, pharmaceuticals and biological fluids in the presence of DA and is likely to have great significance in life science research and drug analysis.Some methods have been developed for the determination of Trp and DA including, chromatographic methods,9 chemiluminescence,10 capillary electrophoresis11 and electrochemical methods.12 Among these methods, owing to Trp and DA taking part in complex biochemical reactions are electroactive, electrochemical techniques, with high sensitivity, high accuracy and simple operation, have been paid much more attention in recent years. However, the electrochemical detection of Trp faces some problems. At traditional working electrodes, Trp oxidation suffers from high overpotential and sluggish kinetics.13 Chemically modified electrodes have been constructed to overcome the problem, such as Au-NPs/GCE,14 GNP/CILE,6 MCPE/MWCNTs,15 MWCNT-LDH-CPE,2 poly(4-aminobenzoic acid)/GCE,16 poly-sulfosalicylic acid/GCE.17 Among these electrodes, polymer film modified electrodes have been paid great attention due to their good stability, biocompatibility, homogeneity, strong adherence to electrode surface.18,19 Studies have indicated that polymer film modified electrodes show an enhanced response for the determination of various important biological and clinical species20–22 owing to the ability to provide a platform to selective recognition.23 The thickness, permeation and charge transport characteristics of the polymeric films can be controlled by the potential and current applied.
As we know, graphene (GR) has attracted intense attention since its discovery in 2004.24 The graphene has perfect conductivity which can amplify electrochemical signal,23 because of its fascinating two-dimensional structure, unusual electrochemical properties, large accessible surface area, as well as good biocompatibility.25,26
In short, the synergy of graphene and polymer leads to successful and effective recognition tryptophan. Those two materials can be modified compactly and homogeneously on the surface GCE owing to the electrostatic interactions. Thus, the composite film is applied to the electrochemical tryptophan, and the graphene combined polymer modified on GCE can be evaluated by electrochemical methods revealed a higher L-Trp affinity.27
In this paper, L-methionine (LME) was chosen as a monomer to form a polymer modified film. It is one of the sulfur-containing proteinogenic amino acids and governs the main supply of sulfur in the diet, and also prevents disorders in hair and skin. Thus, we have fabricated a PLME/GR/GCE modified electrode by electro-polymerization. The modified electrode was characterized by electrochemical impedance spectroscopy and scanning electron microscopy, and it was applied to the electrocatalytic oxidation of L-tryptophan (L-Trp) by differential pulse voltammetry (DPV). The process was simple and fast. Moreover, the modified electrode showed excellent electrocatalytic properties in determination of L-Trp, making it suitable for the analytical purpose.
2. Experimental
2.1 Reagents and apparatus
L-Trp, L-methionine and DA were supplied from obtained from Sinopharm Chemical Reagent Co., Ltd (Shanghai, China). Graphene was purchased from XFNANO, INC (Nanjing, China). Phosphate buffer solutions (PBS, 0.1 M) with different pH values were prepared by mixing stock solution of 0.1 M K2HPO4, 0.1 M KH2PO4 and 0.1 M H3PO4 (Shanghai Chemical Reagent Co., Ltd, China). All chemicals were of analytical grade and used without further purification.All electrochemical experiments were carried out on a CHI 660C electrochemical workstation (Shanghai Chenhua Co., Ltd, China) with a conventional three-electrode system consisting of a PLME decorated GR modified glassy carbon electrode, a saturated calomel reference electrode and a Pt foil counter electrode. The pH value was determined with a pHS-3C acidity meter. Scanning electron micrographs (SEM) were carried out using a scanning electron microscope (JSM-6700F, 15.0 kV). Fourier transform infrared (FTIR) spectra were carried out on a Fourier transform infrared spectrometer (AVATAR 370, America). Raman scattering was performed on an INVIA (England) Raman Microscope using a 545.5 nm laser source.
2.2 Preparation of PLME/GR/GCEC
Prior to modification, the GCE was polished on chamois leather with 0.05 μm α-alumina powder, thoroughly rinsed with water and sonicated in 1![[thin space (1/6-em)]](https://www.rsc.org/images/entities/char_2009.gif) :
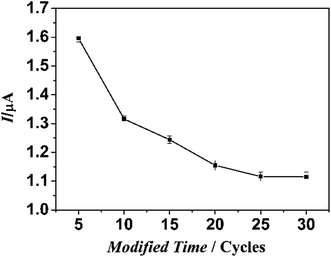
:![[thin space (1/6-em)]](https://www.rsc.org/images/entities/char_2009.gif) 1 (v/v) HNO3, absolute alcohol and doubly distilled water in turn. The GR/GCE was gained via electro-deposition by applying a potentiostatic potential of +1.8 V in 0.1 M KCl containing 200 mL 1 mg mL−1 GR.28,29 Electropolymerization of L-methionine on the GR/GCE was carried out by 5 circles in 0.1 M PBS (pH 6.0) containing 1 mM L-methionine. The parameters of this method were set as follows: potential range, −0.8–2.1 V; scan rate, 100 mV s−1; sample interval, 1 mV; sweep segment, 10; quiet time, 2 s. All experimental procedures were performed at room temperature. Then PLME/GR/GCE was fabricated. Electrochemical response of L-Trp at bare GCE, GCE modified with L-methionine alone (PLME/GCE) and GR/GCE were also followed for comparison.
1 (v/v) HNO3, absolute alcohol and doubly distilled water in turn. The GR/GCE was gained via electro-deposition by applying a potentiostatic potential of +1.8 V in 0.1 M KCl containing 200 mL 1 mg mL−1 GR.28,29 Electropolymerization of L-methionine on the GR/GCE was carried out by 5 circles in 0.1 M PBS (pH 6.0) containing 1 mM L-methionine. The parameters of this method were set as follows: potential range, −0.8–2.1 V; scan rate, 100 mV s−1; sample interval, 1 mV; sweep segment, 10; quiet time, 2 s. All experimental procedures were performed at room temperature. Then PLME/GR/GCE was fabricated. Electrochemical response of L-Trp at bare GCE, GCE modified with L-methionine alone (PLME/GCE) and GR/GCE were also followed for comparison.
3. Results and discussion
3.1 Characterization of modified electrode
Fig. 2A illustrates the FTIR spectra of the monomer methionine (a) and poly(methionine) (b). As show in curve a, it can be seen peaks of C–H stretching vibration (2918 cm−1), N–H stretching vibration (3449 cm−1), O–H stretching vibration (2609 cm−1), C–S stretching vibration (536 cm−1). These peaks are assigned to characteristic absorption of methionine. As shown in curve b, it can be seen that the peaks of 2111 cm−1 disappeared because the peaks of N–H became weak and the peaks in fingerprint region become broader after polymerization.30 This was caused by the poly-reaction of methionine, indicating that the PLME film has been formed.
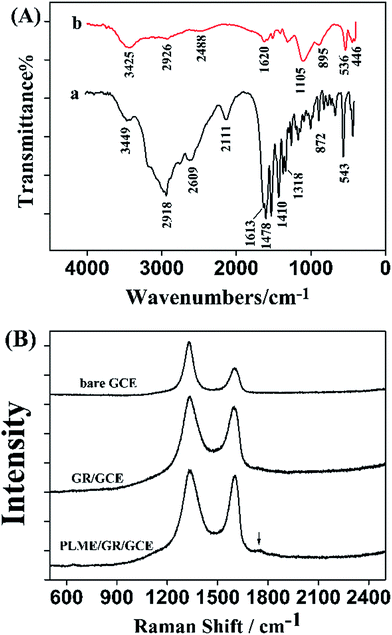 | ||
| Fig. 2 (A) Fourier transforms infrared spectra of L-methionine (a) and poly(L-methionine) (b), (B) Raman spectra of bare GCE, GR/GCE and PLME/GR/GCE. | ||
Raman spectroscopy is a powerful nondestructive tool to distinguish ordered and disordered crystal structures of carbon. The G-band, which originates from the first-order scattering from the doubly degenerate E2g phonon modes of graphite in the Brillouin zone center, is characteristic of all sp2-hybridized carbon networks, while the prominent D peak is a breathing mode of k-point phonons of A1g symmetry, assigned to structural imperfections created by the attachment of oxygenated groups on the carbon basal plane.31–33 Thus, the intensity ratio of the D and G bands (ID/IG) offers not only clues to the oxidation degree and the size of sp2 ring clusters in a network of sp3 and sp2 bonded carbon,34 but also the degree of defects and disorder of the graphitized structures.35,36 Fig. 2B presents the Raman spectra of bare GCE, GR/GCE and PLME/GR/GCE with a distinguished changing of D/G intensity ratio. Specifically, the intensity ratio decrease from 1.815 of bare GCE to 1.093 of GR/GCE. After the modification of PLME onto GR, the intensity ratio was 1.052 and a weak peak appeared at 1753 cm−1. The two prominent peaks of the D and G bands also shifted from 1328.3 and 1600.9 cm−1 of bare GCE to 1323.0 and 1601.9 cm−1 of GR/GCE, and 1340.4 and 1605.4 cm−1 of PLME/GR/GCE.
3.2 Electrochemical behavior of modified electrode
The electrochemical behavior of modified electrode in the presence of L-Trp was investigated by differential pulse voltammograms (DPV). The parameters of this method were set as follows: potential range, 0.4–1.1 V; potential increments, 0.004 V; pulse period, 0.5 s; sample width, 0.0167 s; quiet time, 20 s. All experimental procedures were performed at room temperature. Fig. 4 displays the DPV of the electrochemical oxidation of 10 μM L-Trp in 0.1 M PBS (pH 2.5) at bare GCE (a), PLME/GCE (b), GR/GCE (c) and PLME/GR/GCE (d). As for the bare GCE, the oxidation peak of L-Trp was weak, and the oxidation peak of L-Trp appeared at 0.82 V. At the PLME/GCE, the oxidation current of L-Trp was larger, and the oxidation peak appeared shifted negatively to 0.80 V. After compositing the PLME and GR film, the oxidation current of L-Trp became larger and the oxidation peak appeared at 0.76 V, demonstrating that the combination of the PLME and GR helps enhance the kinetics of the electrochemical process as an efficient promoter.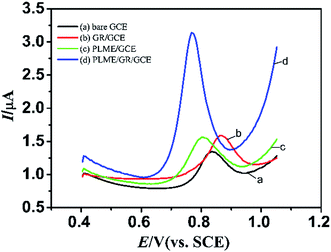 | ||
| Fig. 4 DPVs for 10 μM L-Trp in 0.1 M PBS (pH 2.5) at bare GCE (a), GR/GCE (b), PLME/GCE (c), and PLME/GR/GCE (d). | ||
3.3 Effect of operational parameters
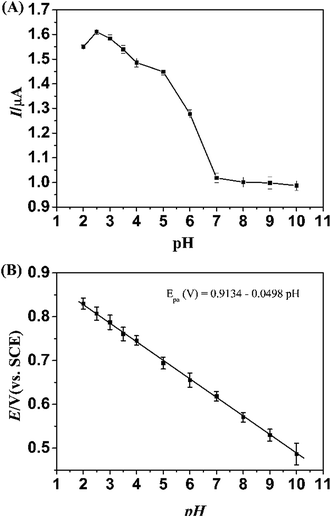 | ||
| Fig. 5 Influence of pH on the difference of the peak currents (A) and the peak potentials (B) obtained from DPV for 10 μM L-Trp at the PLME/GR/GCE modified electrodes. | ||
The pH value of the supporting electrolyte is an important factor that affects the electrochemical reactions of analytes. Fig. 5B represents the oxidation peak potential (Epa) of 10 μM L-Trp at PLME/GR/GCE shifted negatively with the increase of pH associated with a proton-transfer process. Linear dependence between potentials and pH for L-Trp was obtained as follows:
| Epa (V) = 0.9134 − 0.0498pH (R = 0.9997). |
The slope of the equation is −49.8 mV pH−1, which is in agreement with the ideal state 59 mV pH−1 (25 °C). The result shows that the number of proton equals that of electron in the reaction.
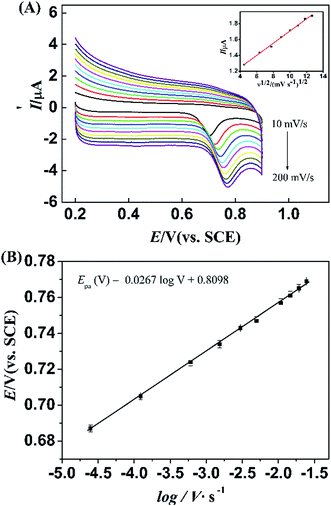
To further characterize the kinetic parameters, the influence of the scan rate on the redox peak potential (Epa) for L-Trp was also investigated by CV methods. This is according to the Laviron method.38 The method predicts a linear relationship between Epa and the logarithm of scan rate (log![[thin space (1/6-em)]](https://www.rsc.org/images/entities/char_2009.gif) ν). On the basis of Laviron's model, the relationship between the potential and the scan rate can be expressed as follow.
ν). On the basis of Laviron's model, the relationship between the potential and the scan rate can be expressed as follow.
In Fig. 7B, it can be observed that the oxidation peak potential shifted positively with the increase of scan rate, and the Epa showed a linear dependence with log![[thin space (1/6-em)]](https://www.rsc.org/images/entities/char_2009.gif) ν. The linear regression equation for L-Trp is as follow
ν. The linear regression equation for L-Trp is as follow
Epa (V) = 0.8089 + 0.0267![[thin space (1/6-em)]](https://www.rsc.org/images/entities/char_2009.gif) log log![[thin space (1/6-em)]](https://www.rsc.org/images/entities/char_2009.gif) ν (V s−1, R = 0.9987) ν (V s−1, R = 0.9987) |
Generally, the electron-transfer coefficient (α) is around 0.4–0.6.39 Assuming the electron-transfer coefficient to be 0.6 for an irreversible electrode process. Accordingly, the electron-transfer number (n) can be calculated: for L-Trp is 1.85, which is in agreement with previously reported result.
Hence, the overall oxidation process of L-Trp involves two electrons and two protons as shown in Scheme 1. Our results are consistent with the mechanism reported in the literature.
3.4 Calibration curve and interferences
Under the optimum conditions, the electrochemical behaviors of different concentrations of L-Trp were studied. As shown in Fig. 8, the change of DPVs indicates that the oxidative peak current (Ipa) has linear relationship with the concentration (c) of L-Trp. In the range from 4.0 × 10⁻⁸ to 1.0 × 10⁻⁵ M, a linear regression equations:| Ipa = 0.1147 + 0.312c (μM) (R = 0.9953) |
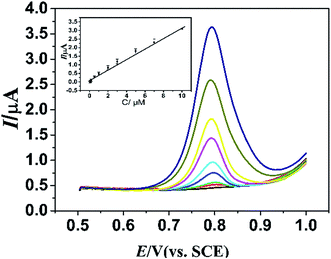 | ||
| Fig. 8 DPVs of determination of L-Trp (0.04–10 μM) using PLME/GR/GCE in 0.1 M PBS (pH 2.5). Inset: plots of Ip vs. concentrations of L-Trp. | ||
| Electrode | Dynamic ranges (μM) | Detection limits (μM) | References |
|---|---|---|---|
| Poly(4-aminobenzoic acid) GCE | 1.0–100 | 0.2 | 16 |
| CILE/GNP | 5.0–900 | 4.0 | 6 |
| MWNTs/Mg–Al/CPE | 3–9, 9–1000 | 0.0068 | 2 |
| Nano-TiO2/FCCa/CPE | 0.4–14 | 0.124 | 40 |
| MWNTs/GS/GCE | 5–30, 60–500 | 0.87 | 41 |
| GNPs/PImox | 3–464 | 0.70 | 42 |
| MWCNTs–NHNPs–MCM-41/GCE | 0.5–50 | 0.11 | 43 |
| PLME/GR/GCE | 0.05–10 | 0.017 | This work |
In addition, DA is an important biological substance which often coexists with L-Trp in biological samples. To evaluate the influence of DA on the determination of L-Trp, DA was added into 0.1 M PBS containing L-Trp for determination. Fig. 9 displays the DPV of different concentration of L-Trp in 0.1 M PBS containing 5 μM DA. The peak currents increased synchronously with concentrations of L-Trp, implying that PLME/GR/GCE can be also applied for the simultaneous determination of L-Trp in the presence of DA. A linear regression range was obtained:
| Ipa = −0.0041 + 0.5095c (μM) (R = 0.995) (0.2–10 μM); |
| Ipa = 4.8955 + 0.0451c (μM) (R = 0.995) (10–150 μM). |
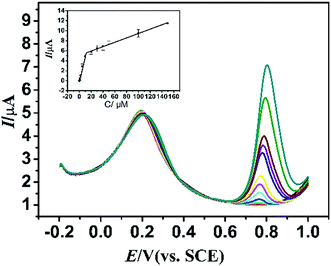 | ||
| Fig. 9 DPVs of determination of L-Trp (0.2–150 μM) in the presence of 10 μM DA using PLME/GR/GCE in 0.1 M PBS (pH 2.5). Inset: plots of Ip vs. concentrations of L-Trp. | ||
To investigate other possible interferences for the detection of L-Trp, various foreign species were added into 0.1 M PBS (pH 2.5) containing 10 μM L-Trp. Table 2 shows the signal change of different potential interferences for the determination of 10 μM L-Trp. It was found that no significant interference (signal change <5%) for these compounds: NaCl (500 μM), KNO3 (500 μM), ZnSO4 (500 μM), NHCl4 (500 μM), L-glucose (500 μM), L-threonine (500 μM), L-serine (500 μM), L-alanine (500 μM), L-asparagic acid (500 μM), L-leucine (100 μM), ascorbic acid (250 μM), dopamine (100 μM) and UA (100 μM).
| Interferences | Concentration (μM) | Signal change |
|---|---|---|
| L-Trp | ||
| Na+ | 500 | −4.80% |
| K+ | 500 | −3.34% |
| Zn2+ | 500 | −0.50% |
| Mg2+ | 500 | −4.13% |
| NH4+ | 500 | −4.90% |
| Cl− | 500 | −4.80% |
| NO3− | 500 | −3.34% |
| SO42− | 500 | −0.50% |
| D-Glucose | 500 | −4.60% |
| L-Threonine | 500 | −4.90% |
| L-Serine | 500 | −4.80% |
| L-Alanine | 500 | −4.00% |
| Asparagic acid | 500 | −4.30% |
| Leucine | 100 | −3.38% |
| Ascorbic acid | 250 | 2.90% |
| Dopamine | 100 | 2.75% |
3.5 Reproducibility and stability
In order to evaluate the precision of this method, a series of repetitive voltammetric measurements were carried out at the same PLME/GR/GCE. The relative standard deviations (R.S.D.) for seven successive determinations of 10 μM L-Trp was 1.40%, indicating an excellent detecting reproducibility. The storage stability of PLME/GR/GCE was also investigated. After the modified electrode stored in the refrigerator for two weeks, the result shows that the catalytic current response maintains 99.6%, and after stored for 30 days, the catalytic current response maintains 89.7%, illustrating the good stability of the proposed sensor.3.6 Real samples analysis
Human serum samples and milk were selected as real samples for analysis by the propose method. Both the serum samples and milk was diluted 5 times. The diluted serum sample (20 μL) was directly added into 10 mL of 0.1 PBS (pH 2.5). The diluted milk (20 μL) was injected into the same PBS solution. Both the solutions were analyzed by the standard addition method for three times. The results were listed in Table 3. The good recoveries of the samples indicate that the developed sensor is applicable to the determination of L-Trp in real samples.| Samples | Detected (μM) | Added (μM) | Found (μM) | Recovery |
|---|---|---|---|---|
| Serum 1 | — | 0.50 | 0.48 | 96.7% |
| — | 1.00 | 1.04 | 103.9% | |
| — | 1.50 | 1.54 | 103.1% | |
| — | 3.00 | 3.14 | 104.7% | |
| Milk | 0.5 | 0.51 | 103.0% | |
| 1.0 | 0.97 | 97.0% | ||
| — | 1.5 | 1.49 | 99.3% | |
| — | 3.0 | 3.12 | 104.0% |
4. Conclusions
A convenient, rapid and stable biosensor for voltammetric determination of L-tryptophan was developed by modifying the GCE with poly(L-methionine) and graphene composite film. The PLME/GR modified electrode is easy to prepare and exhibited excellent electrocatalytic activity for L-Trp in the presence of DA. By this simple method of fabrication, a much lower detection limit was achieved without involving any pre-treatment or activation steps. Moreover, the analytical applicability of the modified electrode has been evaluated by successfully employing it for the determination of L-Trp in the blood serum and milk.Acknowledgements
This work is supported by the National Natural Science Foundation of China (No. 21271127, 61171033), the Nano-Foundation of Science and Techniques Commission of Shanghai Municipality (No. 12nm0504200, 12dz1909403).References
- H. Wang, H. Cui, A. Zhang and R. Liu, Anal. Commun., 1996, 33, 275–277 RSC.
- O. J. D'Souza, R. J. Mascarenhas, T. Thomas, I. N. N. Namboothiri, M. Rajamathi, P. Martis and J. Dalhalle, J. Electroanal. Chem., 2013, 704, 220–226 CrossRef.
- A. A. Ensafi, H. K. Maleh and S. Mallakpour, Electroanalysis, 2012, 24, 666–675 CrossRef CAS.
- D. Ye, L. Luo, Y. Ding, B. Liu and X. Liu, Analyst, 2012, 137, 2840–2845 RSC.
- K. Palme and F. Nagy, Cell, 2008, 133, 31–32 CrossRef CAS PubMed.
- A. Safavi and S. Momeni, Electroanalysis, 2010, 22, 2848–2855 CrossRef CAS.
- R. N. Goyal, S. Bishnoi, H. Chasta, M. A. Aziz and M. Oyama, Talanta, 2011, 85, 2626–2631 CrossRef CAS PubMed.
- A. Ozcan and Y. Sahin, Biosens. Bioelectron., 2012, 31, 26–31 CrossRef CAS PubMed.
- E. Kojima, M. Kai and Y. Ohkura, J. Chromatogr. A, 1993, 612, 90–187 Search PubMed.
- G. N. Chen, R. E. Lin and Z. F. Zhao, Anal. Chim. Acta, 1997, 341, 251–256 CrossRef CAS.
- A. Zinellu, S. Sotgia and L. Deiana, J. Sep. Sci., 2012, 35, 1146–1151 CrossRef CAS PubMed.
- G. P. Jin and X. Q. Lin, Electrochem. Commun., 2004, 6, 60–454 Search PubMed.
- Z. Zhang, S. Q. Gu, Y. P. Ding, J. D. Jin and F. F. Zhang, Anal. Methods, 2013, 5, 4859–4864 RSC.
- C. Y. Li, Y. Ya and G. Q. Zhan, Colloids Surf., B, 2010, 76, 340–345 CrossRef CAS PubMed.
- T. Thomas, R. J. Mascarenhas, O. J. D'Souza, P. Martis, J. Dalhalle and B. E. Kumara Swamy, J. Colloid Interface Sci., 2013, 402, 223–229 CrossRef CAS PubMed.
- K. J. Huang, C. X. Xu, W. Z. Xie and W. Wang, Colloids Surf., B, 2009, 74, 167–171 CrossRef CAS PubMed.
- X. Ba, L. Q. Luo, Y. P. Ding and X. Liu, Sens. Actuators, B, 2013, 187, 27–32 CrossRef CAS.
- F. Bedioui, J. Devynck and C. Bied-Charreton, Acc. Chem. Res., 1995, 28, 30–36 CrossRef CAS.
- B. I. Podlovchenko and V. N. Andreev, Russ. Chem. Rev., 2002, 71, 837–851 CrossRef CAS.
- M. E. Ghica and C. M. A. Brett, Talanta, 2014, 130, 198–206 CrossRef CAS PubMed.
- M. Taei and G. Ramazani, Colloids Surf., B, 2014, 123, 23–32 CrossRef CAS PubMed.
- H. M. Abdolhamid, G. Nasrin, A. K. Mohammad, G. Masoumeh and I. R. Somaieh, Electroanalysis, 2014, 26, 2491–2500 CrossRef.
- J. Ou, Y. X. Tao, J. J. Xue, Y. Kong, J. Y. Dai and L. H. Deng, Electrochem. Commun., 2015, 57, 5–9 CrossRef CAS.
- K. S. Novoselov, A. K. Geim, S. V. Morozov, D. Jiang, Y. Zhang, S. V. Dubonos, I. V. Grigorieva and A. A. Firsov, Science, 2004, 306, 666–669 CrossRef CAS PubMed.
- X. Wang, C. Wang, K. Qu, Y. Song, J. Ren, D. Miyoshi, N. Sugimoto and X. Qu, Adv. Funct. Mater., 2010, 20, 3967–3971 CrossRef CAS.
- A. K. Geim and K. S. Novoselov, Nat. Mater., 2007, 6, 183–191 CrossRef CAS PubMed.
- J. Ou, Y. H. Zhu, Y. Kong and J. F. Ma, Electrochem. Commun., 2015, 60, 60–63 CrossRef CAS.
- L. Jiang, S. Q. Gu, Y. P. Ding, F. Jiang and Z. Zhang, Nanoscale, 2014, 6, 207–214 RSC.
- X. Q. Ouyang, L. Q. Luo, Y. P. Ding, B. D. Liu and D. Xu, J. Electroanal. Chem., 2014, 735, 51–56 CrossRef CAS.
- W. H. Qiao, L. Wang, B. X. Ye, G. P. Li and J. J. Li, Analyst, 2015, 140, 7974–7983 RSC.
- D. Yang, A. Velamakanni, G. Bozoklu, S. Park, M. Stoller, R. D. Piner, S. Stankovich, I. Jung, D. A. Field and C. A. Ventrice, Carbon, 2009, 47, 145–152 CrossRef CAS.
- M. A. Pimenta, G. Dresselhaus, M. S. Dresselhaus, L. G. Cancado, A. Jorio and R. Saito, Phys. Chem. Chem. Phys., 2007, 9, 1276–1291 RSC.
- M. S. Dresselhaus, G. Dresselhaus and M. Hoffmann, Philos. Trans. R. Soc., A, 2008, 366, 231–236 CrossRef CAS PubMed.
- C. Mattevi, G. Eda, S. Agnoli, S. Miller, K. A. Mkhoyan, O. Celik, D. Mastrogiovanni, G. Granozzi, E. Garfunkel and M. Chhowalla, Adv. Funct. Mater., 2009, 19, 2577–2583 CrossRef CAS.
- D. Graf, F. Molitor, K. Ensslin, C. Stampfer, A. Jungen, C. Hierold and L. Wirtz, Nano Lett., 2007, 7, 238–242 CrossRef CAS PubMed.
- F. Tuinstra and J. L. Koenig, J. Chem. Phys., 1969, 53, 1126–1130 CrossRef.
- G. Pelossof, R. Tel-Vered, S. Shimron and I. Willner, Chem. Sci., 2013, 4, 1137–1144 RSC.
- Y. H. Huang, J. H. Chen, L. J. Ling, Z. B. Su, X. Sun, S. R. Hu, W. Weng, Y. Huang, W. B. Wu and Y. S. He, Analyst, 2015, 140, 7939–7949 RSC.
- O. J. D'Souza, R. J. Mascarenhas, A. K. Satpati, I. N. N. Namboothiri, S. Detriche, Z. Mekhalif and J. Delhallee, RSC Adv., 2015, 5, 91472–91481 RSC.
- J. B. Raoof, R. Ojani and M. Baghayeri, Sens. Actuators, B, 2009, 143, 261–269 CrossRef.
- H. X. Li, Y. Wang, D. X. Ye, J. Luo, B. Q. Su, S. Zhang and J. L. Kong, Talanta, 2014, 127, 255–261 CrossRef CAS PubMed.
- C. Wang, R. Yuan, Y. Q. Chai, S. H. Chen, F. X. Hu and M. H. Zhang, Anal. Chim. Acta, 2012, 741, 15–20 CrossRef CAS PubMed.
- A. Babaei, E. Ansari and M. Afrasiabi, Anal. Methods, 2014, 6, 8729–8737 RSC.
| This journal is © The Royal Society of Chemistry 2016 |

