Synthesis of porous MnCo2O4 microspheres with yolk–shell structure induced by concentration gradient and the effect on their performance in electrochemical energy storage

Guoyong Huangab, Shengming Xu*bc, Yue Yang*b, Hongyu Sun*d and Zhenghe Xube
aSchool of Metallurgy and Environment, Central South University, Changsha 410083, China
bInstitute of Nuclear and New Energy Technology, Tsinghua University, Beijing 100084, China. E-mail: smxu@tsinghua.edu.cn; eric1911@126.com
cBeijing Key Lab of Fine Ceramics, Tsinghua University, Beijing 100084, China
dDepartment of Micro- and Nanotechnology, Technical University of Denmark, 2800 Kongens Lyngby, Denmark. E-mail: hysuny@mail.tsinghua.edu.cn; hsun@nanotech.dtu.dk
eDepartment of Chemical and Materials Engineering, University of Alberta, Edmonton, Alberta T6G 2V4, Canada

Received 15th November 2015 , Accepted 18th January 2016

First published on 21st January 2016


Abstract

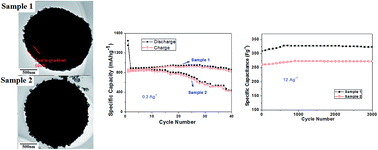
In this study, novel spherical yolk–shell MnCo2O4 powders with concentration gradient have been synthesized. The porous microspheres with yolk–shell structure (2.00–3.00 μm in average diameter, ∼200 nm in thickness of shell) are built up by irregular nanoparticles attached to each other. It is shown that the formation of yolk–shell structure may be induced by the core–shell concentration gradient. And the Co[thin space (1/6-em)]:[thin space (1/6-em)]Mn atomic ratios of core and shell are about 1.65[thin space (1/6-em)]:[thin space (1/6-em)]1 and 2.61[thin space (1/6-em)]:[thin space (1/6-em)]1, respectively. Interestingly, a similar uniform spherical MnCo2O4 without yolk–shell structure and concentration gradient prepared as a contrast, the superior electrochemical performance of the former by using in Li-ion batteries and supercapacitors has been proved including higher initial discharge capacity (1445.1 mA h g−1 at 0.2 A g−1) and initial specific capacitance (761.3 F g−1 at 2 A g−1), and more advanced capacity retention (∼860.0 mA h g−1 after 40 cycles at 0.2 A g−1, and ∼330.0 F g−1 after 3000 cycles at 12 A g−1).

1. Introduction

Various binary transition-metal oxides – AB2O4 (e.g. MnCo2O4,1–3 CoMn2O4,4,5 ZnCo2O4,6,7 NiCo2O4,8–10 et al.) have been researched as potential materials for electrochemical energy storage systems such as supercapacitors (SCs) and Li-ion batteries (LIBs).11–13 Remarkably, among them, these materials with the yolk–shell-structure, which is a special class of core–shell structure with a distinctive configuration including interior core, void space and permeable outer shell, have received much attention due to their well-defined interior voids and the accommodate volume change.14–17 For example, prepared by the spray pyrolysis, spherical yolk–shell ZnCo2O4 (∼500 nm) delivers a discharge capacity of 753 mA h g−1 after 200 cycles at 3 A g−1,18 and uniform yolk–shelled ZnCo2O4 microspheres (0.8–1.2 μm) show a discharge capacity of 331 mA h g−1 after 500 cycles at 1 A g−1;7 produced by the thermal treatment with a heating ramp of 7 °C min−1, hollow MnCo2O4 submicrospheres with yolk-in-double–shell structure possess a discharge capacity of about 800 mA h g−1 after 100 cycles at 0.4 A g−1;19 and the spherical yolk–shell and hollow CoMn2O4 powders synthesized by continuous spray pyrolysis have a high discharge capacity of 573 mA h g−1 after 40 cycles at 0.8 A g−1.20 However, there is almost not interior elemental analysis of the AB2O4 sphere to prove whether the concentration gradient exists.

On the other hand, the concentration gradient of electronic materials is one of the crucial factors to impact its property.21–23 For sentence, spherical Li1.13[Mn0.534Ni0.233Co0.233]0.87O2 with concentration gradient delivers a high capacity retention ratio of 97.2% after 100 cycles at 0.5 C;24 spherical concentration-gradient LiMn1.87Ni0.13O4 delivers a discharge capacity of 108.2 mA h g−1 with a retention of 90.2% after 200 cycles at 0.5 C;25 and the Li[Ni0.8Co0.2]O2 spheres with manganese-rich concentration-gradient shells show a high capacity of 200 mA h g−1 after 50 cycles at 0.2 C.26 So the concentration-gradient electronic materials maybe possess a more significant structural stability during cycling than other ordinary ones.27 However, very few reports have been published on the binary transition-metal oxides with concentration gradient for LIBs and SCs, and almost no research has been reported about the relationship between the yolk–shell structure and concentration gradient.

Herein, by using facile hydrothermal method followed by thermal treatment, a novel spherical MnCo2O4 material with desired yolk–shell-structure was synthesized successfully. As a contrast, another similar material without yolk–shell-structure was also designed, and their distinct electrochemical performance was compared. In addition, the relationship between the yolk–shell structure and concentration gradient was studied. As a result, due to the special concentration gradient in the yolk–shell MnCo2O4 sphere, this material exhibited superior electrochemical performance.

2. Experimental section

2.1 Preparation of samples

Sample 1. All reagents are the analytical grade without further purification. Mn(CH3COO)2·4H2O (0.409 g), Co(CH3COO)2·4H2O (0.830 g), CO(NH2)2 (1.500 g) and C12H25SO4Na (sodium dodecyl sulfate, SDS, 0.050 g) were dissolved orderly in deionized water under vigorous stirring to obtain 100 mL transparent solution. It was then transferred into a Teflon-lined stainless steel autoclave (140 mL), and a thermal treatment was performed for the sealed autoclave in an electric oven at 180 °C for 12 h. After reaction, the pink powders as the precursor in the autoclave were collected and washed by deionized water and pure ethanol before being dried in a vacuum oven at 60 °C for 24 h. Then, another thermal treatment was performed in air at 800 °C for 10 h with a heating ramp of 2 °C min−1. Then, the black powders as the product were collected.
Sample 2. As a contrast, another product was prepared by using more dosage of CO(NH2)2 (6.000 g), and other operations were as the exact same as the above preparation of Sample 1.

2.2 Characterization of samples

The crystal structure was characterized by X-ray powder diffraction (XRD) (CuKα radiation, Bruker, D8 Advance). The particle sizes and distributions were analyzed by the laser particle size analyzer (Malvern 2000, measurement range: 0.01–1000 μm). The specific surface area and pore size distribution were calculated by the specific surface area and porosity analyzer (Micromeritics, Gemini VII 2390). The micro morphologies were observed by scanning electron microscope (SEM) (JEOL, JSM 5500) and transmission electron microscope (TEM) (JEOL, JSM 2011 and FEI, Tecnai G2 F20). To observe the internal morphology and determine the local composition of as-prepared particles directly, the particles were firstly embedded in a resin and cut by a diamond knife on an optical microscope under the ultramicrotome (Leica, Lecia EM UC6), then the elemental analysis of sections were characterized by energy dispersive X-ray spectrometer (EDX) equipped on the SEM device (JEOL, JSM 5500).

2.3 Electrochemical measurements

The electrochemical performance of MnCo2O4 powders was evaluated by both in coin cells and in a three-electrode configuration. One of working electrode was composed of MnCo2O4, acetylene black (ATB) and polytetrafluoroethylene (PTFE) with a weight ratio of MnCo2O4/ATB/PTFE = 7[thin space (1/6-em)]:[thin space (1/6-em)]2[thin space (1/6-em)]:[thin space (1/6-em)]1 (lithium metal as the reference electrode), and its specific capacity was measured in the range of 0.01–3.00 V (vs. Li+/Li) at 25 °C by electrochemical test instrument (Land, CT2001A). The other one was composed of pure MnCo2O4 powders with the electrolyte of KOH (1 mol L−1) aqueous solution in a three-electrode configuration (saturated Ag/AgCl as the reference electrode and Pt sheet as the counter electrode), and its specific capacitance was measured in the range of −0.10 to 0.30 V (vs. Ag/AgCl) at 25 °C by electrochemical workstation (CH Instruments, CHI 660E).

3. Results and discussion

The X-ray powder diffraction (XRD) patterns of precursors are shown in Fig. 1. Both of the diffraction patterns are indexed as a mixture of hexagonal CoCO3 (JCPDS no. 78-0209) and hexagonal MnCO3 (JCPDS no. 85-1109), exhibiting good crystallinity. And the size distributions of precursors are shown in Fig. 2. The final average grain diameter of Sample 1 is about 2.24 μm (Fig. 2a), while Sample 2's is about 1.93 μm (Fig. 2b). Both of them deliver narrow size distributions (more than 95% in the range of 1.00–4.00 μm). The scanning electron microscope (SEM) micrographs of precursors in Fig. 3a–d indicate that both of them are regular mono-dispersed microspheres with the diameters of 2.00–3.00 μm (almost as the same as each other). However, their transmission electron microscope (TEM) micrographs in Fig. 3e and f show the difference of them: the Sample 1's precursor microsphere exhibits core–shell structure (the size of shell is about 200 nm, much smaller than the size of core) (Fig. 3e), while the Sample 2's does not exhibit this phenomenon (Fig. 3f).
image file: c5ra24098k-f1.tif
Fig. 1 XRD patterns of precursors.

image file: c5ra24098k-f2.tif
Fig. 2 Size distributions of precursors.

image file: c5ra24098k-f3.tif
Fig. 3 (a)–(d) SEM and (e)–(f) TEM images of precursors. (a), (c) and (e) Sample 1; (b), (d) and (f) Sample 2.

Furthermore, to observe the internal morphology and determine the local composition of as-prepared precursors directly, both of particles were firstly embedded in a resin and cut by a diamond knife, and then the elemental analysis of microspheres' sections was characterized by energy dispersive X-ray spectrometer (EDX) equipped on the SEM device. The SEM micrograph and the corresponding EDX mapping images of the cross-section of the Sample 1's precursor microsphere are shown in Fig. 4a–d. The EDX mapping image of Fig. 4c clearly indicates that the concentration of Co in the shell (the thickness of ∼200 nm) is higher than in the core. In contrast, the Mn concentration in the shell is lower than in the core (Fig. 4d). In Fig. 4e, the curve of atomic ratio (Co[thin space (1/6-em)]:[thin space (1/6-em)]Mn) versus the distance from the particle centre to the edge of the corresponding line in Fig. 4a confirms the above observation of Co and Mn EDX mapping results that the Sample 1's precursor microsphere possesses shell to core concentration gradient. And the representative EDX spectra (Fig. S1a and S1b) show an increase in the Co[thin space (1/6-em)]:[thin space (1/6-em)]Mn atomic ratio from 1.67[thin space (1/6-em)]:[thin space (1/6-em)]1 for the core to 2.63[thin space (1/6-em)]:[thin space (1/6-em)]1 for the shell. As a contrast, the SEM micrograph and the corresponding EDX mapping images of the cross-section of the Sample 2's precursor microsphere are shown in Fig. 5a–d. The EDX mapping images of Fig. 5c and d clearly indicate that both of concentration distributions of Co and Mn are uniform without gradient. In Fig. 5e, the curve of atomic ratio (Co[thin space (1/6-em)]:[thin space (1/6-em)]Mn) versus the distance from the particle centre to the edge of the corresponding line in Fig. 5a proves the above observation of Co and Mn EDX mapping results again. And the representative EDX spectrum (Fig. S2) indicates the Co[thin space (1/6-em)]:[thin space (1/6-em)]Mn atomic ratio is about 2.01[thin space (1/6-em)]:[thin space (1/6-em)]1, which matches well with the theoretical value.


image file: c5ra24098k-f4.tif
Fig. 4 (a) SEM image and (b)–(d) the corresponding EDX mapping images of the cross section of the Sample 1's precursor. (e) Atomic ratio (Co[thin space (1/6-em)]:[thin space (1/6-em)]Mn) as a function of the distance from the particle centre to the edge of the corresponding line in (a).

image file: c5ra24098k-f5.tif
Fig. 5 (a) SEM image and (b)–(d) the corresponding EDX mapping images of the cross section of the Sample 2's precursor. (e) Atomic ratio (Co[thin space (1/6-em)]:[thin space (1/6-em)]Mn) as a function of the distance from the particle centre to the edge of the corresponding line in (a).

In this reaction system, the concentrations of metal salts impact the size of particles,28 and the type of surfactant (SDS) controls the morphology of particles (spherical shape),29 and the amount of CO(NH2)2 dominates whether to make a concentration gradient. When the amount of CO(NH2)2 is fair like the preparation of Sample 1, the pH of the reaction system increases slowly through the hydrolysis of CO(NH2)2 during the reaction [eqn (1)], leading to different precipitation rates of CoCO3 and MnCO3 [eqn (2) and (3), respectively] and hence the formation of concentration gradient in the precursor (mixture of CoCO3 and MnCO3). However, when the amount of CO(NH2)2 is too much like the preparation of Sample 2, the hydrolysis of CO(NH2)2 increases quickly and the pH of the reaction system goes up sharply to be strong alkaline during the reaction [eqn (1)], leading to the rapid precipitation of CoCO3 and MnCO3 and the formation of a uniform mixture.

 
CO(NH2)2+ 2H2O → 2NH4+ + CO32− (1)
 
Mn2+ + CO32− → MnCO3 (2)
 
Co2+ + CO32− → CoCO3 (3)

After thermal treatment, both of final products' diffraction patterns match well with the standard diffraction patterns of cubic phase MnCo2O4 (JCPDS no. 23-1237), exhibiting good crystallinity and purity (Fig. 6). From the data obtained by Brunauer–Emmett–Teller (BET) nitrogen adsorption isotherms (Fig. S3a and S3b), the specific surface areas of Sample 1 and Sample 2 are calculated to be about 68.40 m2 g−1 and 64.52 m2 g−1, respectively. Meanwhile, in Fig. 7a and b, their average pore sizes are similar (11.69 nm and 11.78 nm, respectively), and both of the size distributions are very narrow (more than 98% in the range of 5.00–15.00 nm), calculated by Barrett–Joyner–Halenda (BJH) method (Fig. S4a and S4b). The SEM micrographs of as-prepared MnCo2O4 in Fig. 8a–d show both regular spherical shape and porous structure, similar to the morphology and size of the corresponding precursors (Fig. 8a and c, Sample 1; Fig. 8b and d, Sample 2). All the micro-scale spheres are built up by irregular nanoparticles attached to each other as our previous research.30,31 However, the SEM micrographs of the Sample 1 microspheres with broken shells clearly indicate that all of them exhibit yolk–shell structure, inheriting the special core–shell structure of the corresponding precursor (Fig. 9). Remarkably, the corresponding TEM micrographs (Fig. 10a–d) are further shown the difference between Sample 1 and Sample 2. On the one hand, the yolk–shell structures of Sample 1's MnCo2O4 microspheres are shown clearly again in Fig. 10a and c. And the thickness of the shell is about 200 nm from the high resolution TEM micrograph in Fig. S5. On the other hand, the Sample 2 microspheres are uniform without any layered phenomenon (Fig. 10b and d). As shown by the selected area electron diffraction (SAED) patterns in Fig. 10e and f, both of the synthesized MnCo2O4 samples are polycrystalline with clear diffraction rings. The lattice fringes with lattice spacings of 0.29 nm and 0.48 nm agree well with (220) and (111) crystal planes of cubic phase MnCo2O4 shown by the high-resolution transmission electron microscope (HRTEM) micrographs (Fig. 10g, Sample 1; Fig. 10h, Sample 2).


image file: c5ra24098k-f6.tif
Fig. 6 XRD patterns of MnCo2O4 samples.

image file: c5ra24098k-f7.tif
Fig. 7 BJH pore-size distributions of MnCo2O4 samples.

image file: c5ra24098k-f8.tif
Fig. 8 SEM images of MnCo2O4 samples. (a) and (c) Sample 1; (b) and (d) Sample 2.

image file: c5ra24098k-f9.tif
Fig. 9 SEM images of Sample 1 microspheres with broken shells.

image file: c5ra24098k-f10.tif
Fig. 10 (a) and (c) TEM images, (e) SEAD pattern and (g) HRTEM image of Sample 1; (b) and (d) TEM images, (f) SEAD pattern and (h) HRTEM image of Sample 2.

To determine the local composition of as-prepared samples further and compare with the precursors directly, both of the elemental analysis of MnCo2O4 microspheres' sections was also characterized. The SEM micrograph and the corresponding EDX mapping images of the cross-section of the Sample 1 microsphere are shown in Fig. 11a–d. The SEM micrograph clearly delivers the yolk–shell structure of the hemisphere including interior core, crack and thin outer shell (Fig. 11a). As same as the result of Sample 1's precursor, the EDX mapping image of Fig. 11c clearly indicates that the concentration of Co in the shell is higher than in the core, while the Mn concentration in the shell is lower than in the core (Fig. 11d). In addition, the curve of atomic ratio (Co[thin space (1/6-em)]:[thin space (1/6-em)]Mn) versus the distance from the particle centre to the edge of the corresponding line in Fig. 11a confirms again that the Sample 1 microsphere possesses shell to core concentration gradient in Fig. 11e. And the representative EDX spectra (Fig. S6a and S6b) show an increase in the Co[thin space (1/6-em)]:[thin space (1/6-em)]Mn atomic ratio from 1.65[thin space (1/6-em)]:[thin space (1/6-em)]1 for the core to 2.61[thin space (1/6-em)]:[thin space (1/6-em)]1 for the shell. As a contrast, the SEM micrograph and the corresponding EDX mapping images of the cross-section of the Sample 2 microsphere are shown in Fig. 12a–d. The EDX mapping images of Fig. 12c and d clearly show that both of concentration distributions of Co and Mn are also uniform without gradient as its precursor. In Fig. 12e, the curve of atomic ratio (Co[thin space (1/6-em)]:[thin space (1/6-em)]Mn) versus the distance from the particle centre to the edge of the corresponding line in Fig. 12a proves the above results again. And the representative EDX spectrum (Fig. S7) indicates the Co[thin space (1/6-em)]:[thin space (1/6-em)]Mn atomic ratio is a constant. Interestingly, both of the two samples' concentration values are close to the values of their precursors, indicating minimal change in chemical composition and micro-reaction of ions from core to shell during the thermal treatment [eqn (4)].32–34 In addition, the striking feature of the SEM micrograph (Fig. 11a) is the presence of a crack separating the core from the shell of distinct chemical compositions. This crack maybe formed as a result of uneven chemical composition and stress distribution during thermal conversion of the Sample 1's precursor.

 
O2 + 2MnCO3+ 4CoCO3 → 2MnCo2O4 + 6CO2 (4)


image file: c5ra24098k-f11.tif
Fig. 11 (a) SEM image and (b)–(d) the corresponding EDX mapping images of the cross section of Sample 1. (e) Atomic ratio (Co[thin space (1/6-em)]:[thin space (1/6-em)]Mn) as a function of the distance from the particle centre to the edge of the corresponding line in (a).

image file: c5ra24098k-f12.tif
Fig. 12 (a) SEM image and (b)–(d) the corresponding EDX mapping images of the cross section of Sample 2. (e) Atomic ratio (Co[thin space (1/6-em)]:[thin space (1/6-em)]Mn) as a function of the distance from the particle centre to the edge of the corresponding line in (a).

On the one hand, the electrochemical performance of the synthesized MnCo2O4 samples was evaluated by using coin cells with lithium metal as the reference electrodes. The representative discharge and charge profiles of MnCo2O4 samples in the range of 0.01–3.00 V at 0.2 A g−1 are shown in Fig. 13a and Fig. 13b. All of the discharge and charge curves are similar change trends: in the discharge curve, the potential value slowly falls to the cut-off voltage (0.01 V); in the charge curve, the potential value gradually goes up to the top voltage (3.00 V). Due to the differences of interior structure of particles, the discharge/charge capacities of Sample 2 decreased more quickly than the Sample 1's form the first cycle to the 40th cycle. The cycling performance of MnCo2O4 anodes in the range of 0.01–3.00 V at 0.2 A g−1 with 40 cycles is shown in Fig. 13c. The initial discharge and charge capacities of Sample 1 are 1445.1 mA h g−1 and 855.7 mA h g−1, respectively; while the initial discharge and charge capacities of Sample 2 are 1354.2 mA h g−1 and 819.3 mA h g−1, respectively. Such discharge/charge characteristics correspond to an irreversible capacity loss ratio of about 40%, which is typical for such type of anodes and may arise from the formation of irreversible SEI film during the first discharge cycle.30,35,36 In the subsequent cycles, the discharge/charge capacities of Sample 1 tend to be stable, and exhibit a similar electrochemical behavior with approximate reversible capacities of 900.0–940.0 mA h g−1 before the 30th cycle. Further prolonged discharge/charge cycling lead to steady decrease in the reversible capacity to ∼860.0 mA h g−1 at the 40th cycle. More interestingly, its capacities of the previous cycles from the 2nd cycle to the 18th cycle increase slowly and gradually, and the maximum discharge capacities could reach up to 943.7 mA h g−1, which may be likely that Li-ion diffusion is activated and stabilized gradually during cycling as our previous reports.31 In comparison, the reversible capacity of Sample 2 goes down slowly to 608.7 mA h g−1 at the 30th cycle, corresponding to a capacity retention ratio (versus the second discharge capacity) of about 68.9%, and further discharge/charge cycling from the 30th cycle to the 40th cycle lead to rapid decrease to 436.3 mA h g−1. To further investigate the rate capability, the MnCo2O4 electrodes were tested at various current densities between 0.2 A g−1 and 0.8 A g−1 shown in Fig. 13d. The discharge capacities of Sample 1 are about 800–730 mA h g−1 (except the first cycle), ∼550 mA h g−1 and ∼260 mA h g−1 at 0.4 A g−1, 0.6 A g−1 and 0.8 A g−1, respectively. Although the material exhibits low values at large current density (0.8 A g−1), it can regain to deliver a fair discharge capacity (520–540 mA h g−1) when the current density turns back to 0.2 A g−1 after 30 cycles. In comparison, the discharge capacities of Sample 2 are 700–650 mA h g−1 (except the first cycle), ∼266 mA h g−1 and ∼85 mA h g−1 at 0.4 A g−1, 0.6 A g−1 and 0.8 A g−1, respectively. And when the current density turns back to 0.2 A g−1, the discharge capacity is still very low (∼330 mA h g−1). Therefore, these results clearly illustrate that the yolk–shell MnCo2O4 microspheres with concentration gradient are of higher reversible capacity, more advanced capacity retention and better rate performance than the uniform ones. In addition, some of the capacities as above are larger than the theoretical total capacity of MnCo2O4 (691.0 mA h g−1). There are two possible reasons contributing to the additional reversible capacity: (1) the reversible side reactions of Mn2+ to Mn3+ or even to Mn4+;37,38 and (2) the reversible formation/dissolution of the polymer/gel-like film besides the electrochemical conversion reaction between metal oxides and metals.39,40 The SEM images of MnCo2O4 electrodes (mixtures of MnCo2O4/ATB/PVDF) after 40 cycles at 0.2 A g−1 are added as Fig. 14 and Fig. S8. The basic spherical morphology of Sample 1 is still remained in Fig. 14a. As a contrast, some micro spheres of Sample 2 break down obviously in Fig. 14b. And through the SEM images of the cross section of Sample 1 after discharge/charge process (Fig. S8), the clear core–shell structure and the visible crack of Sample 1 are still maintained. It indicates that the structure of the former is steadier than the latter's, which can be one of reasons for its good cycling performance.


image file: c5ra24098k-f13.tif
Fig. 13 (a) and (b) Discharge and charge profiles of MnCo2O4 electrodes in the range of 0.01–3.00 V at 0.2 A g−1; (c) cycling performance of MnCo2O4 electrodes through coin cells in the range of 0.01–3.00 V at 0.2 A g−1; (d) rate capability of MnCo2O4 electrodes at various current densities.

image file: c5ra24098k-f14.tif
Fig. 14 SEM images of MnCo2O4 electrodes (mixtures of MnCo2O4/ATB/PVDF) after 40 cycles at 0.2 A g−1. (a) Sample 1 and (b) Sample 2.

On the other hand, the electrochemical performance of MnCo2O4 samples for SCs was investigated through three-electrode configuration. It is shown that the relationship between the specific capacitance and the current density in Fig. 15a. The specific capacitances of Sample 1 are 761.3 F g−1, 725.4 F g−1, 422.6 F g−1, 307.2 F g−1, 234.5 F g−1 and 229.8 F g−1 at 2 A g−1, 4 A g−1, 8 A g−1, 12 A g−1, 20 A g−1 and 24 A g−1, respectively; while the specific capacitances of Sample 2 are 697.2 F g−1, 467.0 F g−1, 361.4 F g−1, 261.3 F g−1, 200.5 F g−1 and 185.4 F g−1 at the same conditions, respectively. And the galvanostatic charge–discharge curves of MnCo2O4 electrodes at various current densities are shown in Fig. S9. As the increase of the current density, both of the specific capacitances decreases quickly, especially at the high current density such as 20 A g−1 and 24 A g−1, which may be ascribed to the increase of the internal diffusion resistance within the active material.41 However, the specific capacitance of Sample 1 is much larger than the sample 2's at the same condition, and the specific capacitance retention ratio of the former is also bigger than the latter's, showing the better rate property of the yolk–shell MnCo2O4 with concentration gradient again. To further investigate the cycle performance, both of pure MnCo2O4 electrodes were tested in the range of −0.10 to 0.30 V at 12 A g−1 with 3000 cycles shown in Fig. 15b. At first, the specific capacitance of Sample 1 increases slowly from ∼310.0 F g−1 to ∼330.0 F g−1 at the first 500 cycles. Then, the specific capacitance keep a stable value between 330 F g−1 and 320 F g−1 till the 3000th cycle, almost without degrading. In comparison, the cycle performance curve of Sample 2 delivers a similar change tendency: its specific capacitance increases to ∼270.0 F g−1 at the first 500 cycles, and keep a stable value between 270 F g−1 and 275 F g−1 till the 3000th cycle. As you see, both of them show perfect specific capacitance retention, but the specific capacitance of Sample 1 is still much larger than Sample 2's. Fig. S10 shows the discharge and charge profiles of the representative first 10 cycles in the voltage range of −0.10 to 0.30 V (vs. Ag/AgCl) at 12 A g−1. The shapes of the charge/discharge curves (Fig. S10a and S10b) are both almost unchanged during the whole process, suggesting that both of MnCo2O4 microspheres are very suitable for SC applications.42,43 Basically, the void space between the core and the shell may improve the stability during cycling by buffering the structural strain arising from the ions insertion/extraction.44–48 That is one of possible reasons to explain the superior performance of such yolk–shell MnCo2O4 microspheres with concentration gradient.


image file: c5ra24098k-f15.tif
Fig. 15 (a) Specific capacitance of the MnCo2O4 electrode as a function of current density; (b) cycle performance of MnCo2O4 electrodes with three-electrode configuration in the range of −0.10 to 0.30 V at 12 A g−1.

4. Conclusions

In summary, through hydrothermal method followed by thermal treatment, novel spherical yolk–shell MnCo2O4 powders with concentration gradient have been synthesized. The porous microspheres with yolk–shell-structure (2.00–3.00 μm in average diameter, ∼200 nm in thickness of shell) are built up by irregular nanoparticles attached to each other. The specific surface area is ∼64.50 m2 g−1 and the average pore size is ∼12.00 nm. It is shown that the formation of yolk–shell structure may be induced by the core–shell concentration gradient. And the Co[thin space (1/6-em)]:[thin space (1/6-em)]Mn atomic ratios of core and shell are about 1.65[thin space (1/6-em)]:[thin space (1/6-em)]1 and 2.61[thin space (1/6-em)]:[thin space (1/6-em)]1, respectively, inheriting the special elemental composition of the precursor (mixture of CoCO3 and MnCO3). Interestingly, a similar uniform spherical MnCo2O4 without concentration gradient and yolk–shell structure prepared as a contrast, the superior electrochemical performance of yolk–shell spherical MnCo2O4 with concentration gradient by using in LIBs and SCs has been proved including higher initial discharge capacity (1445.1 mA h g−1 at 0.2 A g−1) and initial specific capacitance (761.3 F g−1 at 2 A g−1), more advanced capacity retention (∼560.0 mA h g−1 after 50 cycles at 0.2 A g−1, and ∼330.0 F g−1 after 3000 cycles at 12 A g−1) and better rate performance (520.0–540.0 mA h g−1 at 0.2 A g−1 after 30 cycles during different large current densities).

Acknowledgements

This work was supported by the National Natural Science Foundation of China (Grant No. 51274130 and 51074096) and the program for Changjiang Scholars and Innovative Research Team in University (IRT13026).

Notes and references

  1. L. Li, Y. Q. Zhang, X. Y. Liu, S. J. Shi, X. Y. Zhao, H. Zhang, X. Ge, G. F. Cai, C. D. Gu, X. L. Wang and J. P. Tu, Electrochim. Acta, 2014, 116, 467 CrossRef CAS.
  2. Y. W. Zhang, X. Y. Wang, Q. L. Zhao, Y. Q. Fu, H. Wang and H. B. Shu, Electrochim. Acta, 2015, 180, 866 CrossRef CAS.
  3. J. G. Kim, Y. Kim, Y. Noh and W. B. Kim, ChemSusChem, 2015, 8, 1752 CrossRef CAS PubMed.
  4. L. Hu, H. Zhong, X. Zheng, Y. Huang, P. Zhang and Q. Chen, Sci. Rep., 2012, 2, 986 Search PubMed.
  5. L. Wang, B. Liu, S. Ran, L. Wang, L. Gao, F. Qu, D. Chen and G. Shen, J. Mater. Chem. A, 2013, 1, 2139 CAS.
  6. Y. Sharma, N. Sharma, G. V. S. Rao and B. V. R. Chowdari, Adv. Funct. Mater., 2007, 17, 2855 CrossRef CAS.
  7. J. Li, J. Wang, D. Wexler, D. Shi, J. Liang, H. Liu, S. Xiong and Y. Qian, J. Mater. Chem. A, 2013, 1, 15292 CAS.
  8. G. Zhang and X. W. Lou, Adv. Mater., 2013, 25, 976 CrossRef CAS PubMed.
  9. S. Chen and S. Z. Qiao, ACS Nano, 2013, 7, 10190 CrossRef CAS PubMed.
  10. L. Hu, L. Wu, M. Liao, X. Hu and X. Fang, Adv. Funct. Mater., 2012, 22, 998 CrossRef CAS.
  11. T. R. Paudel, A. Zakutayev, S. Lany, M. D. Avezac and A. Zunger, Adv. Funct. Mater., 2011, 21, 4493 CrossRef CAS.
  12. F. M. Courtel, H. Duncan, Y. A. Lebdeh and I. J. Davidson, J. Mater. Chem., 2011, 21, 10206 RSC.
  13. J. Li, S. Xiong, X. Li and Y. Qian, Nanoscale, 2013, 5, 2045 RSC.
  14. K. M. Yang, Y. N. Ko, J. Y. Yun and Y. C. Kang, Chem.–Asian J., 2014, 9, 443 CrossRef CAS PubMed.
  15. Y. J. Hong, M. Y. Son, B. K. Park and Y. C. Kang, Small, 2013, 9, 2224 CrossRef CAS PubMed.
  16. Y. J. Hong, M. Y. Son and Y. C. Kang, Adv. Mater., 2013, 25, 2279 CrossRef CAS PubMed.
  17. Z. Teng, S. Wang, X. Su, G. Chen, Y. Liu, Z. Luo, W. Luo, Y. Tang, H. Ju, D. Zhao and G. Lu, Adv. Mater., 2014, 26, 3741 CrossRef CAS PubMed.
  18. S. H. Choi and Y. C. Kang, ChemSusChem, 2013, 6, 2111 CrossRef CAS PubMed.
  19. J. Li, J. Wang, X. Liang, Z. Zhang, H. Liu, Y. Qian and S. Xiong, ACS Appl. Mater. Interfaces, 2014, 6, 24 CAS.
  20. M. H. Kim, Y. J. Hong and Y. C. Kang, RSC Adv., 2013, 3, 13110 RSC.
  21. W. Yang, Z. Gao, J. Ma, X. Zhang, J. Wang and J. Liu, J. Mater. Chem. A, 2014, 2, 1448 CAS.
  22. Y. K. Sun, B. R. Lee, H. J. Noh, H. Wu, S. T. Myung and K. Amine, J. Mater. Chem., 2011, 21, 10108 RSC.
  23. S. K. Jung, H. Gwon, J. Hong, K. Y. Park, D. H. Seo, H. Kim, J. Hyun, W. Yang and K. Kang, Adv. Energy Mater., 2014, 4, 1300787 Search PubMed.
  24. X. Yang, X. Wang, G. Zou, L. Hu, H. Shu, S. Yang, L. Liu, H. Hu, H. Yuan, B. Hu, Q. Wei and L. Yi, J. Power Sources, 2013, 232, 338 CrossRef CAS.
  25. Q. Wei, X. Wang, X. Yang, B. Ju, B. Hu, H. Shu, W. Wen, M. Zhou, Y. Song, H. Wu and H. Hu, J. Mater. Chem. A, 2013, 1, 4010 CAS.
  26. Y. K. Sun, D. H. Kim, C. S. Yoon, S. T. Myung, J. Prakash and K. Amine, Adv. Funct. Mater., 2010, 20, 485 CrossRef CAS.
  27. Y. K. Sun, Z. Chen, H. J. Noh, D. J. Lee, H. G. Jung, Y. Ren, S. Wang, C. S. Yoon, S. T. Myung and K. Amine, Nat. Mater., 2012, 11, 942 CrossRef CAS PubMed.
  28. G. Y. Huang, S. M. Xu, G. Xu, L. Y. Li and L. F. Zhang, Trans. Nonferrous Met. Soc. China, 2009, 19, 389 CrossRef CAS.
  29. G. Y. Huang, S. M. Xu, Y. Yang, H. Y. Sun, Z. B. Li, Q. Chen and S. S. Lu, Mater. Lett., 2014, 131, 236 CrossRef CAS.
  30. G. Y. Huang, S. M. Xu, S. S. Lu, L. Y. Li and H. Y. Sun, Electrochim. Acta, 2014, 135, 420 CrossRef CAS.
  31. G. Y. Huang, S. M. Xu, S. S. Lu, L. Y. Li and H. Y. Sun, ACS Appl. Mater. Interfaces, 2014, 6, 7236 CAS.
  32. K. Du, C. Hua, C. Tan, Z. Peng, Y. Cao and G. Hu, J. Power Sources, 2014, 263, 203 CrossRef CAS.
  33. P. Rai, J. W. Yoon, H. M. Jeong, S. J. Hwang, C. H. Kwak and J. H. Lee, Nanoscale, 2014, 6, 8292 RSC.
  34. Y. Ye, L. Kuai and B. Geng, J. Mater. Chem., 2012, 22, 19132 RSC.
  35. C. T. Cherian, J. Sundaramurthy, M. V. Reddy, P. S. Kumar, K. Mani, D. Pliszka, C. H. Sow, S. Ramakrishna and B. V. R. Chowdari, ACS Appl. Mater. Interfaces, 2013, 5, 9957 CAS.
  36. L. Huang, D. Chen, Y. Ding, S. Feng, Z. L. Wang and M. Liu, Nano Lett., 2013, 13, 3135 CrossRef CAS PubMed.
  37. P. S. Arun, B. P. Ranjith and S. M. A. Shibli, Environ. Sci. Technol., 2013, 47, 2746 CrossRef CAS PubMed.
  38. L. Yu, L. Zhang, H. B. Wu, G. Zhang and X. W. Lou, Energy Environ. Sci., 2013, 6, 2664 CAS.
  39. X. Xia, J. Tu, Y. Zhang, X. Wang, C. Gu, X. B. Zhao and H. J. Fan, ACS Nano, 2012, 6, 5531 CrossRef CAS PubMed.
  40. Q. Hao, D. Y. Zhao, H. M. Duan and C. X. Xu, ChemSusChem, 2015, 8, 1435 CrossRef CAS PubMed.
  41. X. C. Dong, H. Xu, X. W. Wang, Y. X. Huang, M. B. C. Park, H. Zhang, L. H. Wang, W. Huang and P. Chen, ACS Nano, 2012, 6, 3206 CrossRef CAS PubMed.
  42. W. Yang, Z. Gao, J. Ma, X. Zhang, J. Wang and J. Liu, J. Mater. Chem. A, 2014, 2, 1448 CAS.
  43. L. Huang, D. Chen, Y. Ding, S. Feng, Z. L. Wang and M. Liu, Nano Lett., 2013, 13, 3135 CrossRef CAS PubMed.
  44. Y. Liu, W. Zhang, S. Li, C. Cui, J. Wu, H. Chen and F. Huo, Chem. Mater., 2014, 26, 1119 CrossRef CAS.
  45. S. H. Choi and Y. C. Kang, Small, 2014, 10, 474 CrossRef CAS PubMed.
  46. X. Liu, S. Shi, Q. Xiong, L. Li, Y. Zhang, H. Tang, C. Gu, X. Wang and J. Tu, ACS Appl. Mater. Interfaces, 2013, 5, 8790 CAS.
  47. S. Bai, M. Cao, Y. Jin, X. Dai, X. Liang, Z. Ye, M. Li, J. Cheng, X. Xiao, Z. Wu, Z. Xia, B. Sun, E. Wang, Y. Mo, F. Gao and F. Zhang, Adv. Energy Mater., 2014, 4, 1301460 Search PubMed.
  48. G. Y. Huang, S. M. Xu, Z. H. Xu, H. Y. Sun and L. Y. Li, ACS Appl. Mater. Interfaces, 2014, 6, 21325 CAS.

Footnote

Electronic supplementary information (ESI) available: (Fig. S1) Representative EDX spectra in Fig. 4a; (Fig. S2) representative EDX spectrum in Fig. 5a; (Fig. S3) N2 adsorption isotherms of MnCo2O4 samples; (Fig. S4) N2 adsorption/desorption isotherms of MnCo2O4 samples; (Fig. S5) TEM image of partial enlarged detail of Sample 1 microsphere; (Fig. S6) representative EDX spectra in Fig. 11a; (Fig. S7) representative EDX spectrum in Fig. 12a; (Fig. S8) SEM images of the cross section of Sample 1 after 40 cycles at 0.2 A g−1; (Fig. S9) galvanostatic charge–discharge curves of MnCo2O4 electrodes at various current densities; (Fig. S10) first ten galvanostatic charge–discharge curves of MnCo2O4 electrodes in the range of −0.10 to 0.30 V at 12 A g−1. See DOI: 101039/c5ra24098k

This journal is © The Royal Society of Chemistry 2016