
Functionalized porous carbon with appropriate pore size distribution and open hole texture prepared by H2O2 and EDTA-2Na treatment of loofa sponge and its excellent performance for supercapacitors
Xiaoxiang Yang,
Min Li,
Nannan Guo,
Ming Yan,
Ru Yang* and
Feng Wang
State Key Laboratory of Chemical Resource Engineering, Beijing Key Laboratory of Electrochemical Process and Technology for Materials, Beijing University of Chemical Technology, Beijing 100029, China. E-mail: ruyang@mail.buct.edu.cn; Fax: +86 10 64436736; Tel: +86 10 64436736
First published on 22nd December 2015
Abstract
Activated porous carbon sheets, which have an appropriate pore size distribution and open hole texture, were prepared via the H2O2 and EDTA-2Na pre-treatment of a easily available biomass loofa sponge (LS) followed by carbonization and KOH-activation, and were employed as supercapacitor electrodes. Interestingly, it was observed that the specific surface area, surface heteroatoms content, and pore size distribution of the porous carbon were affected by the H2O2 and EDTA-2Na pre-treatment and KOH/C ratio. As the KOH/C ratio increased, the porosity development was broadened quickly and considerably under the micropore and a smaller mesopore within the range of 0.7–2.7 nm was obtained, indicating that there are no dividing walls among the variable sized pore framework and that an opened and interconnected channel texture was formed. The prepared hierarchical activated carbon possesses a high specific surface area (2402 m2 g−1) with reasonable pore size distributions and hence exhibits a good energy storage performance and high cycling stability. The supercapacitor based on LSAC-3, which was synthesized with the alkali to LSC ratio of 3, displays a remarkable electrochemical performance with a substantially high specific capacitance (up to 499 F g−1 at 0.1 A g−1) in 6 M KOH electrolyte, good rate capability (with a specific capacitance of 303 F g−1 at 10 A g−1), and extraordinary cycling stability (only 8.7% capacitance loss over 10![[thin space (1/6-em)]](https://www.rsc.org/images/entities/char_2009.gif) 000 cycles at 5 A g−1). Moreover, the as-assembled symmetric supercapacitor delivers high gravimetric energy density of 25.3 W h kg−1 in 1 M SBP-BF4/AN electrolyte.
000 cycles at 5 A g−1). Moreover, the as-assembled symmetric supercapacitor delivers high gravimetric energy density of 25.3 W h kg−1 in 1 M SBP-BF4/AN electrolyte.
Introduction
Electrochemical capacitors (EC), which are also known as supercapacitors (SC), are recognized as an important type of energy storage and supply device because of their high power density, maintenance-free long-life operation, quick charge–discharge rate, and environmentally friendly energy technology.1 The key performance parameters of supercapacitors include specific capacitance (normalized by electrode mass, volume, or area), energy density, power density, rate capability (retained capacitance at a high current loading) and cycling stability.2 Compared with batteries, the power density of ultracapacitors is higher, but they exhibit relatively low energy density. The enhancement of specific capacitance is a key approach to improve their energy density according to the equation: E = CV2/2, whereas specific capacitance relies essentially on the electrode materials employed.3 Thus, studies have been focused on the utilization of various materials to produce electrodes for high capacitance and therefore energy output.Nanoporous carbon materials have attracted intense interest as electrode materials for supercapacitor applications, primarily due to their various desirable advantages such as wide allotrope forms, high surface areas, large pore volumes, superior stabilities and low cost.4,5 Among these carbon materials, which include activated carbons (ACs),6 carbon nanosheets,7 graphene,8 carbon fibers,9 carbon nanotubes,10 carbon nanospheres,11 carbon aerogels,12 and carbide derived carbons,13 their highly porous structures act as a bulk buffering reservoir for electrolytes to minimize the impedance of ion transport to the interior surfaces of the pores.14 Therefore, it is necessary to optimize pore structure, pore size and surface functionalities for charge accumulation in the electrode/electrolyte interface to obtain the perfect electric double-layer.15 Activated carbon is the most commercially used electrode material to date because of its low cost and easy preparation compared with other porous carbons (e.g. templated carbons and carbide derived carbons) and will be the most widely used electrode material in the next few decades.16,17
It has been widely acknowledged that activated carbon consists of three pore sizes: micro-, meso- and macro-pores.18 Among these, micro-pores are deemed to have the main contribution to capacitance, whereas meso- and macro-pores can accelerate ion diffusion in the electrode.19 Cheng et al. prepared a 3D periodic hierarchical porous graphitic carbon (HPGC) using a phenolic resin as the carbon source.20 The 3D hierarchical porous texture contains macroporous cores, mesoporous walls, and micropores. These abundant hierarchical pores capacitate the HPGC to act as a SC electrode with high specific capacitance and fast charge/discharge ability. Even at a fast discharge rate of only 3.6 s, the HPGC can exhibit an outstanding power and energy density of 23 kW kg−1 and 22.9 W h kg−1, respectively. Porous carbon derived from poly(vinylidene fluoride) carbon21 exhibited a specific surface area of 1012 m2 g−1, which yielded a specific capacitance of 264 F g−1 for 6 M KOH but only 7 F g−1 for 1 M Et4NBF4/PC, due to the fact that its pore size was too small to be approachable, even for the desolvated ions in the non-aqueous electrolyte. Qu et al. used N-doped activated carbon electrodes derived from different natural sources such as rice,22 which yielded a specific capacitance of 398 F g−1 with a specific surface area of 2105.9 m2 g−1. Wang et al. reported pig skin-derived23 carbon nanoplates with a specific capacitance of 278 F g−1 at 10 A g−1 in 6 M KOH electrolyte due to their abundant effective micropores and high heteroatom content. The construction of activated carbon with an appropriate pore structure and heteroatom-doping (especially nitrogen and oxygen) via a suitable method is the key to strengthen the specific capacity and energy density of supercapacitors and promote their practical utilization.24
The high cost of raw materials, environmental destructiveness from their preparation and complicated manufacturing largely limit the further applications of most supercapacitors.25 Recently, a great deal of attempts have been made to develop green methods for the preparation of ACs using biomass (such as pomelo peel,26 bagasse,25 spinach leaves,15 Euonymus japonicus,27 banana peel,28 bacterial cellulose,29 and soybean30) to replace conventional chemicals. In addition, the most widely used material is coconut shell activated carbon, which has been commercially available since many years and has a mature technological process. Biomass materials are renewable, easily available and very cheap, and thus are potential raw materials for the preparation of porous carbons with good capacitive performance.31–33 Thus, the preparation of ACs from biomass precursors has attracted considerable attention. Loofa sponge (LS) is one such commercially viable and environmentally acceptable biological material, which is derived from the fruit of the L. cylindrica (LC) plant and has recycling capability and triggered biodegradability.34,35 It is a lignocellulosic material composed mainly of cellulose, hemicelluloses and lignin. Its fibers are composed of 60% cellulose, 30% hemicellulose and 10% lignin.36 The fruits of LC are smooth and cylindrical shaped, have a netting-like fibrous vascular system, and when they are dried, the fibrous network structure serves as an open cell foam material.36 Factors such as high surface area per volume, strong and durable structure, low specific gravity (which makes it light) and reasonable cost are characteristics of loofa that make it a widely used material.37 It is worth noting that Li et al. prepared activated carbon with micrometer-scale channels derived from loofa sponge fibers as a supercapacitor, which exhibited an excellent electrochemical performance, and its specific capacitances at 1 A g−1 were 167, 196, and 249 F g−1 in Na2SO4, KOH, and H2SO4 solutions, respectively.38 In view of this, LS has the immense potential to be used as an electrode material for supercapacitors.
Herein, LS is employed as a precursor for the preparation of ACs via high temperature carbonization and alkali activation. Before carbonization, we pretreated LS using a hydrogen peroxide solution and ethylenediamine tetraacetic acid disodium salt solution. Continuous micro- and meso-porous structures were created on the walls of the carbon by KOH activation at different ratios. The prepared hierarchical activated carbon possesses a high specific surface area (2402 m2 g−1) with reasonable pore size distributions and hence exhibits good energy storage performance and high cycling stability. The supercapacitor based on LSAC-3, which was synthesized with the alkali to LSC ratio of 3, displays a remarkable electrochemical performance with a substantially high specific capacitance (up to 499 F g−1 at 0.1 A g−1), good rate capability (with a capacitance retention of 62% at 10 A g−1), and extraordinary cycling stability (only 8.7% capacitance loss over 10000 cycles at 5 A g−1).
Experimental
Typical synthetic procedure for loofa sponge activated carbon
Loofa sponge was grown in southern China, and purchased from the market in Beijing; it had a long bar appearance, 5–7 cm in diameter and 50–70 cm in length. First, the seeds of loofa were removed, and then it was crushed to the particle size of about 20 mesh. After washing with water and drying at 80 °C, the loofa sponge was bleached using hydrogen peroxide for 6 h and dried at 80 °C for 12 h, and then soaked with ethylenediamine tetraacetic acid disodium for 6 h. The pretreated loofa sponge was washed with water and dried at 80 °C. Second, the cleaned precursor was placed in a porcelain boat and heated in a horizontal tube furnace up to 500 °C at a rate of 5 °C min−1 and maintained at this temperature for 2 h under a high purity N2 flow. After crushing in a mortar, the resultant product was obtained and denoted as LSC-500, where 500 indicates the carbonization temperature. Third, the samples carbonized at 500 °C (LSC-500) and KOH (Beijing Chemical Co., Ltd. China) were mixed uniformly at various alkali/carbon ratios with the deionized water, then the sludge was dried at 80 °C for 20 h, and then placed into a tube furnace for activation at 800 °C for 3.5 h. These loofa-derived activated samples were denoted as LSAC-n, where n indicates the alkali/carbon ratio. The sample that was not treated by hydrogen peroxide and ethylenediamine tetraacetic acid disodium was denoted as NT-LSAC-n. The resultant black powder was immersed in dilute HCl solution to remove soluble/insoluble substances, and subsequently washed with adequate deionized water. Finally, the sample was dried under vacuum at 80 °C for 12 h to obtain the product. A schematic diagram of the process is shown in Fig. 1.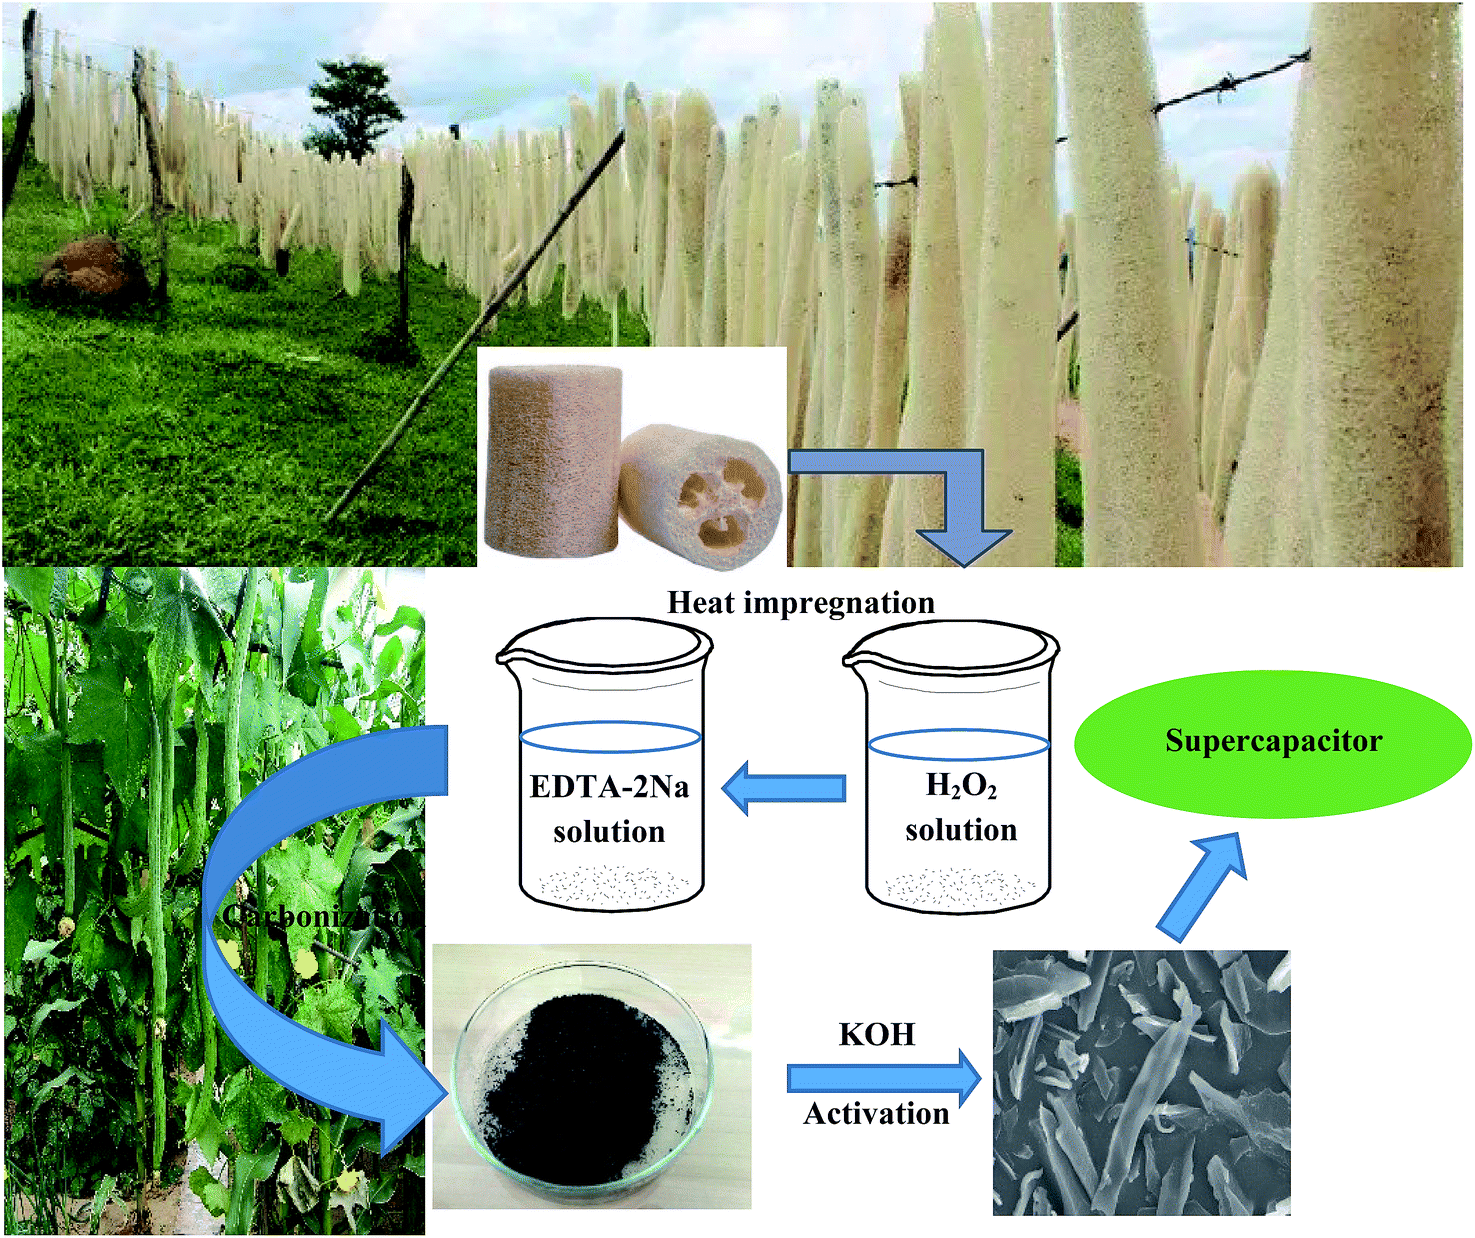 | ||
| Fig. 1 The schematic diagram of the preparation of the loofa-sponge-derived activated carbon. | ||
Characterization
X-ray diffraction patterns (XRD) were obtained on a Rigaku D/MAX-2500 equipped with Cu Kα radiation. A thermogravimetric analyzer (Beijing Hengjiu Scientific Instrument Co. China) was employed to analyse the pyrolysis progress of loofa. A Hitachi S-4700 scanning electron microscope (SEM) at 5–20 kV and a JEOL JEM-3010 transmission electron microscope (TEM) at 200 kV were applied to examine the morphology of the samples. Raman spectra (Renishaw in Via Micro-Raman Spectroscopy System at 514 nm) were obtained to verify the degree of graphitization. An Elementar vario EL CUBE (Elemental Analyse system GmbH, Germany) was used to analyze the elementary composition of the samples. X-ray photoelectron spectra (XPS) were obtained on a Thermo VG ESCALAB 250 spectrometer equipped with a monochromatic Mg Kα X-ray source (1253.6 eV), which was also used to examine the surface atomic composition.Gas absorption measurement
A micromeritics ASAP 2020 surface area and porosity analyzer was employed for N2 adsorption–desorption (77 K) and CO2 adsorption (273 K) analysis to obtain the N2/CO2 adsorption isotherms of the samples. Samples were degassed at 300 °C under vacuum for 12 h prior to the measurement. Brunauer–Emmett–Teller (BET) and t-plot method and density functional theory (DFT) were used to calculate the specific surface area and pore size distribution, respectively. The adsorption average pore width, Dave, was evaluated according to the equation Dave = 4V/A, using the BET method, where V is the single point adsorption total pore volume of pores, Vt, and A is the BET surface area, SBET. The average micropore size, L0, was determined from the Stoeckli equation: L0 (nm) = 10.8/(E0 − 11.4 kJ mol−1), where E0 is the characteristic energy of the Dubinin–Radushkevich (DR) equation.Electrochemical characterization
Cyclic voltammetry curves (CV) and electrochemical impedance spectra (EIS) were obtained on a CHI 760E electrochemical work station (Shanghai Chenhua Instrument Co., China). Galvanostatic charge–discharge tests were conducted on a LAND CT2001A tester. For the as-prepared samples as supercapacitor materials, electrochemical tests were first performed using a standard three-electrode setup. The working electrode material was a mixture of the activated sample, acetylene black and poly-tetrafluoroethylene (PTFE) at a mass ratio of 8:1:1, which was pressed onto a piece of nickel foam; it acted as the current collector to form a working electrode. A platinum gauze electrode and Hg/HgO electrode were used as the counter and reference electrodes, respectively, which constitute a three-electrode system with the working electrode. These experiments were performed in N2-saturated 6 M KOH electrolyte.
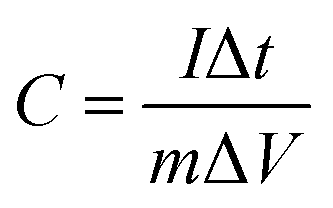
Symmetric supercapacitors were built using two equal electrodes with a glassy fibrous separator, nickel foam current collector, and performed in a two-electrode cell in 1 M SBP-BF4/AN electrolyte. The electrodes were dried for several days at 100 °C under vacuum and then stored in a glove box. The electrochemical cell was assembled in the Swagelok configuration using 1.13 cm2 surface electrodes. Cyclic voltammetry (CV) was conducted at various scan rates. Galvanostatic charge/discharge curves were obtained at various current densities to evaluate the specific capacitance. In this study, the specific capacitance (C) was calculated according to the eqn (1):
 | (1) |
| E = 1/2CcellV2 | (2) |
| P = E/Δt | (3) |
Results and discussion
Pyrolysis of loofa sponge and morphology of activated carbon
Loofa sponge, which is the fruit of the Luffa cylindrica plant, is composed mainly of cellulose, hemicelluloses and lignin, and possesses a netting-like fibrous vascular system,39 which is beneficial for the preparation of porous carbons. The thermograms curves (TG and DTG) of natural and treated loofa sponge are displayed in Fig. 2. For the raw loofa sponge, four degradation steps can be seen in the TG together with DTG curves. The sponge mass decreased from about 98.5% (at 100 °C), 82.6% (at 200 °C) to 73.7% (at 240 °C) and to 37.0% (at 500 °C), respectively. The different regions can be associated with the loss of retained water under 100 °C, hemicellulose degradation in the 180–260 °C region, cellulose degradation at 240–350 °C and lignin degradation at 280–500 °C.40,41 However, for the H2O2/EDTA-2Na treated loofa sponge precursor, only three degradation process were observed in Fig. 2, and its mass decreased from about 92.7% (at 100 °C) to 77.7% (at 290 °C) and to 21.3% (at 500 °C). The absence of detectable levels of hemicelluloses in the TG, and the loss of weight triggered mainly by the degradation of cellulose and lignin, suggest that a large quantity of hemicellulose was removed after treatment with H2O2/EDTA-2Na. This illustrates that the treatment with H2O2/ETDA-2Na was the most efficient in hemicellulose removal and in cellulose exposition.42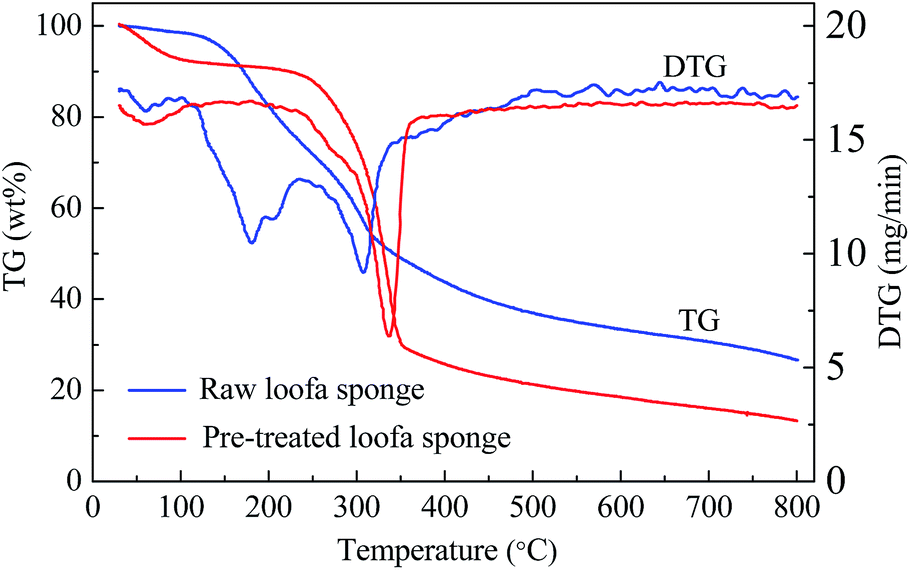 | ||
| Fig. 2 TG and DTG curves of raw loofa sponge and H2O2/EDTA-2Na treated loofa sponge. | ||
Consequently, a large amount of cellulose on sponge surfaces provides free hydroxyl groups. In particular, the hydrogen peroxide tends to oxidize the hydroxyl groups from cellulose in the sponge surface to carboxyl groups,43,44 and this gives rise to the increase of the surface oxygen content of the carbonization products.
Activated carbon prepared from loofa sponge has been previously reported,38,45 and its morphology features are inherited from the loofa sponge fiber precursor. Carbon obtained by carbonization exhibits abundant micrometer-scale channels and a continuous honeycomb-like distribution. The typical SEM images of the samples carbonized at 500 °C and activated by KOH at 800 °C using crushed raw loofa sponge impregnated by H2O2 and EDTA-2Na are presented in Fig. 3. As seen in Fig. 3a–e, the carbonized products and the activated products possess a similar morphology, and due to crushing, the channels walls were broken along the fiber axis, which generated irregular elongated flakes with the length of 5−80 μm and width of 10−50 μm. Moreover, some of the larger particles retained the original honeycomb-like porous structure. A representative HRTEM image of the sample activated at 800 °C under the KOH/C weight ratio of 3, which was obtained from the thin area at the edge position of an irregular flake, is shown in Fig. 3f. It is observed that the activated sample is not well crystallized and it has a typical amorphous carbon lattice, however there were tiny graphite domains that consisted of several layers of graphene sheets.
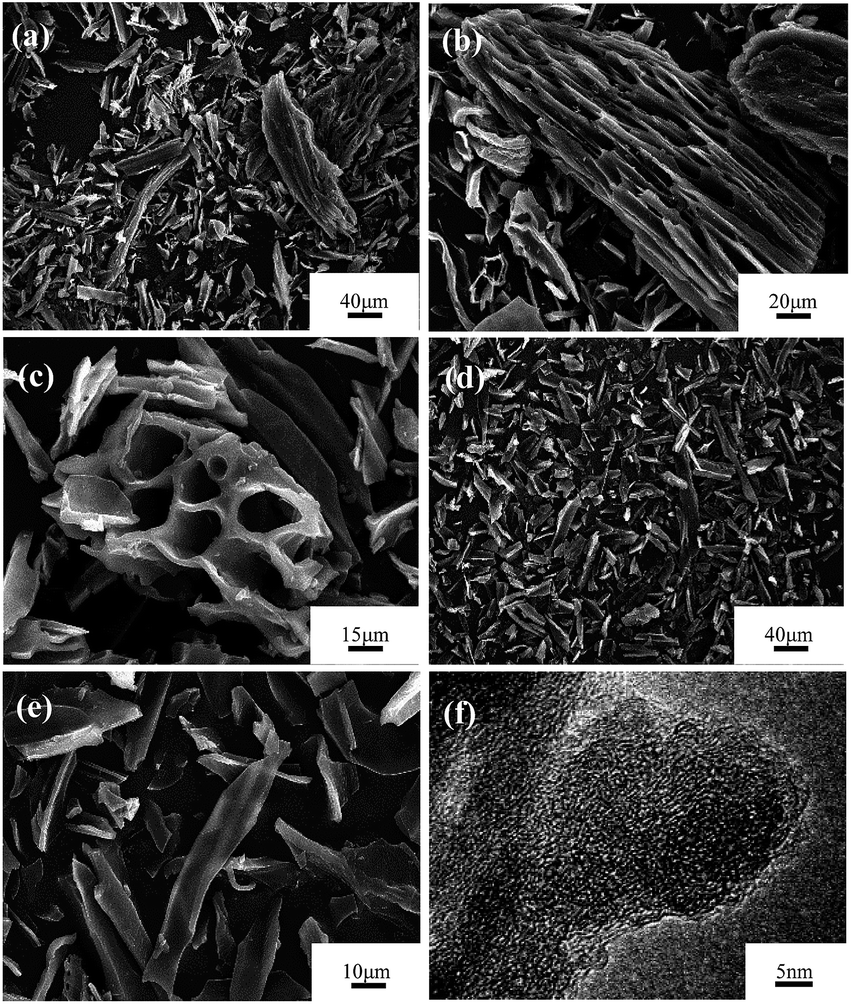 | ||
| Fig. 3 SEM images of sample carbonized at 500 °C for 2 h and activated at 800 °C for 3.5 h under N2 flow: (a–c) LSAC-1.5; (d, e) LSAC-3; and (f) HRTEM image of the activated sample LSAC-3. | ||
Physico-chemical characterization of loofa sponge-based carbon
The carbon lattice structure in the LSACs was studied by X-ray diffraction (XRD) patterns, which are shown in Fig. 4a. Two broad diffraction peaks can be observed at approximately 2θ = 25° and 43°, which are related to the (002) plane and the overlapped peak of the (100) or (101) planes of hexagonal carbon, respectively.34 The two peaks of the activation precursor, LSC-500, are intensive, which suggest a high degree of order in the three-dimensional structure. Compared with the carbonized sample, the diffraction peaks obviously weaken after activation, which indicates the destruction of the graphite layer alignment by KOH. The high intensity in the low angle region may be ascribed to the existence of abundant micropores in the LSAC. As the KOH/C ratio increases from 1.5 to 3, the peak intensity becomes even weaker due to the enhanced KOH etching. However, for the sample activated at the ratio of 4, the intensity of the two peaks becomes slightly stronger, which indicates improved graphitic crystallinity, and this is probably because severe reactions between carbon and KOH finish quickly at a high KOH/C ratio, and then the ordered rearrangement of the graphite layers occurs.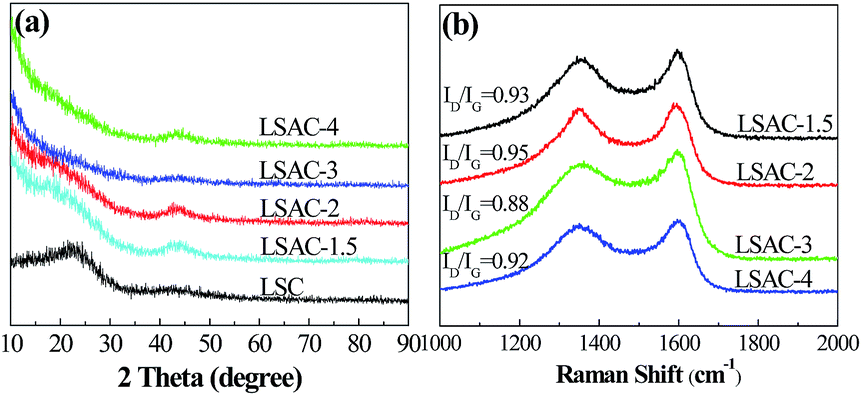 | ||
| Fig. 4 (a) XRD patterns of the 500 °C carbonized sample (LSC-500) and the corresponding activated samples. (b) Raman spectra of the activated samples. | ||
To further identify the graphitic structure of the loofa sponge-derived porous carbon, Raman spectroscopy was conducted and the spectra obtained are shown in Fig. 4b. The observed bands positioned at 1345 and 1569 cm−1 are the D-(defects and disorder) and G-(graphitic) bands, respectively, of carbon materials. The intensity ratio of these two peaks (ID/IG) partially depends on the graphitization degree. The higher the ratio, the lower the degree of graphitization. The ID/IG ratios approximating to 1 manifest amorphous carbon in the LSAC. The ID/IG values are 0.93, 0.95, 0.88 and 0.92 (following an increasing alkali/carbon ratio), which indicate the higher graphitization degree of LSAC-3, which may further affect the conductivity of the materials. Herein, the Raman data is inconsistent with the X-ray diffraction (XRD) patterns, possibly because the ribbons are very thin to produce sharp (002) graphite peaks in the XRD spectra.46 Because the G-band in the Raman spectra comes from in-plane vibrations, thin graphite can be more efficiently detected by Raman spectroscopy.
Loofa sponge is the main fruit of L. cylindrica, which is a sub-tropical plant and a summer season vegetable;35 it has a highly complex macroscopic architectural sponge fiber gourd-shape. Its sponge fibers are composed of cellulose, hemicellulose, lignin, pectins, phytic acid, vegetable protein, waxes and a trace of mineral content (Mg, Ca, Na, K, Fe, Cu, Zn and Mn).36,47 The as-reported chemical analysis shows its composition to be α-cellulose: 63.0%, hemicellulose: 19.4%, lignin: 11.2%, extractives: 3.2% and ash: 0.4%,39 with slight differences according to the source of the loofa sponge. To comprehensively investigate the changes in the elemental composition of loofa sponge after the pyrolysis process and KOH activation, elemental analysis was conducted to study the bulk elemental compositions of loofa sponge and the activated samples, and the results of the C, H, N and S elemental analysis and surface elementary composition are presented in Table 1. The as-prepared raw loofa sponge contains approximately 43.99 wt% carbon, 5.96 wt% hydrogen, 0.49 wt% nitrogen, and 0.48 wt% sulphur. After KOH activation, the carbon content of the as-prepared samples increases continuously to 93.58 wt% with an increase in the C/KOH weight ratios. Due to the N-doping effect of EDTA, the nitrogen content increases slightly, while the contents of H and S elements decrease significantly (H: 5.96–0.27 wt% and S: 0.48–0.15 wt%). X-ray photoelectron spectroscopy (XPS) was also used to investigate the surface chemical characteristics and the results are also shown in Table 1. With respect to the activated samples, the XPS survey confirmed the coexistence of C, N and O, but the surface content of C and N is much lower on the surface one than in the bulk, while the surface content of O increased to 13.36 at% with C/KOH weight ratio and then decreased to 8.67 at% at C/KOH = 4.0, which suggests that the H2O2 pretreatment of raw loofa sponge could significantly improve the oxygen content in the surface of the porous carbon materials. On the contrary, EDTA pretreatment failed to afford surface nitrogen. Thus, it can be concluded that the surface of the as-prepared activated carbon is very rich in oxygen. Herein, the O atoms can be classified into three types of chemical states at 531.5, 532.9 and 534.5 eV, which correspond to the carbonyl oxygen in quinones (O-I), carbonyl oxygen in esters and anhydrides or oxygen atoms in phenolic hydroxyl (O-II), and non-carbonyl oxygen in esters and anhydrides (O-III), respectively.48 The deconvoluted peaks of O 1s are shown in Fig. 5, and the surface chemical compositions are shown in Table 1. As can be observed, the O-II content is the highest, and the O-I content is the lowest. However, only O-I species are considered to give rise to pseudo-capacitance effects.49 In addition, the abundant O-contained surface functional groups can increase the wettability of the carbon material and consequently enhance its electrochemical performance.
| Samples | Elementary analysis | Surface elementary composition | ||||||||
|---|---|---|---|---|---|---|---|---|---|---|
| N [%] | C [%] | H [%] | S [%] | N (at%) | C (at%) | O (at%) | O-I (at%) | O-II (at%) | O-III (at%) | |
| Loofa sponge | 0.49 | 43.99 | 5.96 | 0.48 | — | — | — | — | — | — |
| LSAC-1.5 | 0.57 | 91.45 | 0.27 | 0.15 | 0.71 | 91.35 | 7.19 | 1.25 | 4.25 | 1.69 |
| LSAC-2 | 0.68 | 93.19 | 0.51 | 0.18 | 0.45 | 87.45 | 11.05 | 2.77 | 4.84 | 3.44 |
| LSAC-3 | 0.71 | 93.42 | 0.44 | 0.21 | 0.47 | 85.83 | 13.36 | 3.25 | 7.20 | 2.91 |
| LSAC-4 | 0.63 | 93.58 | 0.27 | 0.19 | 0.45 | 89.29 | 8.67 | 2.08 | 5.15 | 1.44 |
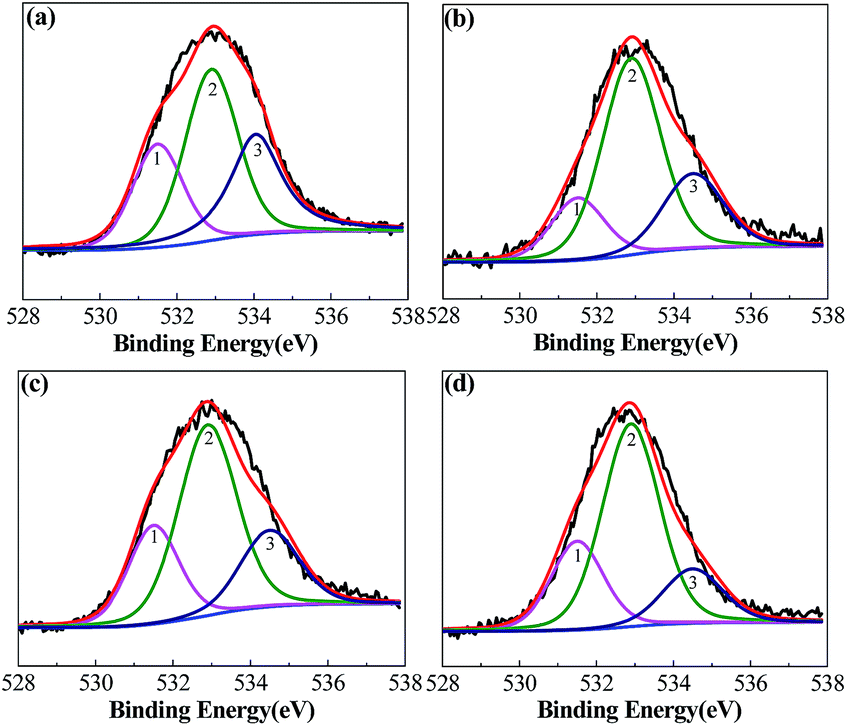 | ||
| Fig. 5 O 1s core level spectra of the samples activated at different KOH/C ratios: (a) LSAC-1.5; (b) LSAC-2; (c) LSAC-3; and (d) LSAC-4. | ||
Porous carbons with a high specific surface area (SSA) and optimized micro-size pores are of great technological importance and are now in great demand for applications such as gas separation, hydrogen storage, electrodes in lithium ion batteries or supercapacitors, to name a few.46 In particular, as electrodes of electric double-layer capacitors, strict control of pore structure in the carbons is required to achieve an optimum performance. The most common view is that the optimum capacitance can be expected from carbons that provide a good size fit between pores and ions.50–52 Fig. 6 shows the nitrogen adsorption isotherms and corresponding pore size distributions of the as-prepared loofa sponge-derived activated carbons, which are compared to the values for the sample untreated by H2O2. As illustrated in Fig. 6a, all the curves exhibit type-I sorption isotherms with steep uptake below P/P0 = 0.05, and they have no obvious hysteresis as the KOH/C ratio increases from 1.5 to 4, which indicates the presence of mainly micropores. The ‘‘knee’’ of the isotherm tends to open as the KOH/C ratio increases up to 3, which demonstrates the widening of microporosity, but an excessive activation for sample LSAC-4 results in slight closing of the knee, which is mainly due to the collapse and shrinkage of pores. Under the same KOH/C ratio, the N2 uptake of the sample untreated by H2O2/EDTA-2Na was much lower, which corresponds to the fact that highly microporous carbons can be produced by the pre-oxidation of ligneous biomass. Fig. 6b shows the PSD curves that were obtained using the density functional theory (DFT) model. It can be easily seen that the pore size distribution is within the range of 0.7–2.7 nm. For LSAC-1.5 and LSAC-2, their porosities were divided into the ultra-micropore range (0.7–1.0 nm) and micropore range (1.0–1.5 nm), and totally without mesopores above 2.0 nm. Most interestingly, as the KOH/C ratio increased, the porosity development was broadened quickly and considerably in the micropores and smaller mesopores within the range of 0.7–2.7 nm, indicating that there are no dividing walls among the varied sized pore framework and that an opened and interconnected channel texture was formed.
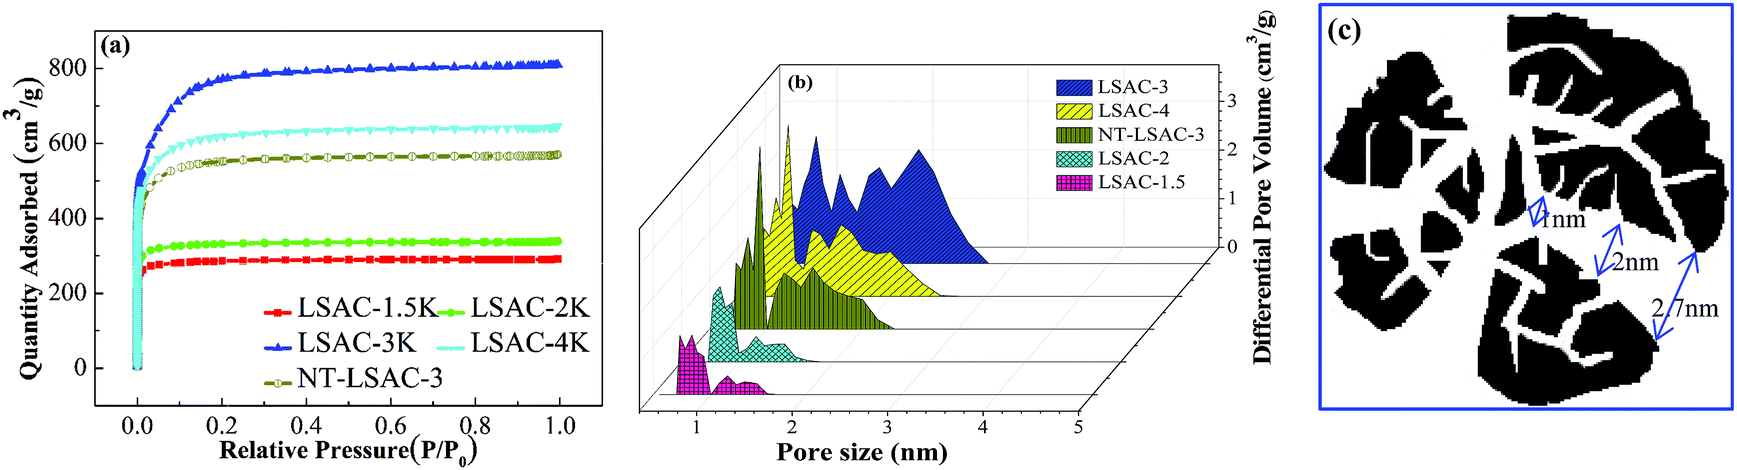 | ||
| Fig. 6 (a) N2 (77 K) adsorption–desorption isotherms of the samples with different ratios of KOH/C; (b) N2 adsorption related pore size distributions of all the activated samples; and (c) the pore shape of LSCA-3 samples. | ||
The data on the porous texture of the carbons are given in Table 2. The BET surface areas (SBET) and single point adsorption total pore volumes (Vt) increase dramatically from 861 m2 g−1 to 2402 m2 g−1 and from 0.45 to 1.25 cm3 g−1, respectively, with the increase in alkali dosage, and then slowly decrease to 1900 m2 g−1 and 1.00 cm3 g−1. The adsorption average pore width (Dave), which was evaluated according to the equation Dave = 4V/A via the BET method, was basically unchanged, which demonstrates the preferential and balanced opening/development of the micropores with the increase in KOH/C ratio. However, the average micropore size (L0), which was calculated from the Stoeckli equation by the characteristic energy (E0) of the Dubinin–Radushkevich (DR) method, demonstrated a stepwise increase from 1.23 to 2.77 nm, and then reduced to 2.17 nm for LSAC-4, thus suggesting that the H2O2 pre-oxidation processing of ligneous biomass has underlying controllability of the pore enlargement process. The specific surface areas and pore volumes of the different pore size sections obtained via the DFT method exhibit different trends. For the ultra-micropores (<1 nm), they gradually increase according to the KOH/C weight ratio, while for the micro- and mesopores (1–3 nm) they are found to first increase and then reduce. In contrast, the NT-LSAC-3 sample still appears to be bimodal micropore activated carbon. This conclusion is supported by the DFT analysis, which demonstrates a narrow bi-micropore size distribution for the lower KOH/C samples and extensive amalgamating and broadening for the higher activated samples. From a comprehensive analysis of the BET data, it can be concluded that the pore size of the LSAC-3 sample gradually narrows the distribution of the wedge-shaped channel, the pore size distribution is uniform, and the pore passage is intercommunicated, as shown in Fig. 6c. To summarize, all the porosity data collectively demonstrate that the H2O2 pre-oxidation processing of ligneous biomass precursors, following carbonization and activation, is well suited for tailoring the carbon pore size and shaping the possibility of channels, and can supposedly be employed for the production of carbon electrode materials that are perfectly adapted to the ion size of the supercapacitor electrolyte.
| Samples | SBET (m2 g−1) | Davea (nm) | Vt (cm3 g−1) | DFT method | DR method | ||||||
|---|---|---|---|---|---|---|---|---|---|---|---|
| S<1 nm (m2 g−1) | S1–3 nm (m2 g−1) | S2–3 nm (m2 g−1) | V<1 nm (cm3 g−1) | V1–3 nm (cm3 g−1) | V2–3 nm (cm3 g−1) | E0 (kJ mol−1) | L0b (nm) | ||||
| a Adsorption average pore width, Dave, was evaluated according to the equation Dave = 4V/A via the BET method, where V is the single point adsorption total pore volume of pores, Vt, and A is the BET surface area, SBET.b The average micropore size, L0, was determined from the Stoeckli equation: L0 (nm) = 10.8/(E0 − 11.4 kJ mol−1), where E0 is the characteristic energy of the Dubinin–Radushkevich (DR) equation. | |||||||||||
| LSAC-1.5 | 861 | 2.10 | 0.45 | 420 | 82 | 0 | 0.16 | 0.05 | 0 | 20.18 | 1.23 |
| LSAC-2 | 1000 | 2.10 | 0.53 | 450 | 104 | 0 | 0.18 | 0.07 | 0 | 19.20 | 1.38 |
| LSAC-3 | 2402 | 2.09 | 1.25 | 795 | 758 | 99 | 0.34 | 0.60 | 0.11 | 15.29 | 2.77 |
| LSAC-4 | 1900 | 2.10 | 1.00 | 834 | 469 | 26 | 0.35 | 0.35 | 0.03 | 16.38 | 2.17 |
| NT-LSAC-3 | 1686 | 2.09 | 0.88 | 754 | 386 | 6 | 0.31 | 0.28 | 0.01 | 16.98 | 1.94 |
Electrochemical characterization of the loofa sponge-based carbon
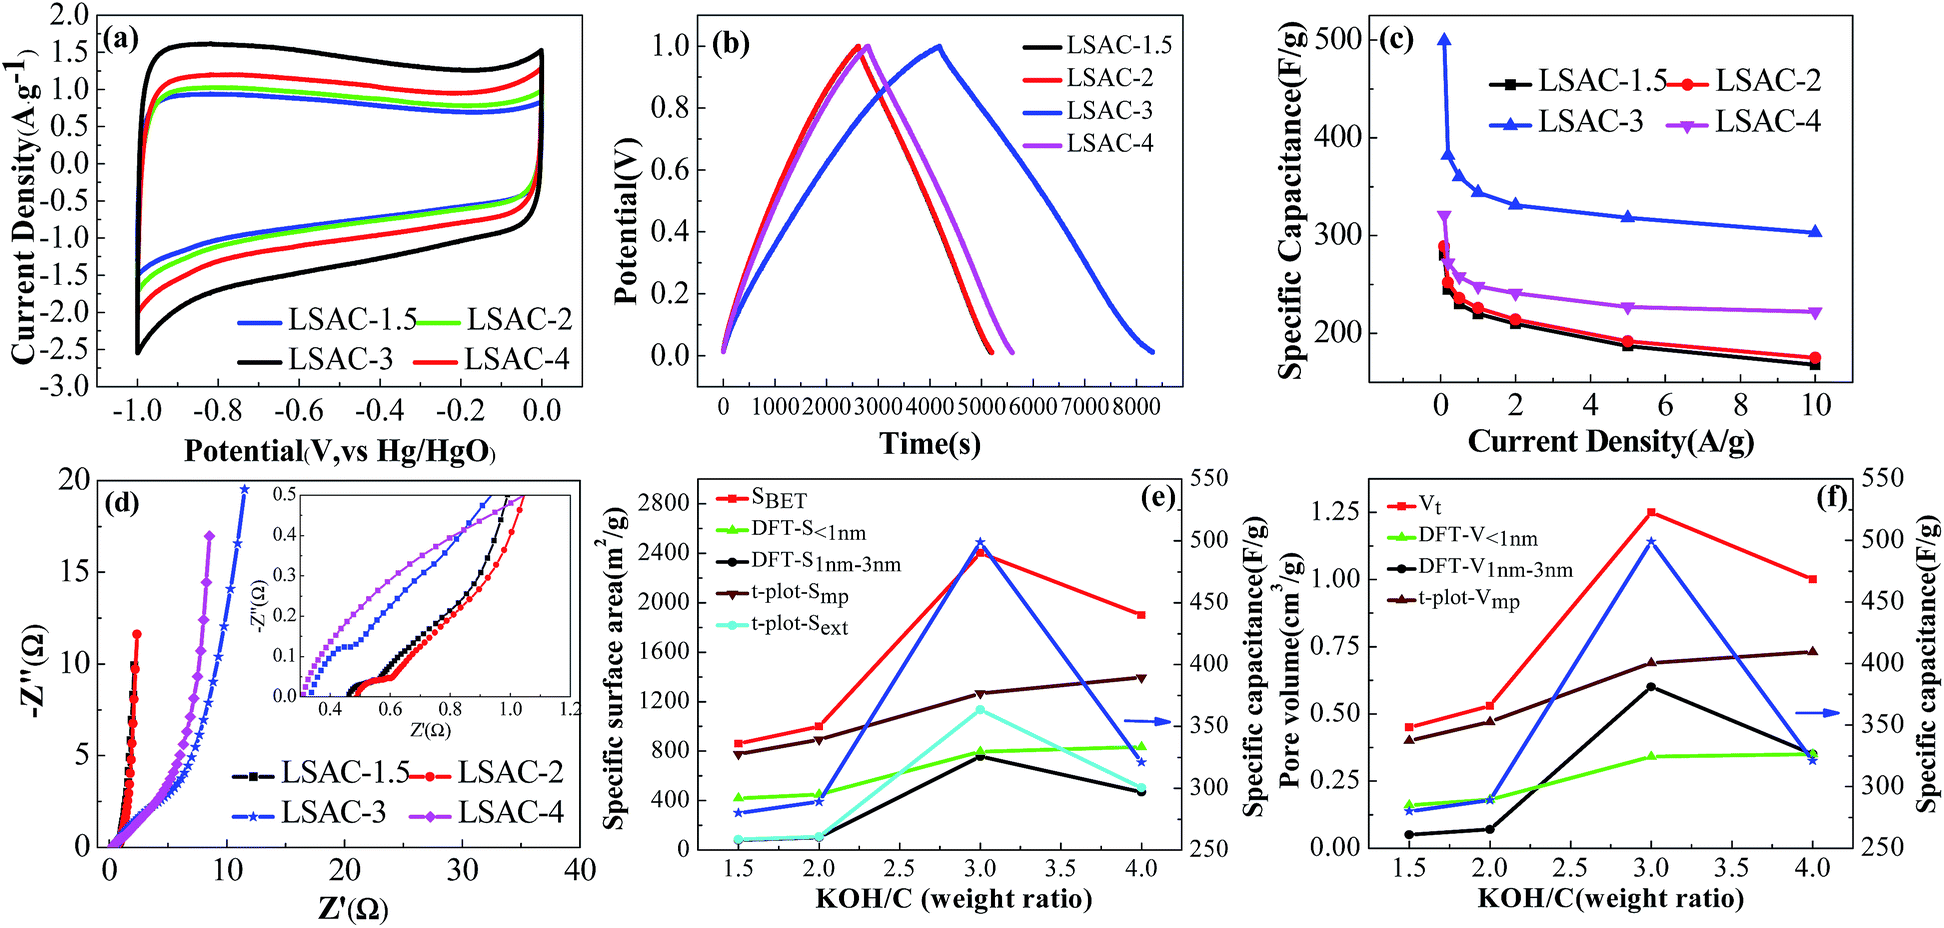 | ||
| Fig. 7 Electrochemical performance of loofa sponge-derived carbon sheets in 6 M KOH. (a) Cyclic voltammetry curves at a scan rate of 5 mV s−1; (b) galvanostatic charge–discharge curves at 0.1 A g−1; (c) specific capacitances at different current densities; (d) Nyquist plots; (e) various specific surface areas and specific capacitance as a function of KOH/C ratio; and (f) pore volume parameters and specific capacitance as a function of KOH/C ratio. | ||
| Raw materials | Electrolyte | SBET (m2 g−1) | Current density (A g−1) | Specific capacitance (F g−1) | N (at%) | O (at%) | Reference |
|---|---|---|---|---|---|---|---|
| a Calculated by weight (g/g). | |||||||
| Chicken feather | KOH | 2515 | 0.1 | 351 | 2.46 | 15.99 | 6 |
| Broussonetia papyrifera | KOH | 1212 | 0.5 | 320 | 1.0 | 6.4 | 53 |
| Pig skin | KOH | 2209 | 0.5 | 306 | 2.96 | 12.28 | 23 |
| Human hair and glucose | KOH | 849 | 0.25 | 264 | 3.1 | 10.7 | 32 |
| Banana peel | KOH | 1650 | 1 | 206 | — | — | 28 |
| Pomelo peel | KOH | 2725 | 0.2 | 342 | 2.85 | 8.55 | 26 |
| Spinach leaves | KOH | 2616 | 1 | 238 | — | — | 15 |
| Bagasse | KOH | 1892 | 0.5 | 142 | — | — | 25 |
| Corncobs | KOH | 3054 | 0.5 | 328.4 | 0.3 | 9.49 | 54 |
| Soybean | KOH | 580 | 0.5 | 425 | — | — | 30 |
| Fungus (Auricularia) | KOH | 1103 | 0.5 | 374 | — | — | 55 |
| Cattail | KOH | 1951 | 3.45 | 336 | — | — | 56 |
| Willow catkins | KOH | 645 | 1 | 279 | 2.17a | 39.55a | 57 |
| Bean dregs | H2SO4 | 2876 | 1 | 482 | 1.64a | 9.93a | 58 |
| Bacterial cellulose | H2SO4 | 290 | 1 | 205 | 5.76 | — | 29 |
| Loofa sponge | KOH | 1510.7 | 1 | 196 | 0.49 | 8.18 | 38 |
| Loofa sponge | KOH | 2402 | 0.1 | 499 | 0.45 | 13.36 | Our work |
| 1 | 344 | ||||||
Nyquist plots in a frequency range from 0.01 Hz to 10 kHz were obtained to examine the electrochemical impedance behavior of LSAC. As can be seen from Fig. 7d, the nearly vertical line in the low frequency section represents the electric double layer energy storage. The Warburg-type line (the tail with a slope of 45°) at the middle frequency section corresponds to ion diffusion resistance. The value of the real axis intercept in the high-frequency range represents the equivalent series resistance (ESR), which is the sum of the electrolyte resistance, the intrinsic resistance of the active electrode material, and the contact resistance at the interface between the current collector and the active materials. In Fig. 7d, LSAC-3 and LSAC-4 have lower ESR values than LSAC-1.5 and LSAC-2, which suggest the high specific surface area and graphitization degree reduce the additional resistance.
The influence of the alkali/carbon ratio on the textural parameters and specific capacitance of the loofa sponge-based ACs is shown in Fig. 7e and f, in which (e) is the alkali/carbon ratio dependence of surface area and specific capacitance, and (f) shows the effect of the alkali/carbon ratio on pore volume and specific capacitance. The BET surface area, the surface area of pores between 1 nm and 3 nm estimated via the DFT method, external surface area calculated using the t-plot method and specific capacitance exhibit a similar trend with the increase in alkali/carbon ratio, where there is an increase with the increase in alkali/carbon ratio up to 3, and decrease with the further activation. The total pore volume, the pore volume of pores between 1 nm and 3 nm as estimated by the DFT method and specific capacitance also follow a similar trend with the increase in alkali/carbon ratio as observed for the surface area. The surface area of micropores smaller than 1 nm calculated by the DFT method and micropore surface area calculated by the t-plot method do not show the trend observed for the surface area of pores between 1 nm and 3 nm estimated by DFT method. These results suggest that the surface area and pore volume of pores between 1 nm and 3 nm is a key factor for the specific capacitance. It is noteworthy that the pore volume of micropores smaller than 1 nm calculated by DFT method shows a similar trend as the specific capacitance at alkali/carbon ratios lower than 4, which suggests that sufficient micropores smaller than 1 nm also make an important contribution to specific capacitance.
The galvanostatic charge–discharge curves of LSAC-3 at different current densities in Fig. 8a show symmetric shapes without obvious IR drop, which demonstrate its small resistance, excellent reversibility and high coulombic efficiency. It can be also observed that the charge–discharge time reduces with increasing current density, and rapid charge or discharge completes within only 39 s at 15 A g−1 with the curve still retaining its approximately linear shape, which manifests a fairly good rate performance. The excellent rate performance of LSAC-3 is further confirmed by the CV investigation at enhanced scan rates. As shown in Fig. 8b, the plateau current increases accordingly with scan rate, and the quasi-rectangular shape and redox peaks can be largely maintained with little distortion at a scan rate of up to 200 mV s−1, which indicate the good rate capability due to the low inner resistance and fast electrolyte ions diffusion kinetics. Cycle life is another critical factor for the practical application of supercapacitors. Galvanostatic charge–discharge cycling of LSAC-3 was performed at a current load of 5 A g−1 to investigate the electrochemical stability of the loofa sponge-based carbon, as depicted in Fig. 8c. After 10000 cycles, the specific capacitance remains at 267.6 F g−1, which corresponds to 91% of its initial value, thus indicating high electrochemical stability. The decreased capacitance is related to the part loss of surface functional groups during the electrochemical process. In addition, after 10000 cycles, the GCD curve (inset in Fig. 8c) still maintains its initial shape without obvious distortion, thus revealing excellent cycling stability. In view of the high specific capacitances and good rate capabilities of the LSACs capacitors, higher specific energies and power densities of the capacitors may also be achieved. As illustrated by Fig. 8d, Ragone plots display the usual curve corresponding to a fall-off of power density vs. energy density. The energy density is calculated as E = 1/2CV2, where C is the specific capacitance and V is the work voltage. The power density is calculated as P = E/Δt, where Δt is the discharge time. The LSAC-3 capacitor delivers energy densities of 59.9–40.9 W h kg−1 under the power output of 48–7362 W kg−1, which highlight the potential of LSAC-3 in high performance energy storage and supply devices.
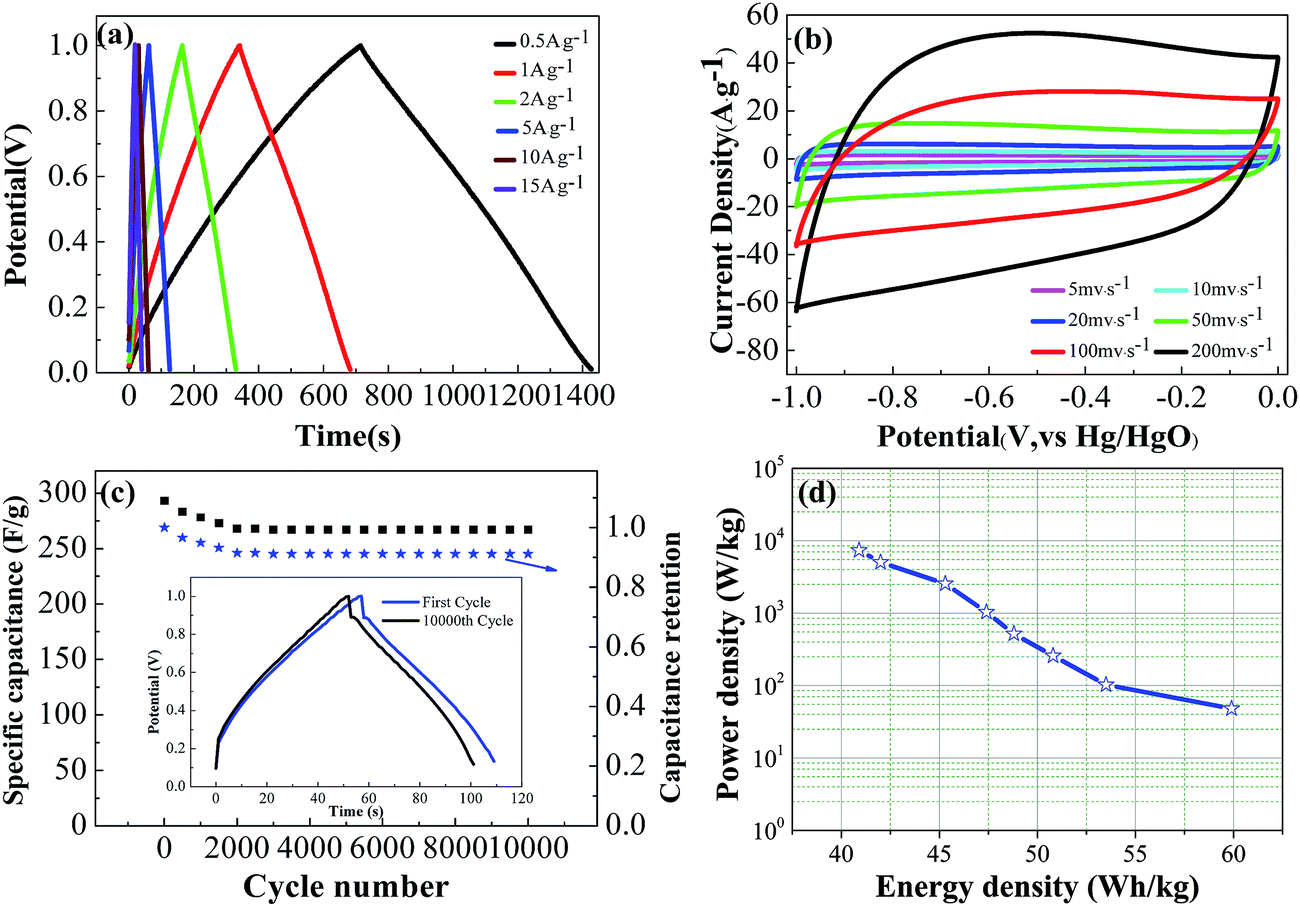 | ||
| Fig. 8 Rate performance of LSAC-3 in 6 M KOH. (a) Charge–discharge curves of LSAC-3 at different current densities; (b) cyclic voltammetry curves of LSAC-3 at different scan rates; (c) cycling stability of samples at a current density of 5 A g−1 for the LSAC-3 electrode and inset is the charge–discharge curves of first cycle and 10 000th cycle; and (d) energy and power densities of the supercapacitor based on LSAC-3. | ||
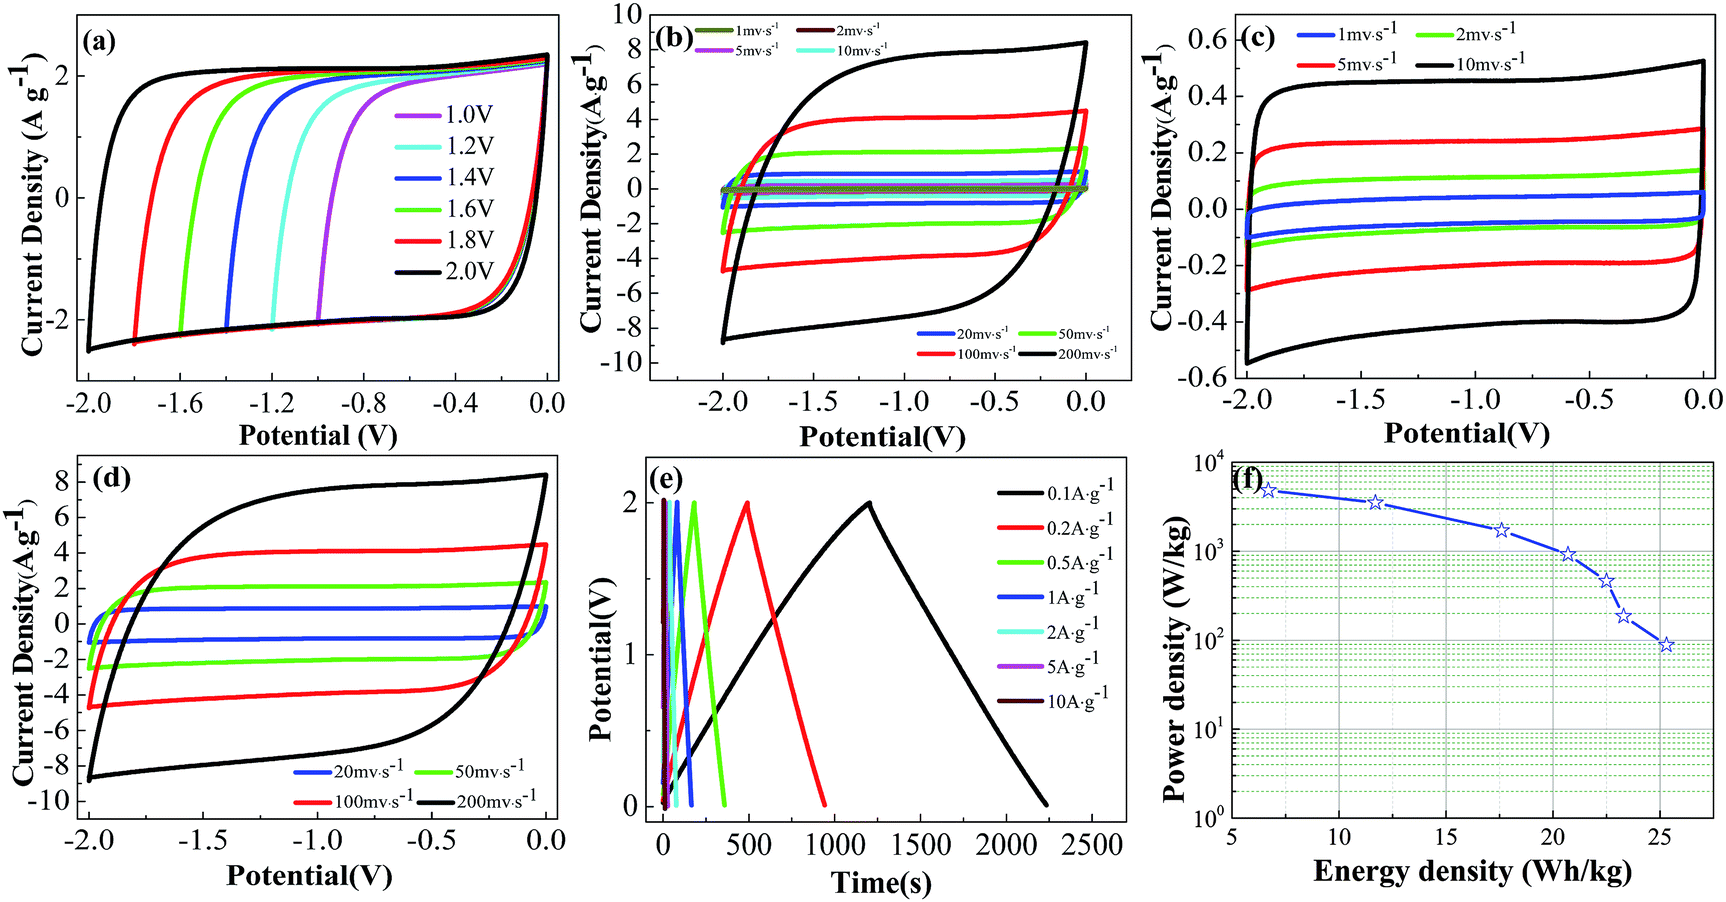 | ||
| Fig. 9 Electrochemical measurements of the as-assembled LSAC-3/LSAC-3 symmetric supercapacitor in 1 M SBP BF4 electrolyte: (a) CV curves of the cell operated at different operation voltages with a scan rate of 50 mV s−1; (b) CV curves of the cell at various scan rates; (c and d) detail drawing of (b); (e) galvanostatic charge/discharge curves of the cell at various current densities (voltage range of 0–2.0 V); and (f) energy and power densities of the as-assembled symmetrical supercapacitor based on LSAC-3. | ||
Conclusions
In summary, we have proposed and demonstrated that the low-cost loofa sponge can be converted into a superior carbon material for high-performance supercapacitors via a unique pretreatment. The treatment with H2O2/ETDA-2Na can effectively change the heteroatom composition in the carbon surface, and is advantageous to the formation of an interconnected channel texture. The impressive capacitive response of the optimal sample is strongly related to its unique features of structure and composition, which include a high BET-SSA, well-suited pore size distribution and open hole texture, along with the presence of abundant heteroatoms. The LSAC-3 sample displays an exciting capacitance of up to 499 F g−1 because of the combination of double layer capacitance and pseudocapacitance induced by its abundant micropores and rich oxygen functionalities. It also shows an excellent rate capability (303 F g−1 at 10 A g−1) and good cycling stability (8.7% loss after 10000 cycles at 5 A g−1). Suitable pore size distribution and sufficient oxygen functionalities play key roles in improving the capacitance. Furthermore, the as-assembled symmetric supercapacitor delivers a high gravimetric energy density of 25.3 W h kg−1 in 1 M SBP-BF4/AN electrolyte. Thus, loofa sponge should be a potentially sustainable precursor for the preparation of porous carbon for use in supercapacitors and other advanced energy devices (such as fuel cells and lithium ion batteries) as well as heterogeneous catalysis.
Acknowledgements
We greatly acknowledge the financial support by the National Natural Science Foundation of China (51372012). Thanks for the support of organic electrolyte battery assembly technology from Professor Donglin Zhao.Notes and references
- S. Faraji and F. N. Ani, Renewable Sustainable Energy Rev., 2015, 42, 823 CrossRef CAS.
- M. D. Stoller and R. S. Ruoff, Energy Environ. Sci., 2010, 3, 1294 CAS.
- J. L. Chang, Z. Y. Gao, X. R. Wang, D. P. Wu, F. Xu, X. Wang, Y. M. Guo and K. Jiang, Electrochim. Acta, 2015, 157, 290 CrossRef CAS.
- Y. P. Zhai, Y. Q. Dou, D. Y. Zhao, P. F. Fulvio, R. T. Mayes and S. Dai, Adv. Mater., 2011, 23, 4828 CrossRef CAS PubMed.
- L. L. Zhang and X. S. Zhao, Chem. Soc. Rev., 2009, 38, 2520 RSC.
- Z. J. Zhao, Y. Wang, M. Li and R. Yang, RSC Adv., 2015, 5, 34803 RSC.
- L. R. Hou, L. Lian, D. K. Li, G. Pang, J. F. Li, X. G. Zhang, S. L. Xiong and C. Z. Yuan, Carbon, 2013, 64, 141 CrossRef CAS.
- C. F. Zhang, T. Kuila, N. H. Kim, S. H. Lee and J. H. Lee, Carbon, 2015, 89, 328 CrossRef CAS.
- T. Takamura, Y. Sato and Y. Sato, J. Power Sources, 2011, 196, 5774 CrossRef CAS.
- E. O. Fedorovskaya, L. G. Bulusheva, A. G. Kurenya, I. P. Asanov, N. A. Rudina, K. O. Funtov, I. S. Lyubutin and A. V. Okotrub, Electrochim. Acta, 2014, 139, 165 CrossRef CAS.
- X. L. Yu, J. G. Wang, Z. H. Huang, W. C. Shen and F. Y. Kang, Electrochem. Commun., 2013, 36, 66 CrossRef CAS.
- N. P. Liu, J. Shen and D. Liu, Microporous Mesoporous Mater., 2013, 167, 176 CrossRef CAS.
- P. C. Gao, W. Y. Tsai, B. Daffos, P. L. Taberna, C. R. Pérez, Y. Gogotsi, P. Simon and F. Favier, Nano Energy, 2015, 12, 197 CrossRef CAS.
- W. J. Zhou, K. Zhou, X. J. Liu, R. Z. Hu, H. Liu and S. W. Chen, J. Mater. Chem. A, 2014, 2, 7250 CAS.
- Y. J. Ou, C. Peng, J. W. Lang, D. D. Zhu and X. B. Yan, New Carbon Mater., 2014, 29, 209 CrossRef.
- L. G. H. Staaf, P. Lundgren and P. Enoksson, Nano Energy, 2014, 9, 128 CrossRef CAS.
- Z. Jin, X. D. Yan, Y. H. Yu and G. J. Zhao, J. Mater. Chem. A, 2014, 2, 11706 CAS.
- P. J. F. Harris, Z. Liu and K. Suenaga, J. Phys.: Condens. Matter, 2008, 20, 362201 CrossRef.
- M. H. Yu, W. T. Qiu, F. X. Wang, T. Zhai, P. P. Fang, X. H. Lu and Y. X. Tong, J. Mater. Chem. A, 2015, 3, 15792 CAS.
- D. W. Wang, F. Li, M. Liu, G. Q. Lu and H. M. Cheng, Angew. Chem., Int. Ed., 2008, 47, 373 CrossRef CAS PubMed.
- S. S. Hou, B. Xu, G. P. Cao, F. Wu and Y. S. Yang, J. Mater. Chem., 2012, 22, 19088 RSC.
- S. Y. Gao, Y. L. Chen, H. Fan, X. J. Wei, C. G. Hu, H. X. Luo and L. T. Qu, J. Mater. Chem. A, 2014, 2, 3317 CAS.
- Y. Wang, R. Yang, Y. Wei, Z. J. Zhao and M. Li, RSC Adv., 2014, 4, 45318 RSC.
- J. Jiang, Q. Gao, K. Xia and J. Hu, Microporous Mesoporous Mater., 2009, 118, 28 CrossRef CAS.
- P. Hao, Z. H. Zhao, J. Tian, H. D. Li, Y. H. Sang, G. W. Yu, H. Q. Cai, H. Liu, C. P. Wong and A. Umar, Nanoscale, 2014, 6, 12120 RSC.
- Q. H. Liang, L. Ye, Z. H. Huang, Q. Xu, Y. Bai, F. Y. Kang and Q. H. Yang, Nanoscale, 2014, 6, 13831 RSC.
- L. H. Zhu, Q. M. Gao, Y. L. Tan, W. Q. Tian, J. D. Xu, K. Yang and C. X. Yang, Microporous Mesoporous Mater., 2015, 210, 1 CrossRef CAS.
- Y. Lv, L. Gan, M. Liu, W. Xiong, Z. Xu, D. Zhu and D. S. Wright, J. Power Sources, 2012, 209, 152 CrossRef CAS.
- L. F. Chen, Z. H. Huang, H. W. Liang, H. L. Gao and S. H. Yu, Adv. Funct. Mater., 2014, 24, 5104 CrossRef CAS.
- C. L. Long, L. L. Jiang, X. L. Wu, Y. T. Jiang, D. R. Yang, C. K. Wang, T. Wei and Z. J. Fan, Carbon, 2015, 93, 412 CrossRef CAS.
- L. Wei and G. Yushin, Nano Energy, 2012, 1, 552 CrossRef CAS.
- W. J. Si, J. Zhou, S. M. Zhang, S. J. Lia, W. Xing and S. P. Zhuo, Electrochim. Acta, 2013, 107, 397 CrossRef CAS.
- K. LeVan and T. T. L. Thi, Prog. Nat. Sci. Mater. Int., 2014, 24, 191 CrossRef.
- M. J. John and S. Thomas, Carbohydr. Polym., 2008, 71, 343 CrossRef CAS.
- I. O. Oboh and E. O. Aluyor, Afr. J. Agric. Res., 2009, 4, 684 Search PubMed.
- I. O. Mazali and O. L. Alves, An. Acad. Bras. Cienc., 2005, 77, 25 CrossRef CAS PubMed.
- J. H. Shen, Y. M. Xie, X. D. Huang, S. W. Zhou and D. Ruan, J. Mech. Behav. Biomed. Mater., 2012, 15, 141 CrossRef PubMed.
- J. P. Li, S. G. Wang, Y. Q. Ren, Z. H. Ren, Y. J. Qiu and J. Yu, Electrochim. Acta, 2014, 149, 56 CrossRef CAS.
- Y. P. Tong, S. B. Zhao, J. T. Ma, L. Wang, Y. N. Zhang, Y. F. Gao and Y. M. Xie, Constr. Build. Mater., 2014, 71, 327 CrossRef.
- V. O. A. Tanobe, T. H. D. Sydenstricker, M. Munaro and S. C. Amico, Polym. Test., 2005, 24, 474 CrossRef CAS.
- E. Sjöström, Wood—Chemistry-Fundamentals and Applications, Academic Press, San Diego, 1993 Search PubMed.
- A. I. S. Brígida, V. M. A. Calado, L. R. B. Gonçlves and M. A. Z. Coelho, Carbohydr. Polym., 2010, 79, 832 CrossRef.
- K. Bilba, M. A. Arsene and A. Ouensanga, Bioresour. Technol., 2007, 98, 58 CrossRef CAS PubMed.
- S. R. Shukla and R. S. Pai, Bioresour. Technol., 2015, 96, 1430 CrossRef PubMed.
- J. P. Li, Z. H. Ren, Y. Q. Ren, L. Zhao, S. G. Wang and J. Yu, RSC Adv., 2014, 4, 35789 RSC.
- G. N. Yushin, E. N. Hoffman, A. Nikitin, H. H. Ye, M. W. Barsoum and Y. Gogotsi, Carbon, 2005, 43, 2075 CrossRef CAS.
- F. A. S. Dairo, P. A. Aye and T. A. Oluwasola, J. Food, Agric. Environ., 2007, 5, 97 CAS.
- S. Biniak, G. Szymanski, J. Siedlewsk and A. Swiatkowski, Carbon, 1997, 35, 1799 CrossRef CAS.
- D. H. Jurcakova, M. Seredych, G. Q. Lu and T. J. Bandosz, Adv. Funct. Mater., 2009, 19, 438 CrossRef.
- E. Raymundo-Piñero, K. Kierzek, J. Machnikowski and F. Béguin, Carbon, 2006, 44, 2498 CrossRef.
- J. Chmiola, G. Yushin, Y. Gogotsi, C. Porte, P. Simon and P. L. Taberna, Science, 2006, 313, 1760 CrossRef CAS PubMed.
- R. Mysyk, Q. Gao, E. Raymundo-Piñero and F. Béguin, Carbon, 2012, 50, 3367 CrossRef CAS.
- T. Y. Wei, X. L. Wei, Y. Gao and H. M. Li, Electrochim. Acta, 2015, 169, 186 CrossRef CAS.
- D. B. Wang, Z. Geng, B. Li and C. M. Zhang, Electrochim. Acta, 2015, 173, 377 CrossRef CAS.
- C. L. Long, X. Chen, L. L. Jiang, L. J. Zhi and Z. J. Fan, Nano Energy, 2015, 12, 141 CrossRef CAS.
- Z. J. Fan, D. P. Qi, Y. Xiao, J. Yan and T. Wei, Mater. Lett., 2013, 101, 29 CrossRef CAS.
- K. Wang, N. Zhao, S. W. Lei, R. Yan, X. D. Tian, J. Z. Wang, Y. Song, D. F. Xu, Q. G. Guo and L. Liu, Electrochim. Acta, 2015, 166, 1 CrossRef CAS.
- C. P. Ruan, K. L. Ai and L. H. Lu, RSC Adv., 2014, 4, 30887 RSC.
- X. W. Yu, D. B. Ruan, C. C. Wu, J. Wang and Z. Q. Shi, J. Power Sources, 2014, 265, 309 CrossRef CAS.
| This journal is © The Royal Society of Chemistry 2016 |