P. Premaa,
P. A. Iniyaa and
G. Immanuel*b
aResearch Department of Zoology, VHNSN College (Autonomous), Virudhunagar-626 001, Tamilnadu, India
bCentre for Marine Science and Technology, Manonmaniam Sundaranar University, Rajakkamangalam-629502, Kanyakumari District, Tamilnadu, India. E-mail: gimmas@gmail.com; Tel: +91 4652 253078
First published on 14th December 2015
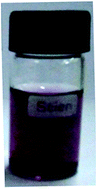
Herein, the microbial mediated synthesis of gold nanoparticles (GNPs) was achieved via an easy biological protocol using Klebsiella pneumoniae (MTCC-4030). Gold ions in the reaction mixture were exposed to K. pneumoniae for the formation of colloidal GNPs. The characterization study indicated that the UV-vis spectral analysis of the GNPs showed a peak at 550 nm. XRD spectroscopy of the GNPs confirmed their crystalline nature. Scanning electron images of the GNPs showed that they were spherical in shape and were well dispersed. Atomic force microscopy revealed that the size range of the GNPs was between 10 and 15 nm. The FTIR study revealed the possible involvement of reductive groups on the surface of the nanoparticles. The antibacterial activity of the GNPs showed the highest inhibitory zone (25.60 mm) against Escherichia coli as an indicator strain. The synergistic effect of the GNPs obtained the highest fold increase (4.06) and activity index (3.210) against E. coli, followed by 2.610 activity index against Staphylococcus aureus using amoxycillin and streptomycin as standard antibiotics, respectively.
Biological synthesis of nanoparticles has emerged as a rapidly developing research area in nanotechnology across the globe with various biological entities being employed in the production of nanoparticles, which constantly form an attractive alternative for conventional methods. From simple prokaryotes to complex eukaryotic organisms, which include higher plants, are used for the fabrication of nanoparticles. The biosynthesis of GNPs has been reported in different prokaryotic organisms, including Bacillus subtilis,6 E. coli,7 Lactobacillus sp.,8 Pseudomonas aeruginosa,9 and Rhodopseudomonas capsulate;10 however, the molecular mechanisms involved in the metal ion reduction that occurs for the synthesis of nanoparticles has not yet been established.
Nanoparticles can act as antibacterial and antifungal agents due to their ability to interact with microorganisms. By exerting their antibacterial properties, nanoparticles can attach to the surface of the cell. This interaction causes structural changes and damage and markedly disturbs vital cell functions such as permeability causing pits and gaps, depressing the activity of respiratory chain enzymes and finally leading to cell death.11 The demonstrated antibacterial activity of nanoparticles suggests its possible application in the food preservation field; however, it can be applied as a potent sanitizing agent for disinfecting and sterilizing food industry equipment and containers against attack and contamination from foodborne pathogenic bacteria.12 In the present study, an attempt has been made on the microbial mediated fabrication of GNPs by the reduction of HAuCl4 ions using K. pneumoniae (MTCC- 4030). The fabricated GNPs were characterized via UV, XRD, SEM, EDS, FTIR and AFM. Finally, the fabricated GNPs were applied in the field of antibacterial and synergistic studies in comparison with known antibiotics.
The UV-visible spectroscopy result revealed that the reaction solution had an absorption maximum at 550 nm, which is attributed to the surface plasmon resonance band (SPR) of gold nanoparticles (Fig. 2). The optical absorption spectrum of the metal nanoparticles was dominated by SPR, which shifted to longer wavelengths with increasing particle size. The reduction of HAuCl4 to GNPs can be identified from the peaks obtained at around 650 nm.16 Likewise, Skirtach et al.,17 reported that the absorption spectrum of GNPs was observed at 560 nm, which were synthesized using P. aeruginosa. It is well known that spherical nanoparticles of Au should exhibit single-surface plasmon bands, whereas anisotropic particles should exhibit two or three bands, which correspond to quadrupole and higher multipole plasmon excitations.18
The FTIR spectrum of the GNPs, which is shown in Fig. 3, has absorption peaks at 1716, 1654, 1639, 1527, 1342, and 1249 cm−1. The strong peak at 1654 cm−1 was identified as CO due to the carbonyl functional group. The peak at 1527 cm−1 showed the characteristic of N–O which is an asymmetric nitro compound. The small band at 1639 cm−1 arose from the –C
C stretching vibrations corresponding to the –C
O due to the carboxylic acid and carbonyl group. The small peak at 1249 cm−1 can be assigned to the C–N of the aliphatic amine group. The presence of the intense peak of the C
O stretching mode indicated the presence of a carboxylic group in the material bound to the GNPs. The lower wavenumbers confirmed that the represented functional groups combined with the GNPs and reduction occurred on that particular surface. Similarly, Sandt et al.19 reported that the FTIR spectrum of another reference strain of K. pneumoniae displayed peaks within the ranges of 763–775, 1053–1085 and 1555–1595 cm−1. Honary et al.15 pointed out that the FTIR spectrum of the nanoparticles indicates the presence of various chemical groups, one of which is an amide. The presence of –COO–, which is possibly due to amino acid residues, may indicate that protein co-exists with the GNPs. An amide I band was observed at 1630 to 1650 cm−1. This was further confirmed by the band at 3406–3412 cm−1. The band at 1626 cm−1 corresponds to amide I due to the carbonyl stretch in proteins.
XRD analysis is mainly undertaken to study the crystalline nature of nanoparticles. The intensive diffraction peak at the 2θ value of 38.20° from the (111) lattice plane of face centered cubic (fcc) gold unequivocally indicates that the particles were made of pure gold, which was broad, whereas the (200) plane was less distinct (2θ = 44.4°). Two additional broad bands were observed at 64.60° (2θ) and 77.60° (2θ) and they correspond to the (220) and (311) planes of gold, respectively (Fig. 4 and Table 1). In the obtained spectrum, the Bragg peak positions and their intensities were compared with the standard JCPDS files (file no. JCPDS 4-0783). The obtained GNPs were found to have an average size of 26 nm with a cubic structure. The fraction between the intensity of the (200), (220) and (311) diffraction peaks was much lower, which suggests that the (111) plane is the predominant orientation.20 Likewise, Prema and Thangapandiyan21 reported that the intensive diffraction peaks at 2θ value of 38.38°, 44.7°, 64.5° and 77.3° corresponding to (111), (200), (220) and (311) lattice plane of face centered cubic (fcc) for unstabilized and stabilized AuNPs respectively. Senapati22 reported that the GNPs produced by Fusarium oxysporum had intense peaks at 38° (111), 45° (200), 67° (220) and 78° (311).
Pos. [° 2Th.] | Height [cts] | FWHM left [° 2Th.] | d-Spacing [Å] | Rel. int. [%] |
---|---|---|---|---|
38.20(1) | 83(24) | 0.33(3) | 2.35380 | 100.00 |
40.93(7) | 9(9) | 0.3(2) | 2.20314 | 11.39 |
44.4(1) | 34(30) | 0.4(1) | 2.03912 | 40.54 |
64.60(9) | 38(34) | 1(1) | 1.44149 | 45.41 |
77.6(2) | 24(80) | 1(1) | 1.22933 | 29.50 |
The morphology of the synthesized GNPs was observed under a scanning electron microscopy (Fig. 5). The scanning electron micrograph indicated that the synthesized particles were small in size and almost spherical in shape and some of them were aggregated. Similarly, Biradar and Lingappa23 revealed that the surface morphology of GNPs adhere to the surface in a scaly pattern. They also observed that smaller sized particles were almost spherical in shape and some of them were aggregated.
Two and three dimensional images of the GNPs were visualized via AFM (Fig. 6 and 7). The images revealed that the synthesized nanoparticles were in the form of spheres. The GNPs were formed in several different sizes, ranging from small to large nanoparticles (10–40 nm). AFM data obtained in the present study revealed that the 3D profile of the GNPs showed strong shape control with a size of around 10–15 nm. Similarly, Srivastava et al.24 reported that the 2D profile obtained by AFM for their GNPs suggested strong shape control with a size of around 50 nm. This strong shape control indicated that apart from the reducing proteins present in the membrane bound fraction (MBF), certain organic groups must be acting as stabilizing agents.
The antibacterial activity of the GNPs was investigated against human bacterial pathogens, such as E. coli, S. epidermidis, S. aureus, P. aeruginosa, and B. subtilis, and the inhibitory zone (mm) result is presented in Table 2. The GNPs gave the highest zone of inhibition (25.68 mm) against E. coli, whereas the lowest zone of inhibition (18.70 mm) was recorded against S. aureus as an indicator strain. Similarly, effective antimicrobial activity against E. coli and S. aureus using GNPs was reported earlier by Kim et al.25
Bacterial pathogens | Zone of inhibition (mean ± SD) |
---|---|
a Each value is the mean ± SD of five individual replicates. | |
E. coli | 25.68 ± 1.50 |
S. epidermidis | 20.70 ± 1.25 |
S. aureus | 18.70 ± 1.22 |
P. aeruginosa | 20.90 ± 0.92 |
B. subtilis | 20.08 ± 1.01 |
The result on the synergistic effect of the GNPs synthesized by K. pneumoniae is given in Table 3. It revealed that a distinct difference is observed between the inhibitory zones by antibiotics with and without GNPs. An enhanced zone of inhibition was observed and it was increased from 9 to 20 mm when the GNPs were incorporated with streptomycin antibiotics against S. aureus. However, the synergistic activity between the GNPs and ampicillin, gentamycin, kanamycin, streptomycin and vancomycin was subsequently shown to be greater against E. coli and P. aeruginosa than against S. aureus. The highest fold increase (4.06) was observed against P. aeruginosa, followed by a 3.52 fold increase, which was observed while using the combination of GNPs and streptomycin against B. subtilis. Two way ANOVA for the data on the fold increase of the GNPs against the selected bacterial pathogens revealed that the obtained data are statistically significant between antibiotics with GNPs and bacterial pathogens (F = 13.24 and 4.47; P < 0.05). The zone of inhibition showed an increase in activity index for all the cases with a range between 1.10 and 2.25. The highest activity index (3.21) was observed against E. coli using amoxicillin as the standard antibiotic, followed by 2.61 activity index, which was observed against S. aureus compared with streptomycin (Table 4). Two way ANOVA for the data on the activity index of the GNPs against selected bacterial pathogens revealed that the obtained data are statistically significant between antibiotics with GNPs and bacterial pathogens (F = 11.39 and 3.45; P < 0.05). The present findings corroborate the report of Shahverdi et al.,26 who stated that there was an increase in the synergistic effects of penicillin G, amoxycillin, erythromycin, clindamycin and vancomycin in combination with mycosynthesized GNPs against E. coli, P. aeruginosa, and S. aureus. Fayaz et al.27 also reported an increase in the antibacterial activity of ampicillin, kanamycin, erythromycin and chloramphenicol in combination with AuNPs against S. typhi, E. coli, S. aureus and Micrococcus luteus. Similarly, Agnihotri et al.28 suggested that combined antibiotic therapy produces synergistic effects in the treatment of bacterial infections and has been shown to delay the emergence of antimicrobial resistance.
Pathogens | Antibiotics (μg per disc) | Zone of inhibition (mm) | Increased zone size (mm) | |
---|---|---|---|---|
Antibiotics alone | Antibiotics + GNPs | |||
a Each value is the mean ± SD of five individual replicates.b Values in parentheses indicate the fold increase of the zone of inhibition. | ||||
E. coli | Amoxycillin (30 μg) | 8.00 ± 0.63 | 13.00 ± 0.71 | 5.00 ± 1.41 (1.640 ± 0.013)b |
Amikacin (30 μg) | 11.00 ± 1.41 | 17.00 ± 1.41 | 6.00 ± 1.79 (1.390 ± 0.007) | |
Streptomycin (10 μg) | 10.00 ± 0.63 | 16.00 ± 1.27 | 6.00 ± 1.41 (1.560 ± 0.012) | |
Vancomycin (30 μg) | 16.00 ± 1.27 | 19.00 ± 0.89 | 3.00 ± 1.26 (0.410 ± 0.010) | |
S. epidermidis | Amoxycillin (30 μg) | 9.00 ± 1.41 | 14.00 ± 1.41 | 5.00 ± 1.79 (1.420 ± 0.007) |
Amikacin (30 μg) | 12.00 ± 1.26 | 16.00 ± 1.27 | 4.00 ± 1.41 (0.790 ± 0.006) | |
Streptomycin (10 μg) | 10.00 ± 0.63 | 16.00 ± 1.41 | 6.00 ± 1.79 (1.560 ± 0.013) | |
Vancomycin (30 μg) | 18.00 ± 1.60 | 22.00 ± 1.79 | 4.00 ± 1.41 (0.490 ± 0.005) | |
S. aureus | Amoxycillin (30 μg) | 9.00 ± 1.41 | 18.00 ± 1.60 | 9.00 ± 0.63 (3.000 ± 1.337) |
Amikacin (30 μg) | 10.00 ± 0.63 | 18.00 ± 1.79 | 8.00 ± 0.89 (2.240 ± 0.008) | |
Streptomycin (10 μg) | 9.00 ± 0.63 | 20.00 ± 2.83 | 11.00 ± 1.41 (3.040 ± 0.009) | |
Vancomycin (30 μg) | 17.00 ± 1.41 | 23.00 ± 1.26 | 6.00 ± 1.79 (0.830 ± 0.004) | |
P. aeruginosa | Amoxycillin (30 μg) | 8.00 ± 0.63 | 18.00 ± 1.79 | 10.00 ± 0.63 (4.060 ± 0.008) |
Amikacin (30 μg) | 11.00 ± 1.41 | 17.00 ± 1.41 | 6.00 ± 1.41 (1.390 ± 0.007) | |
Streptomycin (10 μg) | 8.00 ± 0.89 | 18.00 ± 1.60 | 10.00 ± 0.89 (4.060 ± 0.005) | |
Vancomycin (30 μg) | 14.00 ± 1.41 | 16.00 ± 1.27 | 2.00 ± 1.26 (0.310 ± 0.007) | |
B. cereus | Amoxycillin (30 μg) | 10.00 ± 1.79 | 19.00 ± 0.89 | 9.00 ± 0.63 (2.610 ± 0.014) |
Amikacin (30 μg) | 12.00 ± 1.26 | 19.00 ± 0.63 | 7.00 ± 0.89 (1.510 ± 0.007) | |
Streptomycin (10 μg) | 8.00 ± 0.89 | 17.00 ± 1.41 | 9.00 ± 1.41 (3.520 ± 0.014) | |
Vancomycin (30 μg) | 14.00 ± 1.41 | 20.00 ± 2.83 | 6.00 ± 1.79 (1.040 ± 0.006) |
Antibiotics | Activity index/pathogens | ||||
---|---|---|---|---|---|
E. coli | S. epidermidis | S. aureus | P. aeruginosa | B. cereus | |
a Each value is the mean ± SD of five individual replicates. | |||||
Amoxycillin (30 μg) | 3.210 ± 0.010 | 2.300 ± 0.126 | 2.080 ±![]() |
2.610 ± 0.010 | 2.010 ± 0.013 |
Amikacin (30 μg) | 2.330 ± 0.006 | 1.730 ± 0.006 | 1.870 ± 0.014 | 1.900 ± 0.048 | 1.670 ± 0.017 |
Streptomycin (10 μg) | 2.570 ± 0.015 | 2.070 ± 0.015 | 2.080 ± 0.029 | 2.610 ± 0.006 | 2.510 ± 0.010 |
Vancomycin (30 μg) | 1.610 ± 0.007 | 1.150 ± 0.006 | 1.100 ± 0.049 | 1.490 ± 0.007 | 1.430 ± 0.011 |
The average size of the particles was estimated using the following Debye Scherrer equation:
D = Kλ/β![]() ![]() |
Fold increase = b2 − a2/a2 |
This journal is © The Royal Society of Chemistry 2016 |