Poly(diallyldimethylammonium chloride)–cellulose nanocrystals supported Au nanoparticles for nonenzymatic glucose sensing
Lili Donga,
Xiuqiang Zhanga,
Suxia Rena,
Tingzhou Lei*a,
Xiuxuan Sunb,
Yadong Qic and
Qinglin Wu*ab
aHenan Key Laboratory of Biomass Energy, Zhengzhou, Henan 450008, China. E-mail: leitingzhou@163.com; qwu@agcenter.lsu.edu
bSchool of Renewable Natural Resources, Louisiana State University Agricultural Center, Baton Rouge, LA 70803, USA
cCollege of Science and Agriculture, Southern University Baton Rouge, LA 70813, USA
First published on 11th January 2016
Abstract
Poly(diallyldimethylammonium chloride)–cellulose nanocrystal (PDDA–CNC) supported Au nanohybrids were prepared by in situ deposition, via the self-assembly between negative Au precursor and positively charged functional groups of PDDA–CNC. The Au/PDDA–CNC nanohybrids were characterized for their structural properties and for glucose sensing. Characterization studies show that the synthesis protocol led to well distribution of Au nanoparticles with a mean particle size varying from 3.5 to 8.4 nm on the PDDA–CNC support matrix depending on the Au concentration. The 5Au/PDDA–CNCs (i.e., Au loading level of 5 wt%) exhibited the best glucose sensing ability with a low detection limit of 2.4 μM (S/N = 3), high sensitivity of 62.8 μA mM−1 cm−2, a linear detection range from 0.004 mM to 6.5 mM, which was ascribed to the moderate size and dispersity of the Au nanoparticles. Further investigation revealed that the 5Au/PDDA–CNC nanohybrids also showed high selectivity and stability. These results suggest a new utilization route of CNCs decorated with metal nanoparticles in electrochemical biosensing.
Introduction
Cellulose, one of the world's most abundant renewable organic material, is widely present in trees, plants, animals, and bacteria.1 Cellulose nanocrystals (CNCs), extracted from cellulose fibers, are currently attracting a great deal of attention owing to their well-defined size and morphology, controlled surface property, low cost, biodegradability and biocompatibility.2 The CNCs possess a good colloidal stability in water because of the electron-rich feature of hydroxyl and sulfate ester groups on their surface.3 The CNCs also tend to form an open porous network structures through inter-particle hydrogen bonds.4,5 These properties render CNCs suitable to serve as catalyst support for metal nanoparticles (NPs). Several studies on the use of CNCs as a support matrix for Ag, Au, Pt and Pd NPs have been reported.6–10Among the various metal NPs, Au NPs, considering their potential applications in catalysis, optoelectronics, biomedicine and sensors, have attracted a considerable attention owing to their unique catalytic properties, controllable optical properties, efficient electron transfer performance and good biocompatibility.11,12 Recently, several applications of the bioinorganic hybrid nanocomposites consisting of Au NPs on CNCs have been reported. Wu et al. prepared Au NP–CNC nanohybrid using CNCs as both reducing agent and supporter.8 The Au NP–CNC nanohybrids showed excellent catalytic activity and stability for the reduction of 4-nitrophenol. Mahmoud et al. reported the nanocomposite consisting of CNCs functionalized with Au NPs serving as an excellent support for cyclodextrin glycosyl transferase and alcohol oxidase.13 This catalytic platform exhibits significant biocatalytic activity with excellent enzyme stability and without apparent loss of the original activity, suggesting the application of Au NPs/CNC in enzyme immobilization. Prior to our work, however, the application of Au NPs/CNC nanohybrids in electrochemical glucose sensing have not been exploited so far.
In this study, we report an efficient and controllable route for in situ deposition of Au NPs on CNCs functionalized with PDDA. The Au NPs with small size and uniform dispersion, and controlled loading amount were achieved. The as-prepared PDDA–CNC and Au/PDDA–CNC nanohybrids were characterized in detail with X-ray photoelectron spectroscopy (XPS), zeta potentials, Fourier transform infrared spectra (FTIR), UV-Visible spectra, transmission electron microscopy (TEM), and X-ray diffraction (XRD) techniques. Glucose electrochemical sensing ability of Au/PDDA–CNC nanohybrids was investigated using cyclic voltammetry and chronoamperometry. Functions of PDDA modified CNC support matrix in promoting the electrocatalytic activity were also discussed.
Experimental
Materials
Raw materials for the study included bleached wood pulp (W-50 grade of KC Flock, Nippon Paper Chemicals Co., Ltd., Tokyo, Japan), poly(diallyldimethylammonium chloride) (PDDA, 20 wt% in water, MW = 25![[thin space (1/6-em)]](https://www.rsc.org/images/entities/char_2009.gif) 000–30
000–30![[thin space (1/6-em)]](https://www.rsc.org/images/entities/char_2009.gif) 000), chloroauric acid, sodium borohydride, D-(+)-glucose, ascorbic acid and uric acid (Sigma-Aldrich, St. Louis, MO, USA), sodium chloride, sodium hydroxide, potassium chloride, sulfuric acid potassium ferricyanide and potassium ferrocyanide (Sinopharm Chemical Regent Co., Ltd., Shanghai, China). Deionized water with a resistivity of 18.2 MΩ cm (Milli-Q Integral A10, Merck KGaA, Darmstadt, Germany) was used throughout the experiments.
000), chloroauric acid, sodium borohydride, D-(+)-glucose, ascorbic acid and uric acid (Sigma-Aldrich, St. Louis, MO, USA), sodium chloride, sodium hydroxide, potassium chloride, sulfuric acid potassium ferricyanide and potassium ferrocyanide (Sinopharm Chemical Regent Co., Ltd., Shanghai, China). Deionized water with a resistivity of 18.2 MΩ cm (Milli-Q Integral A10, Merck KGaA, Darmstadt, Germany) was used throughout the experiments.
Functionalization of cellulose nanocrystals by PDDA
CNCs were prepared from bleached wood pulp as described in our previous paper.14 The functionalization of CNCs with PDDA is described as follows. In brief, 200 mL of CNC suspension (0.05 wt%) mixed with 5 mL of PDDA (20 wt%) were sonicated for 1.5 h and stirred for 24 h. Then, 1 g NaCl was added to promote the functionalization and stirred for another 24 h. The suspension was centrifuged and washed with distilled water for several times to remove excess PDDA and NaCl. The PDDA-functionalized CNCs were denoted as PDDA–CNCs, and were kept at 4 °C before use.In situ deposition of Au NPs on PDDA–CNC
In situ deposition of Au NPs at loading levels of 1, 3, 5, and 7 wt% on PDDA–CNCs was obtained by a sodium borohydride reduction method. Typically, 100 mg of PDDA–CNCs dispersed in 200 mL of distilled water were mixed with a stoichiometric amount of HAuCl4. The suspension was sonicated for 1 h until being uniformly mixed. An aqueous solution of NaBH4 (30 mL, 0.1 M) was then added dropwise into the suspension under magnetic stirring. After being stirred for 2 h, the suspension was placed in regenerated cellulose dialysis tubing (Fisher Scientific, Pittsburgh, PA, USA) and dialyzed against distilled water for several days until the suspension conductivity reached a stable value. The obtained products were denoted as 1, 3, 5, or 7Au/PDDA–CNCs and kept at 4 °C before use.Characterization
The surface composition and chemistry of the Au/PDDA–CNC nanohybrids were investigated using X-ray photoelectron spectroscopy (XPS) with an AXIS ULTRA DLD X-ray photoelectron spectrometer (Kratos, Manchester, UK). The zeta potentials of the samples in aqueous suspension (0.01 wt%) were measured using a zeta potential analyzer (Nanotrac wave, Microtrac Inc., Montgomeryville, PA, USA). Fourier transform infrared (FTIR) spectra were collected from samples in KBr over the frequency range of 4000 to 400 cm−1 at a resolution of 4 cm−1 on the Nicolet iS10 FTIR spectrophotometer (Thermo Fisher Scientific, Waltham, MA, USA). The ultraviolet visible (UV-Vis) spectra were recorded on a U-3900 spectrophotometer (Hitachi, Tokyo, Japan) at room temperature. The Au contents were detected through a Thermo iCAP 6300 inductively coupled plasma atomic emission spectrometer (ICP-AES, Thermo Fisher Scientific, Waltham, MA, USA). The morphology of Au/PDDA–CNC nanohybrids was examined using a transmission electron microscope (TEM, JEOL 100CX, JEOL, Inc., Peabody, MA, USA) with an accelerating voltage of 80 kV. TEM samples were prepared by drying uranyl acetate stained a droplet (5 μL at about 0.05 wt%) of sample suspensions on the surface of carbon-coated copper grids. High resolution TEM (HRTEM) images were taken with JEOL JEM-2011 HRTEM (JEOL, Inc., Peabody, MA, USA) operated at 160 kV to characterize the lattice structure of the Au NPs. The crystalline structure of Au/PDDA–CNC nanohybrids was identified by an D8 Advance X-ray diffractometer (Bruker, Karlsruhe, Germany).Electrochemical measurement
Electrochemical measurements were performed on a CHI760E (CH Instrument, Shanghai, China) electrochemical workstation in a conventional three-electrode system at room temperature. A bare or modified glass carbon electrode (GCE, 3.0 mm in diameter) was used as the working electrode. A platinum wire and an Ag/AgCl electrode were used as counter and reference electrodes, respectively. Before use, the GCE was polished with 0.3 and 0.05 μm alumina powder, and sonicated in deionized water and ethanol for 10 min. The GCE was modified by coating 5 μL of sample suspension. The cyclic voltammograms of the working electrode were conducted in a solution containing 0.1 M KCl and 1 mM [Fe(CN)6]3−/4− at a scan rate of 50 mV s−1. The electrocatalytic behavior of the modified electrode was investigated by cyclic voltammetry in 0.1 M NaOH containing 10 mM glucose at 50 mV s−1. Chronoamperometry was performed at an applied potential of 0.2 V under 300 rpm magnetic stirring with glucose added stepwise.Results and discussion
Characterization of CNC, PDDA–CNC and Au/PDDA–CNC samples
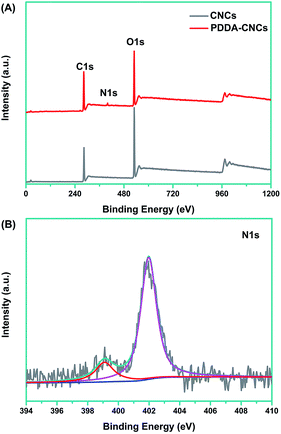
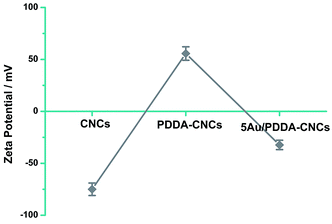
X-ray photoelectron spectroscopy (XPS) measurement was used to prove the functionalization of CNCs with PDDA. As shown in Fig. 1A, for the original CNC sample, two major emissions at 286.6 and 531 eV were assigned to the binding energy of C 1s and O 1s, respectively.15 Compared with the spectrum of CNCs, an N 1s peak appeared in PDDA–CNCs, which came from the PDDA chains wrapped on the surface of CNCs. For the high resolution N 1s spectrum of PDDA–CNCs (Fig. 1B), the major peak centered at around 402 eV was attributed to the charged nitrogen, N+, and the shoulder peak at 399 eV might be due to the uncharged side product.16 The XPS results confirmed the successful functionalization of CNCs with PDDA.The zeta potential data to further confirm the functionalization of CNCs with PDDA are shown in Fig. 2. The CNC sample shows a negative zeta potential of −75 mV due to the sulfate ester groups (–O–SO3–) on CNCs.14 PDDA is an strong cationic polyelectrolyte, and possesses positive charge when being dispersed in water. The zeta potential value changed to a positive value for PDDA–CNCs, indicating that the surface of CNCs was wrapped with positively charged PDDA molecules. The positive ammonium cationic groups of PDDA function as anchor sites to AuCl4− by electrostatic attraction, promising a uniform deposition of Au NPs by in situ reduction. The zeta potential changed to a negative value after of negatively charged Au NPs. The change of the surface charge state of PDDA–CNCs further confirming the functionalization of CNCs with PDDA.
FTIR data to demonstrate chemical structures change of CNCs during treatments, are shown in Fig. 3. The FTIR spectrum of CNCs exhibited a typical characteristic of cellulose. The representative peaks located around 3200–3500 cm−1 (O–H stretching), 2850–3000 cm−1 (C–H stretching), and 1060–1162 cm−1 (C–O and C–O–C stretching) can be seen clearly.9 For PDDA–CNC and 5Au/PDDA–CNC samples, the characteristic stretching bands remained almost the same as CNCs, demonstrating that the functionalization of PDDA and deposition of Au NPs on CNCs did not change the structure of CNCs. It was also noticed that the representative peaks of PDDA at 1120 cm−1 (N–C stretching) is generally obscured by the CNC bands in the spectra of PDDA/CNCs and 5Au/PDDA/CNCs.17
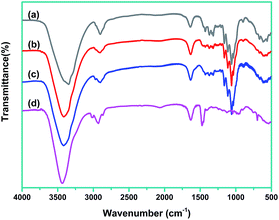 | ||
| Fig. 3 FTIR spectra of tested materials. Curve (a) CNCs, curve (b) PDDA–CNCs, curve (c) 5Au/PDDA–CNCs, and curve (d) PDDA. | ||
The formation of Au NPs can be indicated by the UV-Vis spectra and accompanied color change of the PDDA–CNC aqueous suspensions, before and after deposition with different amount of Au NPs. As shown in Fig. 4A, the PDDA–CNC aqueous suspension was almost transparent and no absorption peak was recorded in the spectrum. After deposition of Au NPs, the color of PDDA–CNC suspension changed from pink to red with increased amount of Au NPs, which is indicative of the formation of Au NPs. The Au contents in 1Au/PDDA–CNCs, 3Au/PDDA–CNCs, 5Au/PDDA–CNCs and 7Au/PDDA–CNCs measured by ICP-AES were approximately 1.01, 2.97, 5.07 and 7.12 wt%, respectively. In addition, the Au/PDDA/CNC aqueous suspensions exhibited absorption bands at around 510 nm, which was due to the surface plasmon resonance (SPR) absorption of deposited Au NPs (Fig. 4B). Moreover, the SPR absorption band shifted from 507 to 512 nm with increased amount of Au NPs, indicating the increased size of Au NPs, which was further evidenced by following TEM characterization.
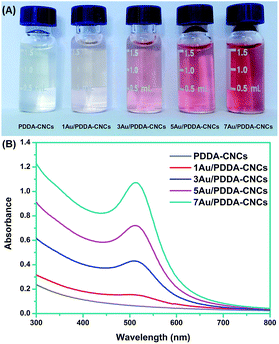 | ||
| Fig. 4 Digital image of PDDA–CNC aqueous suspension (A) and their corresponding UV-Vis absorption spectra (B) before and after deposition with different amount of Au NPs. | ||
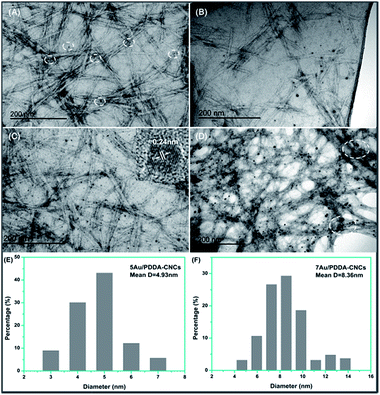
The morphology of the Au/PDDA/CNC nanohybrids with different amount of Au NPs are shown in Fig. 5. The rod-like CNCs were about 200 nm in length and about 20 nm in width, and formed an open porous network structure. For 1Au/PDDA/CNC nanohybrids, few Au NPs were observed from the images shown in Fig. 5A, due to the extremely low content of Au NPs. The Au NPs had a uniform particle size of about 3.5 nm. For 3Au/PDDA/CNC nanohybrids (Fig. 5B), more Au NPs were seen. The size of Au NPs increased and several large particles were observed as well. For 5Au/PDDA/CNC nanohybrid (Fig. 5C), uniform and monodispersed Au NPs were obtained, and the HRTEM image (inset in Fig. 5C) shows a lattice spacing of 0.24 nm, which corresponded to the Au (111) crystal plane. The measured particle size distribution is shown in Fig. 5E. The average size of Au NPs was calculated as 4.9 nm based on the measurements of 200 particles. For 7Au/PDDA/CNC nanohybrids (Fig. 5D), larger Au NPs were observed. From the particle size distribution histograms (Fig. 5F), it can be seen that the Au NPs size distribution was wider, and the average particle size increased to 8.4 nm.
To further investigate the crystalline structure, the CNC, PDDA–CNC and Au/PDDA–CNC samples were characterized by XRD measurements. As shown in Fig. 6A, all the patterns showed three strong peaks at 2θ values of 15.2°, 16.5°, 22.7° and 34.5°, corresponding to the (1![[1 with combining macron]](https://www.rsc.org/images/entities/char_0031_0304.gif) 0), (110), (200) and (004) diffraction planes of CNCs, respectively.18 For 1Au/PDDA–CNC and 3Au/PDDA–CNC samples, only one weak peak at 38.2° that assigned to the (111) lattice plane of Au was detected due to the extremely low Au concentrations on PDDA–CNCs. Other characteristic peaks of cubic Au at 44.4°, 64.7° and 77.6° can be obviously observed on the XRD patterns of 5Au/PDDA–CNC and 7Au/PDDA–CNC samples, indexed as (200), (220) and (311) lattice planes for cubic Au.19 The Au oxidation state data in 5Au/PDDA–CNCs analyzed by XPS analysis are shown in Fig. 6B. Two peaks were observed at 83.9 eV and 87.6 eV, which correspond to Au 4f7/2 and Au 4f5/2, resepectively.20 The peak to peak distance of 3.7 eV between Au 4f7/2 and Au 4f5/2 confirmed the zero valent oxidation state of deposited Au NPs.21 On the other hand, no characteristic binding energy of Au3+ and Au+ was observed, indicating the completely reduction of Au3+ to Au(0).
0), (110), (200) and (004) diffraction planes of CNCs, respectively.18 For 1Au/PDDA–CNC and 3Au/PDDA–CNC samples, only one weak peak at 38.2° that assigned to the (111) lattice plane of Au was detected due to the extremely low Au concentrations on PDDA–CNCs. Other characteristic peaks of cubic Au at 44.4°, 64.7° and 77.6° can be obviously observed on the XRD patterns of 5Au/PDDA–CNC and 7Au/PDDA–CNC samples, indexed as (200), (220) and (311) lattice planes for cubic Au.19 The Au oxidation state data in 5Au/PDDA–CNCs analyzed by XPS analysis are shown in Fig. 6B. Two peaks were observed at 83.9 eV and 87.6 eV, which correspond to Au 4f7/2 and Au 4f5/2, resepectively.20 The peak to peak distance of 3.7 eV between Au 4f7/2 and Au 4f5/2 confirmed the zero valent oxidation state of deposited Au NPs.21 On the other hand, no characteristic binding energy of Au3+ and Au+ was observed, indicating the completely reduction of Au3+ to Au(0).
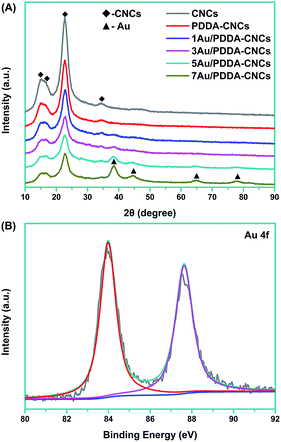 | ||
| Fig. 6 XRD patterns of CNCs, PDDA–CNCs and Au/PDDA–CNCs (A), and XPS spectrum of Au 4f in 5Au/PDDA–CNCs (B). | ||
Electrochemical measurements
To study the interface properties of surface modified electrode, cyclic voltammetric behavior was investigated in a solution containing 0.1 mM [Fe(CN)6]3−/4− and 0.1 M KCl. As shown in Fig. 7, the CV curve of bare GCE offered a well-defined reversible redox behavior attributed to highly electro-transfer between [Fe(CN)6]3−/4− solution and the electrode. After the surface modification of GCE with CNCs, the peak current reduced about 44%, indicating the strong blocking effect of CNCs. However, the peak potentials and peak to peak potential (ΔEp = 75 mV) remained the same, which was due to a pinhole effect that [Fe(CN)6]3−/4− can diffuse in to the electrode surface through pores (as indicated in Fig. 5).22 As for the 1, 3, 5, or 7Au/PDDA–CNC samples modified GCE, the peak potentials showed an negative shift of 40 mV compared to the bare GCE and CNC modified GCE, which are consistent with a one-electron transfer within the PDDA–CNC membrane.22 More importantly, the Au/PDDA–CNC samples modified GCE exhibited increased current density and narrowed ΔEp of 60 mV compared to the bare GCE and CNC modified GCE, confirming the enhanced electrochemical activity and electron transport efficiency. The Au NPs and PDDA co-modified CNCs tended to form percolated conducting porous membranes, which greatly reduced the mass transfer resistance and enhanced electrical conductivity. It should be noted that the current density increased gradually as Au content increased for 1, 3, or 5Au/PDDA–CNC samples modified GCE. However, further increasing the Au content resulted in a reversed change in the current density. The low current density of 1Au/PDDA–CNC/GCE and 3Au/PDDA–CNC/GCE was due to the less active sites resulted from the low content of Au NPs. It was reported that the activity of Au NPs was strongly affected by the particle size.11 Thus, the decreased current density of 7Au/PDDA–CNC/GCE was ascribed to the larger particle size (as shown in Fig. 5). These results indicate that the moderate size and dispersity of Au NPs in 5Au/PDDA–CNC/GCE led to more active sites than the other samples, and thus resulted in the best catalytic activity.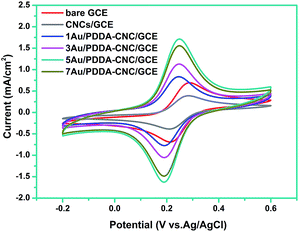 | ||
| Fig. 7 Cyclic voltammograms of bare GCE, CNC/GCE and (1, 3, 5, 7)Au/PDDA–CNC/GCE in a solution containing 1 mM [Fe(CN)6]3−/4− and 0.1 M KCl. | ||
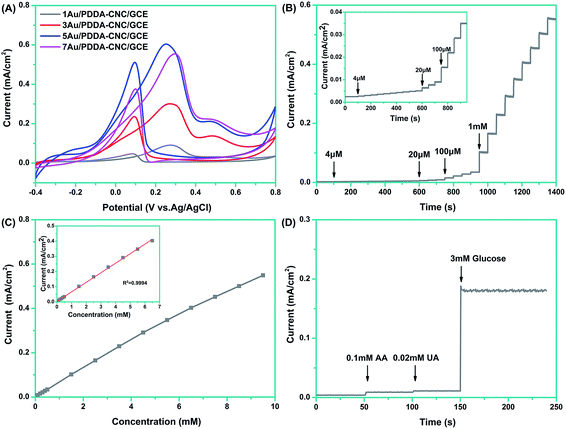
The electrochemical activities of different electrodes toward glucose sensing were investigated by cyclic voltammetry in 0.1 M NaOH with 10 mM glucose at a scan rate of 50 mV s−1. As shown in Fig. 8A, all four of the electrodes presented similar CV curves. In the positive-going scan, the shoulder peak around 0.02 V was ascribed to the adsorption of glucose on electrodes and the formation of gluconolactone.23 As the potential was swept more positively, enhanced oxidation peak appeared at about 0.27 V, owing to the further oxidation of gluconolactone.24 Actually, the glucose oxidation occurred with the formation of active AuOH species, and the number of AuOH sites strongly affected the glucose oxidation peak density. At the low potential around 0.02 V, the limited formation of AuOH sites resulted in the low glucose oxidation current. Then, the number of AuOH sites increased as potential shifts to more positively, which led to the enhanced glucose oxidation current.25 The current density dropped when the potential was larger than 0.27 V due to the formation of gold oxides which leads to the decreased AuOH sites and suppressed oxidation of glucose. In the negative-going scan, the reduction of gold oxides provided enough AuOH sites, leading to the sharp increase of current density. The onset potentials of Au/PDDA–CNC/GCE were more negative when Au contents increased from 1 wt% to 5 wt%, while further increasing Au content to 7 wt% results in an inverse change in the onset potential. In addition, the 5Au/PDDA–CNC/GCE exhibited the highest anodic peak current of 0.604 mA cm−2 and the most negative peak potential of 0.252 V, compared to the corresponding values of 1Au/PDDA–CNC/GCE (0.091 mA cm−2, 0.275 V), 3Au/PDDA–CNC/GCE (0.234 mA cm−2, 0.270 V), and 7Au/PDDA–CNC/GCE (0.554 mA cm−2, 0.297 V). These results confirmed that the 5Au/PDDA–CNC/GCE possessed the best capacity toward electrochemical glucose biosensing, which was ascribed to its more active sites than other samples as previously discussed.
The 5Au/PDDA–CNC/GCE was further analyzed by chronoamperometry to evaluate the sensitivity of the glucose biosensor. Fig. 8B shows the steady state amperometric responses of 5Au/PDDA–CNC/GCE with successive additions of glucose into constantly stirred NaOH solution every 50 s at an applied potential of 0.2 V. It is apparent that the response current time was within 5 s to reach 95% of the steady-state current, indicating rapid and sensitive detection. The linear relationships between the current density and the standard glucose concentration are shown in Fig. 8C. In the glucose concentration range from 4 μM to 6.5 mM, the 5Au/PDDA–CNC/GCE exhibited a good linear amperometric response to the glucose concentration with a sensitivity of 62.8 μA mM−1 cm−2 (R2 = 0.9994, inset of Fig. 8C). The detection limit was calculated to be 2.4 μM at a signal-to-noise (S/N) ratio of 3. The performance of 5Au/PDDA–CNCs electrode was compared with other electrodes used for non-enzymatic glucose sensors, as listed in Table 1. The 5Au/PDDA–CNCs electrode exhibited comparable glucose sensing ability in terms of detection limit, sensitivity and linear range, demonstrating that cellulose supported Au NPs nanohybrids were promising for non-enzymatic glucose sensing.
| Electrode | Detection limit (μM) | Sensitivity (μA mM−1 cm−2) | Linear range (mM) | Ref. |
|---|---|---|---|---|
| CNT/GNB | 230 | — | 0.1–10 | 26 |
| Lamellar ridge–Au | 0.87 | 29.0 | 0.002–23 | 27 |
| AuNP/GONR/CS | 5 | 59.1 | 0.005–4.92 | 28 |
| 31.4 | 4.92–10 | |||
| Pt/MWCNTs–GO | 387 | 11.1 | 1–7 | 29 |
| Macroporous Au–Pt | 25 | 39.5 | 1–20 | 30 |
| PtNi–ERGO | 10 | 20.4 | 0.01–35 | 31 |
| 5Au/PDDA–CNCs | 2.4 | 62.8 | 0.004–6.5 | This work |
It is recognized that one of the analytical parameters for a glucose sensor was its ability to discriminate between the interfering species present in similar physiological environment.32 The selectivity of the 5Au/PDDA–CNC/GCE was evaluated through the chronoamperometric response upon the sequential additions of 0.1 mM AA, 0.02 mM UA and 5 mM glucose at an applied potential of 0.2 V. As illustrated in Fig. 8D, the response signals of AA and UA are negligible for glucose determination, suggesting the high selectivity of the glucose sensor. The use of a lower operating potential of 0.2 V minimized the responses of AA and UA. Thus, the well-defined cathodic glucose response can be obtained with a high sensitivity.27
Conclusions
In this study, PDDA functionalized CNCs were prepared and employed as support matrix for in situ deposition of Au NPs. Au NPs with uniform particle size and high dispersity were formed on the positively charged surface of PDDA–CNCs by NaBH4 reduction. The Au/PDDA–CNC nanohybrids were investigated for electrochemical glucose biosensing, and the 5Au/PDDA–CNCs showed the best capacity due to the moderate particle size and dispersity of Au NPs. These results imply that CNCs modified with appropriate polymer is a superb support matrix for other metal NPs. Considering easy acquisition and modification of CNCs, the present work provides a simple design route of CNC-based organic/inorganic nanohybrids for potential applications in areas of electrochemical catalysis, biomedicine, and antibacterial materials.Acknowledgements
This work was financially supported by Henan Key Laboratory of Biomass Energy in China and by the USDA National Institute of Food and Agriculture McIntire Stennis project [1000017].References
- P. Tingaut, T. Zimmermann and G. Sebe, J. Mater. Chem., 2012, 22, 20105–20111 RSC.
- Y. Habibi, L. A. Lucia and O. J. Rojas, Chem. Rev., 2010, 110, 3479–3500 CrossRef CAS PubMed.
- R. Xiong, C. Lu, W. Zhang, Z. Zhou and X. Zhang, Carbohydr. Polym., 2013, 95, 214–219 CrossRef CAS PubMed.
- R. J. Moon, A. Martini, J. Nairn, J. Simonsen and J. Youngblood, Chem. Soc. Rev., 2011, 40, 3941–3994 RSC.
- B. Schyrr, S. Pasche, G. Voirin, C. Weder, Y. C. Simon and E. J. Foster, ACS Appl. Mater. Interfaces, 2014, 6, 12674–12683 CAS.
- T. Niu, J. Xu, W. Xiao and J. Huang, RSC Adv., 2014, 4, 4901–4904 RSC.
- A. R. Lokanathan, K. M. A. Uddin, O. J. Rojas and J. Laine, Biomacromolecules, 2013, 15, 373–379 CrossRef PubMed.
- X. Wu, C. Lu, Z. Zhou, G. Yuan, R. Xiong and X. Zhang, Environ. Sci.: Nano, 2014, 1, 71–79 RSC.
- X. Wu, C. Lu, W. Zhang, G. Yuan, R. Xiong and X. Zhang, J. Mater. Chem. A, 2013, 1, 8645–8652 CAS.
- J. Cai, S. Kimura, M. Wada and S. Kuga, Biomacromolecules, 2008, 10, 87–94 CrossRef PubMed.
- M. C. Daniel and D. Astruc, Chem. Rev., 2004, 104, 293–346 CrossRef CAS PubMed.
- Y. C. Yeh, B. Creran and V. M. Rotello, Nanoscale, 2012, 4, 1871–1880 RSC.
- K. A. Mahmoud, K. B. Male, S. Hrapovic and J. H. T. Luong, ACS Appl. Mater. Interfaces, 2009, 1, 1383–1386 CAS.
- X. Sun, Q. Wu, S. Ren and T. Lei, Cellulose, 2015, 22, 1123–1133 CrossRef CAS.
- N. Lin and A. Dufresne, Macromolecules, 2013, 46, 5570–5583 CrossRef CAS.
- S. Wang, X. Wang and S. P. Jiang, Phys. Chem. Chem. Phys., 2011, 13, 6883–6891 RSC.
- E. Lam, S. Hrapovic, E. Majid, J. H. Chong and J. H. T. Luong, Nanoscale, 2012, 4, 997–1002 RSC.
- Y. Shin, I.-T. Bae, B. W. Arey and G. J. Exarhos, J. Phys. Chem. C, 2008, 112, 4844–4848 CAS.
- R. Xiong, Y. Wang, X. Zhang, C. Lu and L. Lan, RSC Adv., 2014, 4, 6454–6462 RSC.
- P. Nayak, P. N. Santhosh and S. Ramaprabhu, RSC Adv., 2014, 4, 41670–41677 RSC.
- D. V. Leff, L. Brandt and J. R. Heath, Langmuir, 1996, 12, 4723–4730 CrossRef CAS.
- M. J. Bonné, K. J. Edler, J. G. Buchanan, D. Wolverson, E. Psillakis, M. Helton, W. Thielemans and F. Marken, J. Phys. Chem. C, 2008, 112, 2660–2666 Search PubMed.
- G. X. Zhong, W. X. Zhang, Y. M. Sun, Y. Q. Wei, Y. Lei, H. P. Peng, A. L. Liu, Y. Z. Chen and X. H. Lin, Sens. Actuators, B, 2015, 212, 72–77 CrossRef CAS.
- Y. Fu, F. Liang, H. Tian and J. Hu, Electrochim. Acta, 2014, 120, 314–318 CrossRef CAS.
- L. A. Larew and D. C. Johnson, J. Electroanal. Chem. Interfacial Electrochem., 1989, 262, 167–182 CrossRef CAS.
- A. F.-J. Jou, N.-H. Tai and J.-A. A. Ho, Electroanalysis, 2014, 26, 1816–1823 CrossRef CAS.
- X. M. Guo, H. M. Deng, H. Zhou, T. X. Fan and Z. Q. Gao, Sens. Actuators, B, 2015, 206, 721–727 CrossRef CAS.
- N. S. Ismail, Q. H. Le, H. Yoshikawa, M. Saito and E. Tamiya, Electrochim. Acta, 2014, 146, 98–105 CrossRef CAS.
- S. Badhulika, R. K. Paul, Rajesh, T. Terse and A. Mulchandani, Electroanalysis, 2014, 26, 103–108 CrossRef CAS.
- Y.-J. Lee and J.-Y. Park, Sens. Actuators, B, 2011, 155, 134–139 CrossRef CAS.
- H. C. Gao, F. Xiao, C. B. Ching and H. W. Duan, ACS Appl. Mater. Interfaces, 2011, 3, 3049–3057 CAS.
- P. Yang, X. Tong, G. Wang, Z. Gao, X. Guo and Y. Qin, ACS Appl. Mater. Interfaces, 2015, 7, 4772–4777 CAS.
| This journal is © The Royal Society of Chemistry 2016 |

