Simultaneous preconcentration of uranium and thorium in aqueous samples using cloud point extraction

Abhijit Sahaa, Sadhan Bijoy Deba, Arnab Sarkarb, Manoj Kumar Saxena*a and B. S. Tomara
aRadioanalytical Chemistry Division, Bhabha Atomic Research Centre, Mumbai, India-400085. E-mail: mksaxena1965@gmail.com; Fax: +91 22 25505151; Tel: +91 22 25590633
bFuel Chemistry Division, Bhabha Atomic Research Centre, Mumbai, India-400085

Received 12th November 2015 , Accepted 22nd January 2016

First published on 26th January 2016


Abstract

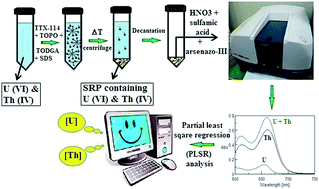
Uranium (U) and thorium (Th) are both chemically and radiologically toxic even at ultratrace concentrations. Hence, the development of new preconcentration procedures for their precise determination by simple, versatile and cost effective analytical techniques is desirable. A novel, simple and simultaneous cloud point extraction (CPE) procedure has been developed for preconcentrating trace amounts of U and Th in aqueous samples. Preconcentration of the metal ions in the surfactant rich phase of Triton X-114 was carried out by complexing them with trioctylphosphine oxide (TOPO) and N,N,N′,N′-tetraoctyldiglycolamide (TODGA). The preconcentrated solution was subjected to UV-visible spectrophotometry employing arsenazo-III. Partial least square regression analysis was then utilized to resolve their overlapping absorbance spectra and thereby allowing their determination in the presence of one another. The CPE procedure was optimized with respect to: pH of the solution, ionic strength, extraction temperature, phase separation temperature and concentrations of extractants, surfactant and co-surfactant. The developed CPE procedure resulted in percentage extraction efficiencies (EEs) of 98.0 ± 0.5 for U and 99.5 ± 0.5 for Th. Interference studies were also carried out and it was found that the recoveries of U and Th were 98% and 99% respectively in the absence of and ≥95% in the presence of interfering ions. The linear dynamic concentration ranges of the procedure were found to be 15–1000 ng mL−1 and 10–1000 ng mL−1 for U and Th, respectively. The developed methodology was successfully employed for the determination of U and Th in unspiked and spiked samples of ground water, lake water and sea water with ≤4% relative standard deviations. These samples were also directly analyzed by inductively coupled plasma mass spectrometry (ICP-MS) and the agreement between these two results at the 95% confidence level validates the developed methodology. The proposed CPE procedure can be used effectively for the simultaneous extraction of U and Th quantitatively with PFs of 94 for U and 100 for Th and can tolerate much higher levels of interfering ions.

1. Introduction

Uranium (U) and thorium (Th) are the two most naturally abundant actinides found in the environment. In addition their anthropogenic isotopes (232,233,236U and 229Th) which are generated in nuclear power plants, nuclear explosions and nuclear accidents contribute to their environmental toxicity. Their soluble compounds are known to have both chemical and radiological toxicity.1–3 As per the World Health Organization (WHO) and Atomic Energy Regulatory Board (AERB), India guidelines, the permissible limit of U in drinking water should be less than 30 and 60 ng mL−1 respectively.4,5 The Environmental Protection Agency (EPA), USA has specified a maximum contaminant level (MCL) of 15 pCi L−1 for alpha activity, excluding radon and uranium, in drinking water.6 Th being an alpha emitting nuclide, its approximate maximum permissible concentration limit in drinking water should be less than 68 ng mL−1 and this value has been arrived at by considering only the specific activity of natural Th. In view of their toxicity even at trace and ultratrace levels, the precise determination of these actinides in environmental and biological samples is a challenging task.

Direct determination of U and Th in environmental samples by simple and versatile spectroscopic techniques viz. UV-visible spectrophotometry, inductively coupled plasma atomic emission spectroscopy (ICP-AES), liquid scintillation counting (LSC), etc., is quite difficult because of their low concentrations and the presence of complex matrices in such samples. Hence, the development of simple and novel analytical strategies for improving the detection of these elements is always desirable. A number of preconcentration and separation techniques like liquid–liquid extraction (LLE), solid phase extraction (SPE), ion-exchange chromatography (IEC), etc., have been developed in the past.7–12 However, generation of significant to large volumes of organic waste in LLE can increase environmental hazards and hence it is not considered to be eco-friendly. The lower retention capacity of commercially available resins (TEVA/UTEVA/DGA), their limited reusability, chance of cross contamination and also generation of significant amounts of contaminated waste in SPE make this technique disadvantageous.8,9 The poor selectivity for metal ions in IEC due to the mass-to-charge ratio driven interaction with functional groups makes this technique least attractive.7

Over the last decade, cloud point extraction (CPE) has emerged as a simple and powerful method for the separation and preconcentration of metal ions.3,13–18 CPE is essentially based on the extraction of metal ions into the dispersed micelle phase of non-ionic polyoxyethylene surfactants followed by temperature driven phase separation and aggregation of micelles, referred to as coacervation. The temperature at which the surfactant solution separates into two immiscible phases, i.e., (i) a bulk aqueous phase containing surfactants at a concentration less than or equal to critical micelle concentration (CMC) and (ii) a surfactant rich phase (SRP), is called its cloud point temperature (CPT). The extraction of metal ions from the bulk aqueous phase to the SRP is achieved by dispersing the selected organic extractant into the aqueous phase with the help of surfactants. This in turn enhances the interactions between the metal and ligand and hence no external forces are required as in LLE.19 The improvement in the extraction efficiency (EE) of a particular metal ion depends on a number of modifications to the CPE system, the most common being: choice of a suitable extractant, maintenance of the required pH, addition of a co-surfactant if required, extraction temperature, phase separation temperature, etc. Because this technique uses millimolar amounts of surfactants and micro- to milli-molar amounts of extractants, it is seen as a greener alternative to LLE.20 Furthermore, CPE was recently demonstrated by Favre-Réguillon et al. to have a higher EE than LLE.21

A significant number of literature reports are available on the CPE of U18,21–27 and a few for Th28–30 but only one report is available on the simultaneous preconcentration of U and Th along with zirconium and hafnium.3 In the work of S. Shariati et al.3 the enrichment factors (EFs) obtained for U and Th upon preconcentration are 37.0 and 43.6, respectively. However, precise determination of U and Th around their guideline values by a cost effective and versatile spectroscopic technique like UV-visible spectrophotometry requires higher EEs and preconcentration factors (PFs) because it provides acceptable sensitivities and enables detection of U and Th at a μg mL−1 level.31–35 Hence, there is a need for the development of a CPE procedure for simultaneous preconcentration of U and Th with higher EEs and PFs.

In this paper, we have developed a new CPE method using trioctylphosphine oxide (TOPO) as a neutral extractant and N,N,N′,Nʹ-tetraoctyldiglycolamide (TODGA) as a co-extractant for the simultaneous preconcentration of U and Th. Cloud point conditions were optimized with respect to pH, extractant concentration, surfactant concentration, temperature and tolerance level of interfering ions. The preconcentrated fractions were analysed by UV-visible spectrophotometry using arsenazo-III as a complexing agent. A multivariate calibration method, i.e., partial least square regression (PLSR), was employed to resolve the overlapping absorption spectra of the constituent analytes. Strong acidic media were chosen for their spectrophotometric determination to eliminate interference from other elements which form arsenazo-III complexes at a high pH, thereby making the method simple and convenient. The stability of the U– and Th–arsenazo-III complexes was studied in different mineral acids to find the perfect medium with optimum concentration. The proposed method was applied for the analysis of three natural water samples and these were also directly analyzed by ICP-mass spectrometry (ICP-MS) to validate the developed methodology.

2. Experimental

2.1. Instrumentation

A UV-visible-NIR double beam spectrophotometer (JASCO, Japan make, model V-670) was used for measuring the absorbance of U– and Th–arsenazo-III complexes. The pH of the solutions were measured with a pH meter (LABINDIA, India, make PICO+). The PLSR calculations were carried out using The Unscrambler® X (M/s Camo Software, India) software. Direct analysis of the samples was carried out using an ICP-quadrupole MS (PQ2 plus, V.G., UK). An ultracentrifuge (Sigma, model no. 3K30) was used for centrifugation.

2.2. Reagents and materials

MilliQ water (18 MΩ cm, Millipore Corporation, Bedford) was used throughout the experiments. High purity UO2(NO3)2·6H2O (99.9%) and Th(NO3)4·5H2O (99.9%) were obtained from Indian Rare Earth (IRE), India to prepare 1000 μg mL−1 stock solutions of each analyte in a 1% (v/v) HNO3 medium. These individual standard solutions were mixed in an appropriate amount and diluted with MilliQ water to obtain a mixed stock solution of concentration 10 μg mL−1 with respect to each analyte. Other reagents used in the development of CPE system were: HNO3 and NaOH (Merck), sulfamic acid (Sigma-Aldrich), KNO3 (Alfa Aesar), Triton X-114 (TTX-114; Sigma-Aldrich), sodiumdodecyl sulphate (SDS; Sigma-Aldrich), and TOPO (Sigma-Aldrich). TODGA was synthesized using the procedure proposed by D. D. Dicholkar et al.36 TOPO and TODGA were dissolved separately in solutions of Triton X-114 to enhance their solubility. 50 mL conical glass centrifuge tubes with a stopper from Borosil (India) were used. Ground water from Punjab (India), lake water from West Bengal (India) and sea water from the Mumbai coast (India) were collected for analysis.

2.3. Sample pretreatment

The water samples were first filtered through Whatman™ filter paper 541 and then through a 0.2 μm syringe filter to get clear solutions.

2.4. CPE system

A 40 mL aliquot of the sample containing the analytes was adjusted to pH 6 by adding dilute HNO3 and NaOH in a volumetric flask. Afterwards, 100 μL of 0.25 mol L−1 SDS, 2.5 mL of both 1 × 10⁻² mol L−1 TOPO and 2 × 10⁻³ mol L−1 TODGA in 4 × 10⁻² mol L−1 TTX-114 were added to it. 1 mL of 5 mol L−1 KNO3 was added to maintain proper ionic strength and the solution was diluted to 50 mL using water. The solution was then continuously stirred for 1 h in an ice bath to attain equilibrium. Subsequently the solution was transferred to a 50 mL conical centrifuge tube and kept in a thermostated water bath at 50 °C for 1 h. In this step the solution became cloudy and the SRP was separated by the gravitational force. Complete phase separation was achieved by centrifugation at 4000 rpm for 10 min at room temperature. The tube was then placed in an ice bath for 5 min to make the SRP phase more viscous and hence facilitate the separation of the aqueous phase by decantation. A schematic representation of the above demonstrated CPE procedure is shown in Fig. 1.
image file: c5ra23734c-f1.tif
Fig. 1 Schematic representation of the developed CPE procedure.

2.5. Spectrophotometric procedure

After separating the bulk aqueous phase, the SRP was made less viscous by adding 2 mL of a solution containing 10[thin space (1/6-em)]:[thin space (1/6-em)]90 (v/v) methanol/conc. HNO3 and transferred into a 5 mL beaker. The solution was then evaporated to near dryness and allowed to cool down to room temperature. Then, the solution was made up to 1 mL volume by adding oxalic acid (0.1 mol L−1), HNO3 (6 mol L−1), sulfamic acid (0.1 mol L−1), arsenazo-III (0.07% w/v) and MilliQ water. Higher dilution factors were sometimes required depending on the maximum peak absorbance. The solution was mixed well for 1 min for complete complexation of all the metal ions by the organic dye. The solution was consequently transferred into a 0.5 cm quartz cell and the absorbance was measured in the 600–750 nm range.

2.6. Partial least square regression analysis

The complete absorption spectra (600–750 nm) of the samples were used for PLSR analysis, which is a purely empirical approach. Two sets of standard samples were prepared for PLSR, i.e., a calibration set (CS) consisting of 15 standards which was used for constructing the calibration curves and a validation set (VS) consisting of 5 samples to validate the calibration models generated by a PLSR algorithm. The concentrations of U and Th in these standard sample sets are tabulated in Table 1. The PLSR algorithm used in this work is similar to one previously described.37,38 The predictive capability of the PLSR method was validated by determining the root mean square error of prediction (RMSEP) and percentage relative error of prediction (REP) of VS sample analysis.
Table 1 Concentrations of the analytes in the calibration set (CS) and validation set (VS) used for the PLSR analysis of U and Th
Sample code Uranium (μg mL−1) Thorium (μg mL−1) Sample code Uranium (μg mL−1) Thorium (μg mL−1)
CS1 0.5 0.25 CS11 3 1
CS2 0.75 0.5 CS12 5 2
CS3 1 1 CS13 7.5 2.5
CS4 1 2.75 CS14 10 1
CS5 1 6 CS15 15 1
CS6 1.5 4 VS1 1 4
CS7 1.5 5 VS2 1.5 2.5
CS8 2 1.5 VS3 3 3
CS9 2 3.5 VS4 6.5 1.5
CS10 2.5 2.5 VS5 8 2


3. Results and discussion

3.1. Optimization of CPE procedure

The optimized CPE conditions presented in Table 2 were obtained through a cross-optimization process of all parameters. The method was assessed by the calculating the extraction efficiency (EE%), recovery (%) and preconcentration factor (PF) for each individual analyte by using the following equations:
 
image file: c5ra23734c-t1.tif(1)
 
image file: c5ra23734c-t2.tif(2)
 
image file: c5ra23734c-t3.tif(3)
where Cinitial, CSRP and Csupernatant are the concentrations of the respective analyte initially taken, in the SRP and in the supernatant after phase separation, respectively. Similarly Vinitial, Vsupernatant and VSRP are the initial volume of the solution (50 mL), volume of the supernatant phase after phase separation and volume of the redispersed SRP, respectively. The concentration of analytes in the supernatant, after phase separation, being very low were determined by ICP-MS.
Table 2 Optimized conditions for the CPE system
Parameters Optimized conditions of total aqueous phase before coacervation Units
Sample volume 40 mL
pH 6
[TTX-114] 4 × 10⁻³ mol L−1
[SDS] 0.5 × 10⁻³ mol L−1
[TOPO] 0.5 × 10⁻³ mol L−1
[TODGA] 0.1 × 10⁻³ mol L−1
[KNO3] 0.1 mol L−1
Textraction 5–6 (°C)
textraction 1 (h)
Tphase separation 50 (°C)
tphase separation 1 (h)


3.1.1. Effect of ligand(s) concentration. TOPO is known to have high selectivity for tri-, tetra- and hexavalent actinides and hence is widely used for the extraction of U and Th from various matrices.39 The effect of TOPO concentration from 0 to 0.5 × 10⁻³ mol L−1, on the recoveries of U and Th is shown in Fig. 2. The recoveries are in the range 10–85% for U and 15–99% for Th. The EEs for both U and Th are almost maximum when the concentration of TOPO was in the range of (0.1–0.5) × 10−3 mol L−1. However, TOPO can extract trivalent lanthanides when acid concentration is less than 2 mol L−1.39 Consequently studies were also carried out by taking equal quantities of lanthanum (as a representative of the lanthanides) along with U and Th, for the same TOPO concentration range, and the results are shown in Fig. 2. As reported earlier, the efficiency of CPE of U by TOPO decreases in the presence of an equal amount of lanthanum40 and a similar decreasing trend was observed for both U and Th for the entire TOPO concentration range of (0.025–0.5) × 10−3 mol L−1. Recoveries were found to increase from 0.025 × 10⁻³ to 0.2 × 10⁻³ mol L−1 and later remain the same. Hence, a TOPO concentration of 0.5 × 10⁻³ mol L−1 was fixed to prevent a large reduction in the recoveries of analytes in the presence of lanthanides. According to S. Gao et al.40 the improvement in the recovery of U, by TOPO, in the presence of La is obtained by the addition of a bis[(trifluromethyl)sulphonyl]imide (NTf2−) based ionic liquid. The improvement is due to the formation of a smaller uranyl complex than lanthanum and it was steric factors which were attributed to be the reason for the less extraction of La3+. However this method cannot be applied to the simultaneous extraction of U and Th as by the same analogy thorium would not be extracted into the SRP. Hence, we thought of introducing a co-extraxtant along with TOPO which would preferentially complex trivalent lanthanides, thereby minimizing the competition for the complexation of lanthanides with TOPO and making it available for complexation with U and Th. TODGA was explored as a co-extraxtant as it is known to have very high selectivity towards lanthanides and trivalent actinides and a good selectivity for tetra- and hexavalent ions.41 The concentration of TODGA was varied in the range of (0.02–0.2) × 10−3 mol L−1, in the presence of 0.5 × 10⁻³ mol L−1 TOPO, to observe the recoveries of both U and Th in the presence of an equal amount of lanthanide. The findings are shown in Fig. 3. It may be inferred from Fig. 3 that 0.1 mmol L−1 of TODGA is optimum for the quantitative extraction of both U and Th in the absence and presence of an equal amount of lanthanide.
image file: c5ra23734c-f2.tif
Fig. 2 Effect of TOPO concentration on the recoveries of 50 ng mL−1 of U and Th, each in the absence and presence of 50 ng mL−1 La. TODGA had not been added during this experiment and the other parameters were kept constant as presented in Table 2.

image file: c5ra23734c-f3.tif
Fig. 3 Effect of TODGA concentration on the recoveries of 50 ng mL−1 of U and Th, each in the presence of 50 ng mL−1 La. Other parameters were kept constant as presented in Table 2.
3.1.2. Effect of non-ionic surfactant. Triton X-114 (TTX-114) was chosen as the surfactant because its theoretical CPT (28 °C) is near room temperature and it’s CMC of 0.2 × 10⁻³ mol would not have a significant toxicological impact on the environment.42 The higher density of the TTX-114 SRP compared to water facilitated the phase separation process which was further improved by centrifugation. The goal of a successful CPE is to achieve the highest EE and minimum phase volume ratio of the surfactant to improve PF. The effect of TTX-114 concentration on the recovery of U and Th was studied in the range of (1–10) × 10−3 mol L−1. The analyte recoveries were found to increase with surfactant concentration up to 4 × 10⁻³ mol L−1 and later it remains constant. Hence, a TTX-114 concentration of 4 × 10⁻³ mol L−1 was selected for further experiments.
3.1.3. Effect of ionic surfactant concentration. The highest LLE extractions of both U and Th, by TOPO, from 3 mol L−1 HNO3 medium are known to occur via UO2(NO3)2·2TOPO and Th(NO3)4·3TOPO neutral complex formation.39 TODGA is also known to extract these metal ions as their neutral nitrate complexes under strongly acidic conditions.41 However in the typical pH range for CPE analysis the extraction is dominated by the positively charged complexes of U and Th and this is due to a lack of nitrate concentration. SDS was chosen as an ionic co-surfactant to increase the EEs of U and Th because of its negatively charged hydrophilic head group. In order to ensure that the surface-active ions remains either as monomers or as mixed micelles with TTX-114, the concentration range of the co-surfactant (0.1 × 10⁻³ to 1 × 10⁻³ mol L−1) was set far below its critical micelle concentration (CMC: 8.5 × 10⁻³ mol L−1 at 25 °C). The observations are shown in Fig. 4. A sharp increase in analyte recoveries was observed with an increase in SDS concentration from 0 to 0.2 × 10⁻³ mol L−1 followed by a slow increase at higher concentrations. The highest reproducible recoveries were obtained at an SDS concentration of 0.5 × 10⁻³ mol L−1. The recoveries of U and Th were found to drop sharply above an SDS concentration of 0.6 × 10⁻³ mol L−1 and resulted in recoveries of less than 40%. At high SDS concentrations the CPT of the CPE system becomes high which results in lower EEs as demonstrated by Gu et al.43 Hence, the concentration of SDS was kept at 0.5 × 10⁻³ mol L−1.
image file: c5ra23734c-f4.tif
Fig. 4 Effect of SDS concentration on the recoveries of 50 ng mL−1 of each U and Th. Other parameters were kept constant as presented in Table 2.
3.1.4. Effect of salt concentration. As discussed above it is essential to maintain a particular nitrate concentration to facilitate the quantitative complexation of U and Th with TOPO. Hence, KNO3 was added to the system to maintain the ionic strength of the solution. KNO3 also acts as a salting-out agent thereby forcing metal–ligand complexes to be formed inside the micelles. A 0.1 mol L−1 concentration of KNO3 was found to be optimal and there was no appreciable effect on analyte recovery with an increase in ionic strength.
3.1.5. Effect of pH. TOPO is known to have the highest distribution ratio for both U and Th at 3 mol L−1 HNO3 medium. But such a high acid concentration hampers the coacervation of micelles and is not recommended for CPE. Hence, the recoveries for both U and Th were determined for the pH range from 1 to 10, typical for a CPE procedure.18 The effect of pH on the recoveries is shown in Fig. 5. The low recoveries in the lower pH region can be attributed to the protonation of the sulphate group of SDS. The optimal recoveries were obtained for pH values ranging from 5.5 to 7 for U and 5 to 8 for Th. The decrease in recoveries at higher pH values is due to the formation of carbonate and/or bicarbonate complexes of U and Th in environmental samples. Therefore, a pH value of 6 was selected as the optimum one.
image file: c5ra23734c-f5.tif
Fig. 5 Effect of pH on the recovery of 50 ng mL−1 of U and Th each. Other parameters were kept constant as presented in Table 2.
3.1.6. Effect of temperature. CPE is mainly dominated by two temperature dependent steps, namely the analyte extraction temperature and the phase separation temperature. The addition of additives to a non-ionic surfactant system is known to change the CPT drastically. The addition of SDS will increase the CPT whereas the addition of an electrolyte (KNO3) will decrease the same.43 The developed system was found to coacervate near its theoretical CPT of ∼30 °C. Analyte recoveries were examined at different extraction temperatures in conjunction with different phase separation temperatures. In the first case the solutions were allowed to stand for 1 h in an ice bath (5–6 °C) with constant stirring and then phase separation was carried out at different temperatures ranging from 30–70 °C with a constant incubation time of 1 h. In the second case the extraction was carried out at room temperature (25 °C) and rest of the conditions were maintained the same as in the previous case. In the third case the extraction and phase separation was carried out at temperatures ranging from 30–70 °C for 2 h. After the incubation period, complete phase separation was done by centrifugation at 4000 rpm for 10 min at room temperature. The analyte recoveries found in all three cases are presented in Fig. 6. The highest recoveries were obtained with an extraction temperature of 5–6 °C and phase separation temperature of 50–70 °C, respectively. At higher extraction temperatures the micelles tend to coacervate and hence the viscosity of the surfactant phase increases thereby causing lesser interaction of the ligand with the metal ion. On the other hand at low extraction temperature there is greater interaction of the metal ion with the ligand present in the micellar medium, resulting in quantitative recoveries of the analytes. A similar observation was previously made by Labrecque et al.16 It was reported by Safavi et al.42 that the highest PFs were obtained when the phase separation temperature is above the CPT of the system. Hence, 5–6 °C was chosen as the extraction temperature with 1 h incubation time and 50 °C as the phase separation temperature for 1 h followed by centrifugation at 4000 rpm for 10 min.
image file: c5ra23734c-f6.tif
Fig. 6 Effect of extraction and phase separation temperatures on the recovery of 50 ng mL−1 of U and Th. Other parameters were kept constant as presented in Table 2.

3.2. Optimization of spectrophotometric procedure

The use of organic dyes for the spectrophotometric determination of actinides had been reported.31 Among them, arsenazo-III has the advantage of forming stable complexes with U and Th even in a strong mineral acid medium.31 The use of a strongly acidic medium also excludes the possibilities of hydrolysis, formation of polynuclear species and formation of complexes of arsenazo-III with other elements which may interfere with the spectrophotometric determination of the analytes.31 The type of mineral acid medium, e.g. HCl, a mixture of HNO3 and sulfamic acid, HClO4, and their molarities play an important role in the determination of U and Th as reported in the literature.31–35,44,45 The stability of arsenazo-III has been found to be comparable in all acids in the range of 5–6 mol L−1 for a long period. Both U and Th form complexes with arsenazo-III instantaneously. The U–arsenazo-III complex was found to be stable for up to 3 to 4 weeks in all three mineral acids whereas the stability of the Th–arsenazo-III complex was found to be dependent on Th concentration as well as the acid medium.32 The observations for the Th–arsenazo-III complex are depicted in Fig. 7 and 8. The decrease in absorbance is due to the degradation of the Th–arsenazo-III complex. In a HCl medium, a decrease in absorbance was observed for Th concentrations above 1.5 μg mL−1 and below that the absorbance was found to be quite stable for a 1 h period, whereas in a HClO4 medium a decrease was observed at 1.0 μg mL−1 of Th and the rate of decrease in absorbance was much faster than that in a HCl medium. Only in a HNO3 medium containing sulfamic acid was no appreciable decrease in the absorbance of the Th complex observed for a period of 1 h, and Beer’s law was found to be followed in the concentration range of 0.25–6.0 μg mL−1. In the case of U, Beer’s law was found to be followed in the concentration range of 0.5–15.0 μg mL−1. The molar absorptivities for U and Th at 656 nm and 662 nm were found to be 2.2 × 10⁴ and 6.4 × 10⁴ mol−1 L cm−1, respectively, at room temperature. Sulfamic acid was added during the spectrometric determination of U and Th by arsenazo-III in a HNO3 medium to destroy any nitrous acid and oxides of nitrogen which are invariably present in equilibrium with nitric acid.45 The simultaneous determination of U and Th is difficult due to the closeness of their absorbance maxima resulting in a high degree of spectral overlap. In order to overcome this difficulty it is necessary to resolve their spectra by the application of a PLSR algorithm. In order to maintain the peak absorbance below 2 the concentrations of U and Th in CS and VS solutions were maintained accordingly and preconcentrated samples were diluted suitably.
image file: c5ra23734c-f7.tif
Fig. 7 The effects of mineral acids, 6 mol L−1 of HCl (a and d), HNO3 + 0.1 mol L−1 sulfamic acid (b and e) and HClO4 (c and f), and metal ion concentrations, 1 μg mL−1 (a, b and c) and 5 μg mL−1 (d, e and f), on the absorption maximum of Th using arsenazo-III with time. Spectra were recorded (1) 5 min, (2) 15 min, (3) 25 min, (4) 35 min and (5) 45 min after the addition of arsenazo-III.

image file: c5ra23734c-f8.tif
Fig. 8 Visual colour change of Th–arsenazo-III complex with time in different mineral acid mediums, where the Th concentration is 2.5 μg mL−1.

3.3. Partial least square regression analysis

The simultaneous spectrophotometric determination of U and Th by arsenazo-III was carried out applying a PLSR algorithm to deconvolute their overlapping complex spectra.
3.3.1. Factor optimization. In a PLSR calibration approach, the number of factors (which is equivalent to the principle component in principle component analysis) to be included in the algorithm was determined by comparing the root mean square error of cross validation (RMSEcv). Optimization of the number of factors has a great impact on the accuracy and precision of the model. Since these factors are the re-distributed version of the total variance, hence, the introduction of more factors than necessary will increase the noise portion in the regression. In this work the number of factors was optimized by determining the RMSEcv of VS samples for U and Th. The change in RMSEcv values for both U and Th with the change in the number of factors in the PLSR model is shown in Fig. 9. It can be seen that a minimum of 6 factors are required for both U and Th to obtain the minimum RMSEcv values of the elements. A further increase in the number of factors did not show any appreciable improvement in RMSEcv values.
image file: c5ra23734c-f9.tif
Fig. 9 Optimization of the PLSR algorithm factor.
3.3.2. PLSR coefficient. In PLSR, the acquired spectra for corresponding concentrations were correlated with each other mathematically and a column matrix or vector, also known as a PLSR coefficient (PLSRC) for individual elements was constructed. A graphical representation of the PLSRC, obtained by using 6 factors, is presented in Fig. 10. Positive PLSRC values indicate a positive correlation between the intensity at the pixels and the elemental concentration used in the unknown sample and a negative PLSRC indicates the reverse. It can be seen from Fig. 10 that both U and Th have two positive correlation peaks at different places indicating the high sensitivity of those areas to the corresponding element.
image file: c5ra23734c-f10.tif
Fig. 10 Absorption spectra of U and Th mixtures and the individual PLSRCs for U and Th.
3.3.3. Accuracy and precision. The accuracy and precision of the PLSR model was obtained by analyzing the VS samples. Five replicate spectra of each sample were treated to calculate these parameters. The accuracy was examined by checking the elemental percentage recovery and the precision was expressed in terms of RMSEP and REP (%). All the calculated values are tabulated in Table 3.
Table 3 Concentrations of U and Th in VS solutions as predicted by PLSR and statistical parameters of the PLSR algorithm
Sample code Spiked amount (μg mL−1) PLSR predicted amount (μg mL−1) Recovery (%)
U Th U Th U Th
VS1 1 4 1.01 ± 0.01 3.96 ± 0.02 101 99
VS2 1.5 2.5 1.53 ± 0.03 2.47 ± 0.01 102 99
VS3 3 3 2.98 ± 0.01 3.03 ± 0.02 99 101
VS4 6.5 1.5 6.52 ± 0.06 1.46 ± 0.01 100 97
VS5 8 2 8.0 ± 0.1 2.00 ± 0.01 99 100
Mean recovery (%) 100 99
RMSEP 0.029 0.032
REP (%) 0.734 1.224


3.4. Effect of common interfering ions

Studies were carried out to demonstrate the applicability of the proposed method in presence of common interfering ions, which are likely to be present along with U and Th in environmental samples. For this purpose 50 ng mL−1 solutions of the analyte ions were analyzed in presence of different concentrations of interfering ions. Even though the alkali metals may not get extracted but could affect the clouding behavior due to their large abundance in nature, it was necessary to carry out the recovery studies of the analytes in their presence. However, alkaline earth metal ions, transition metal ions and lanthanides are expected to be extracted along with the analytes due to their higher oxidation states. The effects of commonly occurring anions were also studied. The maximum tolerable limit of the interfering ions in the CPE procedure was considered to be acceptable only when the recoveries of U and Th were ≥95%. The results of the interference studies are tabulated in Table 4. A pictorial representation depicting the mean recoveries and relative standard deviations (RSDs) of U and Th in the absence and presence of interfering ions at the maximum tolerance limit is shown in Fig. 11.
Table 4 Tolerance limit of the developed method in the presence of selected cations and anions; concentration of U and Th: 50 ng mL−1 each
Serial number Ion Tolerance limit (μg mL−1)
A1 Li+, Na+, K+ 2000
A2 Mg2+, Ca2+, Sr2+, Ba2+ 500
A3 Zr4+ Double the total target ions concentration
A4 Hf4+
A5 La3+, Ce4+, Eu3+
A6 Cd2+ 250
A7 Fe3+ 10
A8 Pb2+ 200
A9 Co2+ 250
A10 Cu2+ 200
A11 Ni2+ 200
A12 Zn2+ 250
A13 Mn2+ 200
A14 Hg2+ 5
A15 Cr3+ 10
A16 CO32−, PO43−, SO42−, Cl, Br 1500


image file: c5ra23734c-f11.tif
Fig. 11 A box chart comparison of recovery studies of 5 replicate determinations of U and Th. The box represents the experimental standard deviation (mean ± 1σ). The black line inside the box represents the median and the blue line represents the mean of the 5 replicates. A = recoveries in absence of interfering ions and A1 to A16 = recoveries in the presence of interfering ions (concentration as per Table 4).

3.5. Analytical figures of merit

The proposed CPE method was found to provide quantitative EEs of (98.0 ± 0.5)% for U and (99.5 ± 0.5)% for Th and recoveries of 98% for U and 99% for Th. The proposed method will find applicability in the decontamination, extraction and quantification of trace amounts of U and Th as the preconcentration step leaves a nearly negligible amount of the analytes in the supernatant. The PFs were found to be 94 for U and 100 for Th. The linear dynamic concentration range of the procedure was found to be 15–1000 ng mL−1 and 10–1000 ng mL−1 for U and Th respectively. The RSDs (1σ) were found to be between 1–3% and 2–5%, respectively, in absence and presence of interfering ions.

The analytical performance of the developed methodology has been compared with previously reported CPE procedures for U and Th, shown in Table 5. It can be seen from the table that only a single work had been reported for the simultaneous preconcentration of U and Th,3 but no data on EEs had been provided and the determined PFs were quite low. In the present work, we have evaluated all the parameters and these are relatively higher than those reported by S. Shariati et al.3 These values are also found to be comparable and in some cases even better than the earlier reported CPE procedures for either U or Th.18,21–30 The minimum concentration level of U and Th which had been reported by S. Shariati et al.3 is lower than the present work and this is obviously because they used ICP-OES, which is more sensitive than UV-visible spectrophotometry. The proposed method, however, can be effectively used for the quantification of U and Th in drinking water. The percentage RSD of the proposed method is much better than many of the previously published works.3,18,22,26–28,30 According to S. Shariati et al.3 the interference of Cr3+ (5 μg mL−1) and Hg2+ (5 μg mL−1) was observed in the recovery of U, Th, Zr and Hf by CPE, and was taken care of by increasing the concentration of ligand from 2 × 10⁻⁴ mol L−1 to 5 × 10⁻⁴ mol L−1. However in the present work it was observed that 10 μg mL−1 of Cr3+ and 5 μg mL−1 of and Hg2+ can be tolerated without increasing the concentration of the extractant. The tolerance to other elements in the extraction of U and Th was experimentally examined and this was done with a much higher level concentration of the former. The effect of lanthanides on the recoveries of U and Th has been studied for the first time.

Table 5 Comparison of analytical performance of the developed method with the earlier published worksa
Ion(s) Instruments DLR (ng mL−1) EE (%) Recovery (%) PF RSD (%) Ref.
a N.P. = not provided.
U(VI)–Th(IV) UV-visible U: 15–1000; Th: 10–1000 U: 98.0 ± 0.5; Th: 99.5 ± 0.5 U: 98; Th: 99 U: 94; Th: 100 1–3 Proposed method
U(VI)–Th(IV)–Zr(IV)–Hf(IV) ICP-OES U: 2.5–1240; Th: 0.5–1500 N.P. N.P. U: 37; Th: 43.6 <6.1 3
U(VI) ICP-MS U: 0.01–1000 99.5 ± 0.5 99 92 4 18
U(VI) UV-visible N.P. N.P. 98 100 5.1 22
U(VI) UV-visible 15–300 N.P. 98 62 <3.7 23
U(VI) UV-visible N.P. 98 N.P. 122 N.P. 24
U(VI) UV-visible 0.18–10 N.P. N.P. 14.3 3 25
U(VI) UV-visible 6–10 N.P. 105 N.P. 9 26
U(VI) LSC N.P. N.P. 50 N.P. 10 27
U(VI) ICP-OES N.P. 95 98 122 N.P. 21
Th(IV) LSC N.P. N.P. 60 N.P. 5 28
Th(IV) UV-visible 0.5–15 N.P. N.P. 33.33 1.6 29


The main advantages of the developed methodology are: (i) the simultaneous preconcentration of U and Th with high EEs, (ii) simultaneous spectrophotometric determination of U and Th by employing PLSR, (iii) PFs comparable or better than earlier reported methods, (iv) wide dynamic linear concentration range, (v) better precision than that obtained by earlier reported methods, (vi) better tolerance towards common interfering ions and lanthanides, (vii) cost effectiveness and (viii) simplicity of the operation. However the proposed analytical procedure cannot be used for the quantification of U and Th in environmental samples if the concentration of zirconium, hafnium and lanthanides is more than double the total concentration of the analytes.

3.6. Analysis of natural water samples

The applicability of the developed method was demonstrated by analyzing different kinds of natural water samples. These samples were spiked with U and Th because of their very low analyte content. Different sources of water, i.e., ground, sea and lake water, were analyzed using the proposed method. A ground water sample from Punjab, India was considered because of it’s high uranium content.46 Sea water from the Mumbai coast, India was chosen to observe how the developed method is affected in the presence of a high salt content. A fresh water lake sample from West Bengal, India was also analyzed. All the three samples were also analyzed directly by ICP-MS. The results are listed in Table 6. The results obtained by the proposed method are found to be in agreement with the values by ICP-MS within the 95% confidence interval.
Table 6 Analysis of real samples (n = 5)a
Sample Added (ng mL−1) Found by CPE-UV-visible (ng mL−1) Found by ICP-MS (ng mL−1)
U Th U Th U Th
a ND = not detected.
Ground water 0 0 110 ± 3 ND 110 ± 5 ND
15 15 124 ± 4 14.3 ± 0.5 124 ± 4 15 ± 1
25 25 135 ± 5 24.2 ± 0.7 136 ± 4 25 ± 1
Lake water 0 0 ND ND ND ND
15 15 14.5 ± 0.4 14.8 ± 0.4 15 ± 1 15 ± 1
25 25 24.0 ± 0.6 25.1 ± 0.7 25 ± 2 24 ± 2
Sea water 0 0 ND ND 2.8 ± 0.3 ND
15 15 17.6 ± 0.5 14.6 ± 0.5 18 ± 2 15 ± 1
25 25 28 ± 1 25.0 ± 0.9 28 ± 2 25 ± 2


4. Conclusion

The developed analytical methodology provides a simple, sensitive and low cost procedure for the simultaneous preconcentration and determination of U and Th in aqueous samples. The use of surfactants in the place of organic diluents, such as dodecane, carbon tetrachloride, etc., for extraction purpose reduces the environmental toxicity. The use of TOPO and TODGA was found to provide maximum recoveries of both U and Th in environmental samples. A temperature of 5–6 °C was found to be optimum for quantitative extraction of the analyte ions while a temperature of 50 °C was ideal for phase separation. The simultaneous spectrophotometric determination of U and Th using arsenazo-III was made possible by the application of a PLSR algorithm. The preconcentration factors obtained for U and Th are 94 and 100 respectively. The CPE procedure was found to extract U and Th quantitatively, from aqueous solutions, even in presence of large amount of interfering ions. The analysis of real environmental water samples was found to provide satisfactory results with ≤4% relative standard deviations.

Acknowledgements

The Authors are thankful to Dr K. L. Ramakumar, Director, RC & IG, BARC for his constant encouragement throughout the work.

References

  1. C. T. Garten, E. A. Bondietti and R. L. Walker, J. Environ. Qual., 1981, 10, 207–210 CrossRef CAS.
  2. E. S. Craft, A. W. Abu-Qare, M. M. Flaherty, M. C. Garofol, M. L. Rincavage and M. B. Abu-Donia, J. Toxicol. Environ. Health, Part B, 2004, 7, 297–317 CAS.
  3. S. Shariati, Y. Yamini and A. K. Zanjani, J. Hazard. Mater., 2008, 156, 583–590 CrossRef CAS PubMed.
  4. WHO, Guidelines for drinking-water quality, Geneva, Switzerland, 4th edn, 2011 Search PubMed.
  5. AERB, Drinking water specifications in India, Department of Atomic Energy, Govt. of India, 2004 Search PubMed.
  6. Common Radionuclides Found at Superfund Sites, EPA facts about thorium, Environmental Protection Agency, US, 2002 Search PubMed.
  7. T. Prasada Rao, P. Metilda and J. Mary Gladis, Talanta, 2006, 68, 1047–1064 CrossRef PubMed.
  8. E. P. Horwitz, D. R. Mcallister, A. H. Bond and R. E. Barans Jr, Solvent Extr. Ion Exch., 2005, 23, 319–344 CrossRef CAS.
  9. V. N. Epov, K. Benkhedda, R. J. Cornett and R. D. Evans, J. Anal. At. Spectrom., 2005, 20, 424–430 RSC.
  10. S. R. Yousefia, S. J. Ahmadib, F. Shemirania, M. R. Jamalic and M. Salavati-Niasari, Talanta, 2009, 80, 212–217 CrossRef PubMed.
  11. F. Shah, M. Soylak, T. G. Kazi and H. I. Afridi, J. Radioanal. Nucl. Chem., 2013, 296, 1239–1245 CrossRef CAS.
  12. G. A. Kandhro, M. Soylak and T. G. Kazi, At. Spectrosc., 2014, 35, 270–274 CAS.
  13. Z.-Q. Tan, J.-F. Liu, R. Liu, Y.-G. Yin and G.-B. Jiang, Chem. Commun., 2009, 7030–7032 RSC.
  14. C. Labrecque, L. Whitty-Léveillé and D. Larivièr, Anal. Chem., 2013, 85, 10549–10555 CrossRef CAS PubMed.
  15. N. Pourreza and H. Golmohammadi, Talanta, 2014, 119, 181–186 CrossRef CAS PubMed.
  16. H. T. Ulusoy, M. Akçay, S. Ulusoy and R. Gürcan, Anal. Chim. Acta, 2011, 703, 137–144 CrossRef CAS PubMed.
  17. R. Galbeiro, S. Garcia and I. Gaubeur, J. Trace Elem. Med. Biol., 2014, 28, 160–165 CAS.
  18. C. Labrecque, S. Potvin, L. Whitty-Léveillé and D. Larivièr, Talanta, 2013, 107, 284–291 CrossRef CAS PubMed.
  19. M. Hebrant, Coord. Chem. Rev., 2009, 253, 2186–2192 CrossRef CAS.
  20. A. S. Yazdi, Trends Anal. Chem., 2011, 30, 918–929 CrossRef CAS.
  21. A. Favre-Réguillon, D. Murat, G. Cote and M. Draya, J. Chem. Technol. Biotechnol., 2012, 87, 1497–1501 CrossRef.
  22. M. E. F. Laespada, J. L. P. Pavon and B. M. Cordero, Analyst, 1993, 118, 209–212 RSC.
  23. F. Shemirani, R. R. Kozani, M. R. Jamali, Y. Assadi and S. M. R. Milani, Sep. Sci. Technol., 2005, 40, 2527–2537 CrossRef CAS.
  24. H. S. Ferreira, M. D. Bezerra and S. L. C. Ferreira, Microchim. Acta, 2006, 154, 163–167 CrossRef CAS.
  25. T. Madrakian, A. Afkhami and A. Mousavi, Talanta, 2007, 71, 610–614 CrossRef CAS PubMed.
  26. J. B. Ghasemi, B. Hashemi and M. Shamsipur, J. Iran. Chem. Soc., 2012, 9, 257–262 CrossRef CAS.
  27. E. Constantinou and I. Pashadilis, J. Radioanal. Nucl. Chem., 2010, 286, 461–465 CrossRef CAS.
  28. E. Constantinou and I. Pashadilis, J. Radioanal. Nucl. Chem., 2011, 287, 261–265 CrossRef CAS.
  29. A. S. Amin, M. A. Kassem and T. Y. Mohammad, RSC Adv., 2015, 5, 52095–52100 RSC.
  30. N. Jalbani, M. Soylak, A. B. Munshi and T. G. Kazi, Fresenius Environ. Bull., 2014, 23, 2304–2309 CAS.
  31. M. H. Khan, P. Warwick and N. Evans, Chemosphere, 2006, 63, 1165–1169 CrossRef CAS PubMed.
  32. M. Khan, A. Ali and N. Khan, J. Radioanal. Nucl. Chem., 2001, 250, 353–357 CrossRef CAS.
  33. S. Kuś, N. Obarski and Z. Marczenko, Anal. Sci., 1992, 8, 213–218 CrossRef.
  34. Z. Marczenko and M. Balcerzak, Separation, Preconcentration and Spectrophotometry in Inorganic Analysis, Elsevier, The Netherlands, 1st edn, 2000 Search PubMed.
  35. J. Uhrovčík and J. Lesnŷ, Contribution to validation of spectrophotometric determination of thorium using Arsenazo III, HEJ: ENV-120131-A, 2012, pp.1–7 Search PubMed.
  36. D. D. Dicholkar, P. Kumar, P. K. Heer, V. G. Gaikar, S. Kumar and R. Natarajan, Ind. Eng. Chem. Res., 2013, 52, 2457–2469 CrossRef CAS.
  37. A. Sarkar, X. Mao, G. C. Y. Chan and R. E. Russo, Spectrochim. Acta, Part B, 2013, 88, 46–53 CrossRef CAS.
  38. C.-Y. George, X. Mao Chan, I. Choi, A. Sarkar, O. P. Lam, D. K. Shuh and R. E. Russo, Spectrochim. Acta, Part B, 2013, 89, 40–49 CrossRef.
  39. J. Chen and J. C. Wang, Prog. Chem., 2011, 23, 1366–1371 CAS.
  40. S. Gao, T. Sun, Q. Chen and X. Shen, J. Hazard. Mater., 2013, 263, 562–568 CrossRef CAS PubMed.
  41. S. A. Ansari, P. N. Pathak, V. K. Manchanda, M. Husain, A. K. Prasad and V. S. Parmar, Solvent Extr. Ion Exch., 2005, 23, 463–479 CrossRef CAS.
  42. A. Safavi, H. Abdollahi, M. R. H. Nezhad and R. Kamali, Spectrochim. Acta, Part A, 2004, 60, 2897–2901 CrossRef CAS PubMed.
  43. T. Gu and P. A. Galera-Gómez, Colloids Surf., A, 1995, 104, 307–312 CrossRef CAS.
  44. H. Rohwer, N. Rheeder and E. Hosten, Anal. Chim. Acta, 1997, 341, 263–268 CrossRef CAS.
  45. J. A. Perez-Bustamante and F. Palomares Delgado, Analyst, 1971, 96, 407–422 RSC.
  46. B. S. Bajwa, S. Kumar, S. Singh, S. K. Sahoo and R. M. Tripathi, J. Radiat. Res. Appl. Sci. DOI:10.1016/j.jrras.2015.01.002.

This journal is © The Royal Society of Chemistry 2016
Click here to see how this site uses Cookies. View our privacy policy here.