Direct reuse of Cu-laden wastewater for non-edible oil hydrolysis: basic mechanism of metal extraction and fatty acid production

Lu Ki Onga, Phuong Lan Tran Nguyenb, Felycia Edi Soetaredjoc, Suryadi Ismadji*c and Yi-Hsu Ju*a
aDepartment of Chemical Engineering, National Taiwan University of Science and Technology, 43, Keelung Rd., Sec. 4, Taipei 10607, Taiwan. E-mail: yhju@mail.ntust.edu.tw; Fax: +886 2 2737 6644; Tel: +886 2 2737 6612
bDepartment of Mechanical Engineering, Can Tho University, 3-2 Street, Can Tho City, Vietnam
cDepartment of Chemical Engineering, Widya Mandala Surabaya Catholic University, Kalijudan 37, Surabaya, Indonesia. E-mail: suryadiismadji@yahoo.com

Received 4th November 2015 , Accepted 28th February 2016

First published on 1st March 2016


Abstract

Fatty acids are platform chemicals to produce various useful chemicals and fuels. Hydrolysis of waste cooking oil using synthetic copper wastewater as the water and catalyst source to produce fatty acids was studied by carrying out reactions at 200–250 °C, water/acylglyceride molar ratio of 30[thin space (1/6-em)]:[thin space (1/6-em)]1–90[thin space (1/6-em)]:[thin space (1/6-em)]1, and CuSO4 concentration of 250–1500 mg kg−1. Comparison between catalytic and non-catalytic systems was also evaluated. Increasing temperature influenced fatty acid yield, acylglycerides conversion, and copper removal by enhancing fatty acid deprotonation. Minimum loss of fatty acids by micellar solubilization mechanism was achieved by using CuSO4 in the concentration range of 250–750 mg kg−1. Copper was transferred into the fatty acid product during the process by ion exchange mechanism. Considerable copper removal from the aqueous phase (98.87%) was achieved by 5 times recycling of the aqueous phase product into the hydrolysis process of pristine waste cooking oil. Direct utilization of copper-containing wastewater for industrial processes such as oil hydrolysis offers a potential symbiotic approach in industrial wastewater management and production of valuable chemicals.

1. Introduction

Fatty acids (FAs) are an important raw material for producing products such as soap, detergents, lubricants, and biodiesel. FAs can be seen as green chemicals due to their renewability and the fact that they possess various economic and ecological advantages. FAs are derived from the hydrolysis of triglycerides, which are the major component in oils. In hydrolysis reaction, excessive water is often introduced to force the equilibrium towards FA formation. Formation of FAs is more favored, for instance, in two-step biodiesel production due to its lowering effect on the esterification reaction temperature and time, by improving its miscibility with the alcohol precursor.1

Industrial oil splitting is carried out in either catalytic or non-catalytic hydrolysis process. The non-catalytic approach utilizes high pressure steam or water at high temperature. Water at those conditions possesses low dielectric constant and high self-dissociation constant so that high water-in-oil solubility can be attained,2 self-catalysis mechanism of available FAs can be induced,3 and reaction can be accelerated.4 An example of this approach is the continuous countercurrent fat splitting process called Colgate-Emery process (260 °C, 50 bar), which is used most extensively for triglyceride hydrolysis.5 Catalyst may lower down oil hydrolysis temperature by reducing activation energy and promoting easier water diffusion into oil phase.6,7 Catalyst employed in oil hydrolysis reaction may be acid, base, transition metal, or enzyme.5,8

Compared to catalytic approach, non-catalytic approach has shortcomings such as excessive energy requirement, expensive thick and corrosion-resistant reactor, and greater risk of side reactions to be occurred, such as isomerization, oxidation, dehydration, polymerization and interesterification.4,9 However, there are yet inherent problems associated with catalytic process such as the frequent make-up for unrecoverable catalyst and regeneration of catalyst activity.10 Long reaction time and the need of surfactant and/or organic solvent are particular problems related to enzymatic process.9 These problems increase production cost and impede the implementation of catalytic hydrolysis process in industry. Straightforward strategy to overcome this cost issue is to use an abundant and cheap catalyst. Acid or base seems to be an appropriate option. However, the use of acid/base as catalyst generates sludge, soap by-product, and hard wastewater in the down-stream of oil splitting process.

The employment of low-quality and inexpensive feedstock to replace expensive refined oils has been found to be crucial in order to minimize biodiesel production cost, where the cost of feedstock comprises more than 70–95% of the total expenditure.11 The use of non-edible fatty waste material that two to three times cheaper than refined vegetable oil, such as waste cooking oil, is attractive for minimizing the total cost. Moreover, utilization of waste cooking oil as an oil feedstock for petroleum diesel alternative accommodates its disposal issue that increase proportionally with the continued growth of the human population in a more sustainable and environmental-friendly way.12

Meanwhile, rapid development and expansion of industries together with increasing global population raise a concern on the available fresh water reserves to meet all current and future demands. In response to this issue, wastewater reuse has the potential to satisfy urban, non-food agricultural, and industrial needs with less energy and cost compared to conventional wastewater treatment. Among various types of wastewater, heavy metal containing wastewaters have more limited scope for direct reuse than organic wastewater due to their toxicity, bio-accumulating, and non-biodegradable nature.13,14 Heavy metal containing wastewaters are generated from various industries such as metal plating industry,15,16 printed circuit board manufacturing,17 and semiconductor industry.18 Among heavy metals, copper often appears in wastewater as the major metal ion. Some conventional physico-chemical technologies exist for the removal of such metals such as filtration, chemical precipitation, ion exchange, adsorption, electrochemical deposition and membrane process.13 Although viewed as necessary, all these methods are generally expensive in terms of capital cost and material regeneration.19,20 On the other hand, copper is classified as one of transition metals, which are known as catalyst in oleochemical processing.21,22 Therefore, direct reuse of wastewater laden with copper to hydrolyze non-edible oil feedstock, such as waste cooking oil may offer a more beneficial and greener solution in waste management and supply the large amount of water required in oil splitting process.

In this study, synthetic wastewater containing copper sulfate was used as a prototype model to investigate the potency and the basic reaction mechanism of industrial copper containing wastewater as the catalyst and water source for waste cooking oil hydrolysis. The effects of temperature, time, and concentration of copper in synthetic wastewater on FA yield were systematically studied in reference with the proposed reaction mechanism of copper soap formation and its catalytic mechanism on the oil hydrolysis reaction. The metal content of the hydrolyzed oil was determined and discussed.

2. Experimental

2.1. Chemicals

Waste cooking oil (WCO) was obtained from a local restaurant in Taipei, Taiwan. The collected oil was stored in a dark bottle and used without any pretreatment. Gas chromatography (Shimadzu GC-2014) equipped with a ZB-5HT column (15 m × 0.32 mm × 0.1 μm) was employed for free fatty acid (FFA) content analysis and quantification of acylglycerides. Detailed analysis procedure can be found elsewhere.23

All chemicals used were reagent grade, including KOH (85% purity, Across Organics, USA), anhydrous CuSO4 (97% purity, Shimakyu, Japan), concentrated HCl (37% purity, Across Organics, USA), ethanol (95%, Echo Chemical, Taiwan). Anhydrous oxalic acid (≥99% purity, Kokusan Chemical Co. Ltd., Japan) was used to standardize KOH solution. Indicator for titration analysis was phenolphthalein (Sigma Aldrich, USA). CuSO4 stock solution with a concentration of 25[thin space (1/6-em)]000 mg kg−1 was made and stored in a dark bottle at room temperature for later use. Analytical reagent grade HNO3 (90%, May and Baker, UK) was diluted to 10% (v/v) with deionized water for trace metal analysis. A standard solution containing Cu, Fe, Mg, Ca, Na, and K (solution IV, 1000 mg L−1, Merck Chemicals, USA) as well as one containing Pb and As (solution IX, 100 mg L−1, Merck Chemicals, USA) were used for the preparation of calibration curves.

2.2. Hydrolysis of WCO

A certain amount of oil and synthetic wastewater containing CuSO4 with a concentration of 500 mg CuSO4 kg−1 solution was put into a batch reactor. The molar ratio of oil to water was 1[thin space (1/6-em)]:[thin space (1/6-em)]30. The reactor consists of a 190 mL glass chamber, a 316-grade stainless steel autoclave, a K-type thermocouple, a PID temperature controller, a pressure gauge, a magnetic stirrer, and an external electric heater (Fig. S1). After closing the reactor tightly, oxygen was purged by nitrogen. The reactor was then heated to the desired temperature and held for a predetermined time under stirring. At the end of reaction time, the reactor was rapidly cooled to room temperature and the collected product was washed with warm water to remove glycerol. The washing filtrate was separated gravitationally in a separation funnel and the top layer was weighed and analyzed to obtain acid value (AV), saponification value (SV), ester value (EV) and metal content. All experiments were conducted in duplicate. The FA yield and acylglycerides conversion were calculated by using the following equations:
 
image file: c5ra23153a-t1.tif(1)
 
image file: c5ra23153a-t2.tif(2)

Control experiments were performed by replacing CuSO4 solution with a very dilute H2SO4 solution in the water with the same pH as that of the copper solution (pH 5.0). Water to acylglyceride molar ratio was varied from 30[thin space (1/6-em)]:[thin space (1/6-em)]1 to 90[thin space (1/6-em)]:[thin space (1/6-em)]1 by changing the amount of copper solution with a concentration of 500 mg CuSO4 kg−1 solution. The effect of copper concentration was evaluated by varying copper concentration (250–1500 mg CuSO4 kg−1 solution), while keeping the molar ratio of water to acylglyceride at 30[thin space (1/6-em)]:[thin space (1/6-em)]1. Reactions were performed at 225 °C for 8 h and the oil product was then processed in the same manner as described previously. Non-catalytic hydrolysis of WCO was carried out by replacing copper solution with deionized water. All other parameters used were the same as the catalytic process.

2.3. Oil analysis

FA content in WCO and hydrolyzed oil was determined as acid value (AV) by using the titration method described in ASTM D1980-87. Each sample was titrated with standardized KOH (0.5 N). The amount of KOH used in titration was translated into AV using eqn (3).
 
image file: c5ra23153a-t3.tif(3)
where VKOH and NKOH are the volume and normality of KOH solution used to titrate the samples, respectively.

Saponification value (SV) was acquired by the titration method according to ASTM D5558-95. Sample and blank were titrated against standardized HCl solution (0.5 N) in the presence of phenolphthalein indicator until the pink color disappeared. SV was calculated according to eqn (4).

 
image file: c5ra23153a-t4.tif(4)
where VHCl and NHCl are the volume and normality of HCl solution used to titrate the samples, respectively.

Total acylglyceride was estimated in terms of ester value (EV), which is the difference between SV and AV. Average molecular weight (MWav) of acylglyceride in WCO was obtained using eqn (5).

 
image file: c5ra23153a-t5.tif(5)
where EVoil feed is the ester value of WCO that used as reaction feed of this study.

2.4. Analysis of metal content in oil

Metal in the oil phase was extracted using the slightly modified method of Leonardis, et al.24 Typically, 20 mL of 10% (v/v) HNO3 was added to 5 g of oil sample and the mixture was placed in a water bath at 60 °C for 4 h under magnetic stirring. The mixture was left to separate into oil and water layers and cooled to solidify the oil layer. Solid fat was filtered out by using a 5 μm filter paper (Advantec Grade no. 2) and the acid solution was collected for inductively coupled plasma (ICP) analysis. Removal of copper (%) can be expressed as the number of Cu2+ transferred into oil phase per total Cu2+ introduced into the reaction system as shown in the following equation:
 
image file: c5ra23153a-t6.tif(6)
where Cuoil product, Cuoil feed, moil product, and moil feed are copper concentration in oil product, copper concentration in oil feed, mass of oil hydrolysis product and mass of oil feed (WCO), respectively. CCuSO4 is the concentration of copper solution used, while mCuSO4 solution is the mass of copper solution feed. Conversion of CuSO4 concentration into atomic Cu was done by using the ratio of molecular weight (MW) of Cu and CuSO4.

3. Results and discussion

3.1. Effects of temperature and time on hydrolysis of WCO

WCO used in this study comprised of 84.03% triglycerides, 9.28% diglycerides, 0.29% monoglycerides, and 6.30% FFAs. Initial FFA content of WCO obtained from acid value titration technique was relatively similar from the GC result (i.e., 12.35 ± 0.69 mg KOH/g oil equivalent to 6.21 ± 0.35% as oleic acid). This similarity was observed also in the previous study.25 Therefore, titration method was used in this study due to its accuracy and absence of damage risk to GC column by metal deposition.

Temperature played an important role in the endothermic hydrolysis of WCO. Increasing temperature drove FA yield and glycerides conversion faster towards equilibrium and increased Cu removal (Fig. 1). Above 225 °C, temperature had negligible effects on FA yield, acylglycerides conversion and Cu removal. Hence, 225 °C was selected as the temperature for evaluating the effect of the amount and concentration of synthetic wastewater.


image file: c5ra23153a-f1.tif
Fig. 1 Percentage of (A) FA yield, (B) acylglycerides conversion, and (C) copper removal of hydrolysis reaction at (■) 200 °C, (●) 225 °C, and (▲) 250 °C with control experiment points in open symbols (water to acylglycerides molar ratio of 30[thin space (1/6-em)]:[thin space (1/6-em)]1 and CuSO4 concentration of 500 mg kg−1).

All reactions reached equilibrium in about 8 h, judging from unchanging FFA yield, acylglycerides conversion, and AV (Fig. 1 and S2). From Fig. 1A and B, hydrolysis reaction resulted in the same values for FA yield and acylglycerides conversion at equilibrium (also equilibrium AV in Fig. S2) regardless of reaction temperature due to the same amount of water used, which was also confirmed by Sturzenegger and Sturm.26 The same water to acylglyceride molar ratio (30[thin space (1/6-em)]:[thin space (1/6-em)]1) used in the reactions implies that free glycerol was distributed between oil and aqueous phases to the same extent, which resulted in the same incomplete degree of hydrolysis (around 80%) in all reaction temperatures.2

It is worthwhile to notice that no induction period was observed in this study. Previous studies reported that by using high reaction temperature of 260–280 °C (ref. 2 and 27) and initial FFA content of 10–20 wt%,3,8 sufficient water can be supplied into oil phase by means of better water–oil miscibility to diminish induction period in oil hydrolysis. Since the temperature and initial FFA content of WCO used in this study are lower than the minimum required values stated above, it seems that a small amount of hydrophobic copper soap in the oil phase increased the solubility of water into the oil by the formation of unstable water-in-oil emulsion.28 Although recognized as unstable emulsion, agitation during the process may help the emulsion to be re-stabilized. In control experiments, catalysis of H+ from added H2SO4 accelerated FA formation that caused induction period to be reduced to about 30 min at 200 °C and 15 min at 225 °C (Fig. 1).

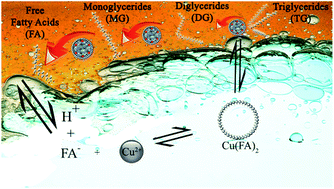
The mechanism shown in Fig. S3 explains how the reaction was facilitated in the presence of copper. Copper acted dominantly as Lewis acid, which was verified by comparably high FA yield in the copper catalyzed system and the control experiments. Direct copper soap catalysis mechanism provided small augmentation to Cu catalytic performance in the oil phase. Liberation of proton in the cation exchange between Cu2+ and fatty acids gave acidic final aqueous solution with pH of 2.2–3.0. No copper soap was formed in the control experiments, thus Cu removal percentages in the control experiments were zero.

Catalytic activity of metallic soaps, particularly copper soap in the oil hydrolysis process was highlighted also in the some patents.29,30 It is worth to noting that the amount of fatty acid produced during the reaction increased significantly with the increase of copper removal as shown in Fig. 1A and C. This again proves that the role of copper soap as catalyst in the fatty acid production.

The effect of temperature on copper removal can be easily understood from the proposed reaction between Cu2+ and deprotonated FA to produce hydrophobic metallic soap (Fig. S3). As temperature increases, water possesses relatively low dielectric constant (ε) and larger self-ionization constant (Kw), which facilitates oil–water miscibility and FA dissociation. Fig. S4 shows ε and −log(Kw) of water as function of temperature and pressure. The increasing FA deprotonation and enhanced oil–water miscibility promotes more reaction between Cu2+ and FAs. Fig. 1C depicts that accelerating effect of temperature towards Cu–FA equilibrium, which intensified at higher temperature. As shown in Fig. S4, Kw approaches constant with nearly the same low ε at 225 °C, which explains why this is the optimum temperature in affecting FA yield, conversion, and Cu removal. The indication of control system to catch up the catalytic performance of copper catalyzed system at 225 °C and higher can be explained by the same reason.

3.2. Effects of amount and concentration of copper solution on hydrolysis of WCO

As suggested by the reaction mechanism of copper soap formation in Fig. S3, copper ion quantity affects the amount of FAs in the product. Hence, appropriate amount of wastewater with a certain copper concentration should be carefully selected. In this study, CuSO4 concentrations from 250 to 1500 ppm were evaluated as the model of real industrial Cu-laden wastewater.16,17 Table 1 and Fig. 2 show the effect of amount of copper solution and copper concentration, respectively, on hydrolysis of WCO. As water to acylglyceride molar ratio was increased from 30[thin space (1/6-em)]:[thin space (1/6-em)]1 to 60[thin space (1/6-em)]:[thin space (1/6-em)]1, acylglycerides conversion increased from 83.02% to 93.65% (Table 1). This was caused by the diffusion of glycerol out from the oil phase by excessive water, which shifted equilibrium towards product formation.26,27,31 Although there was an improvement in acylglycerides conversion (10.63%) as water to acylglyceride molar was increased from 30[thin space (1/6-em)]:[thin space (1/6-em)]1 to 60[thin space (1/6-em)]:[thin space (1/6-em)]1, FA yield only increased 4.43%. In fact, as water to acylglyceride molar ratio was increased to 90[thin space (1/6-em)]:[thin space (1/6-em)]1, FA yield decreased to approximately the same value as that obtained at 30[thin space (1/6-em)]:[thin space (1/6-em)]1. The decrease in FA yield at increasing water feed was due to more Cu2+ involved in the reaction system, which consumed more FAs to generate copper soap as shown in the increase of copper amount in the oil phase (Table 1).
Table 1 Effect of copper solution amount on FA yield, acylglycerides conversion, Cu in the oil and Cu removal (CuSO4 concentration: 500 mg kg−1, T = 225 °C, t = 8 h)
Water/acylglycerides molar ratio FA yield (%) Acylglycerides conversion (%) Cu in the oil (mg kg−1 oil) Cu removal (%)
30[thin space (1/6-em)]:[thin space (1/6-em)]1 77.61 83.02 72.23 ± 0.72 51.82
60[thin space (1/6-em)]:[thin space (1/6-em)]1 82.04 93.65 209.67 ± 1.14 78.63
90[thin space (1/6-em)]:[thin space (1/6-em)]1 77.99 94.25 260.73 ± 3.52 65.66


image file: c5ra23153a-f2.tif
Fig. 2 Effect of copper solution concentration on (A) FA yield and acylglycerides conversion; (B) Cu removal and concentration of Cu in oil (water to acylglycerides molar ratio = 30[thin space (1/6-em)]:[thin space (1/6-em)]1, T = 225 °C, t = 8 h) with fitting result ofimage file: c5ra23153a-t12.tif (R2 = 0.966).

A sudden drop in copper removal at a water to acylglyceride molar ratio of 90[thin space (1/6-em)]:[thin space (1/6-em)]1 (Table 1) may be explained by the mixing behavior. To certain extent, adding water can improve mixing by creating less viscous oil–water mixture. However, more water tends to make low-density oil floating on the surface during mixing. The non-uniform mixture of oil and aqueous phase may result in less metal extraction by the proposed mechanism and may explain the diffusion limitation in glycerol extraction.

Reactor loading affects mixing profile, hence reactor performance. Table S1 shows that oil loading had little effects on FA yield and conversion. Nevertheless, mixing worsened at higher oil loading, as indicated by lower Cu content in oil and Cu removal, particularly at a water to acylglyceride molar ratio of 60[thin space (1/6-em)]:[thin space (1/6-em)]1. This was evident from an observation of oil floating away from the stirring bar at large oil loading while keeping fixed total reactants mass. At a water to acylglyceride molar ratio of 90[thin space (1/6-em)]:[thin space (1/6-em)]1, the effect of oil loading was less pronounced since water was in large excess for both oil loading studied (27.49 g and 48.12 g).

Increasing CuSO4 concentration had insignificant effect on the increase of acylglycerides conversion as expected, since catalyst can only accelerate the reaction without affecting equilibrium yield. The slight increase in acylglycerides conversion at high CuSO4 concentration (1250 and 1500 mg kg−1) in Fig. 2A may be due to the additional Cu2+ that reacted with FAs that shifted the equilibrium to acylglycerides conversion. Formation of more copper soap that yielded more driving force for copper diffusion into oil phase is evident from the rise of Cu content in oil and Cu removal in Fig. 2B.

While Cu concentration in the oil product increased linearly with the linear increase of CuSO4 concentration, Cu removal increases in hyperbolic trend similar to that of Michaelis–Menten kinetic profile. That similarity can be traced through the analogy between the formation of copper soap and Michaelis–Menten assumption of limited substrate and excessive enzyme. Removal of copper began in aqueous phase, where a limited portion of FAs was dissolved in subcritical water.8 Reaction then proceeded between Cu2+ and water-soluble FAs as described in Fig. S3. Copper soap was then transferred from aqueous phase into oil phase because of its hydrophobicity. Increasing copper concentration triggered competition between Cu2+ ions to react with finite amount of FAs in aqueous phase. At certain point, addition of copper only slightly increased the removal percentage due to Cu–FA reaction equilibrium.

A sudden drop in FA yield at 1000 mg kg−1 suggests micellar solubilization of FAs by copper soap that remained in aqueous phase. Although copper soap is insoluble in water, its existence in aqueous phase after reaction was probably stabilized by the extracted glycerol and small amounts of emulsifier (monoglycerides and diglycerides) existed in the aqueous phase. A series of slightly turbid solution that become more yellowish (Fig. S5) shows micellar solubilization enhancement of FAs with increasing CuSO4 concentration.

3.3. Comparison of catalytic and non-catalytic hydrolysis of WCO

Autocatalysis by FFAs in oil feedstock is known to accelerate oil hydrolysis in sub- or supercritical water by utilizing H+ from the dissociation of FAs. Despite the fact of acid catalysis mechanism, autocatalysis system is often named as non-catalytic because of the absence of externally added catalyst, which is CuSO4 in this study. As shown in Table S2, FA yield and acylglycerides conversion of non-catalytic system are lower than that of the catalytic system at temperatures below 250 °C. The presence of copper resulted in higher reaction rate and water-in-oil solubility than those without copper. Lower water solubility in the absence of copper soap was characterized by the induction period in the non-catalytic system (Fig. 3). From the same graph, the control system showed a very small induction period (≤15 min) due to the catalytic role of H+ from a small amount of added H2SO4, which was enhanced in subcritical water condition.
image file: c5ra23153a-f3.tif
Fig. 3 Acid value–time profile of Cu-catalyzed and non-catalyzed waste cooking oil hydrolysis reactions with respect to control system (dilute H2SO4, pH 5.0) at 225 °C (water to acylglycerides molar ratio = 30[thin space (1/6-em)]:[thin space (1/6-em)]1).

Equal FA yield and acylglycerides conversion between catalytic and non-catalytic systems at 250 °C indicates the remarkable effect of autocatalysis mechanism. Application of high temperature (250 °C and higher) to induce autocatalysis of FFA was also observed in previous studies.3,32,33 Since both systems worked at the same temperature and pressure, there is likelihood that autocatalysis scheme also occurred in the catalytic system. At 250 °C and reacted for 6 h, about the same FA yield and acylglycerides conversion was obtained in both catalytic and non-catalytic systems, which reveals that non-catalytic system has slower reaction rate at lower temperature.

A close look at Table S2 reveals that there are discrepancies between FA yield and acylglycerides conversion in either catalytic or non-catalytic system. The difference between FA yield and conversion may be caused by the loss of FAs either from being extracted into aqueous phase during reaction and/or from washing of oil product. An almost constant difference between FA yield and acylglycerides conversion (5–7%) for catalytic, non-catalytic, and control systems denotes minimum FA loss in the catalytic system and leads to stronger conviction that diglycerides and monoglycerides are responsible for the loss. Holliday et al. (1997) also reported FA loss in the form of emulsion in their study on the subcritical water hydrolysis of vegetable oils.

Based on the current data, mass balance of fatty acid can be built and analyzed to evaluate specific FA loss as the result of copper soap formation in this study. Evaluation by the mass balance of copper ion with the aqueous phase as the boundary system was not performed since the amount of each copper species (i.e., free copper ion and copper soap in aqueous phase) cannot be specified. FA mass balance with oil phase as the boundary system can be written as follows:

 
image file: c5ra23153a-t7.tif(7)
 
image file: c5ra23153a-t8.tif(8)
when the reaction achieved equilibrium, the equation can be simplified to:
 
0 = FAinitial − (FAfinal + FAloss to aqueous phase) + FAfrom acylglycerides − FAreacted with Cu (9)

By introducing measured parameter for each term, the final mass balance becomes:

 
0 = AVinitial − AVfinal − FAloss to aqueous phase + (EVinitial − EVfinal) − FAreacted with Cu (10)

FA reacted with Cu term can be neglected in the control system, thus FA loss to the aqueous phase as water soluble acylglycerides can be calculated using the data in the control experiment at equilibrium state.

 
Control: 0 = AVinitial − AVcontrol final − FAloss to aqueous phase + (EVinitial − EVcontrol final) (11)
 
FAloss to aqueous phase = AVinitial − AVcontrol final + (EVinitial − EVcontrol final) (12)

FA reacted with Cu then can be calculated by substituting the value of FA loss from the control experiment into eqn (10).

 
FAreacted with Cu = AVcontrol final − AVfinal + EVcontrol final − EVfinal, (13)
where lower indices of “control final” and “final” refer to the equilibrium state of oil in control and copper catalyzed system (reactions at 225 °C for 8 h and 250 °C for 6 h), respectively. The value of each measured property and the predicted amount of copper soap formed as Cu removal percentage are presented in Table 2. The predicted copper soap formed from this balance shows comparable values to the copper removal percentage presented in Fig. 1C. Slight difference between the predicted and measured values (0.72% and 3.46% for reaction at 225 °C and 250 °C, respectively) indicates that some copper soap formed might be dissolved in the aqueous phase. At higher temperature (250 °C), it was possible that more glycerol was extracted more into the aqueous phase, thus enhancing the stability of copper soap in the aqueous phase. Since the amount of Cu introduced into the system was considerably small, the amount of FA lost due to reaction with Cu was also small (ca. 0.06–0.07% as oleic acid). This can be viewed as positive point in using copper in wastewater as the catalyst for oil hydrolysis.

Table 2 Mass balance of fatty acids in equilibrium state of control and copper-catalyzed systems (CuSO4 concentration: 500 mg kg−1 and water/acylglycerides molar ratio = 30[thin space (1/6-em)]:[thin space (1/6-em)]1)
Temperature (°C) time (h) AVcontrol final (mg KOH/g oil) AVfinal (mg KOH/g oil) EVcontrol final (mg KOH/g oil) EVfinal (mg KOH/g oil) Mass yield (%) FAreacted with Cu (mg KOH/g oil) Cu soap formeda (%)
a image file: c5ra23153a-t9.tif.
225 8 170.26 170.46 34.54 34.22 92.09 0.12 52.54
250 6 170.34 170.31 34.34 34.24 92.10 0.13 56.92


3.4. Metal content in product

Metal concentrations in the hydrolyzed oil product are summarized in Table 3. Copper content in the hydrolyzed oil increased drastically due to Cu2+ uptake during the reaction. A slight increase in iron content may be due to leaching of reactor surface during reaction. Concentrations of other metals drop as the result of being absorbed into water phase in the course of reaction.
Table 3 Concentration of metals in waste cooking oil and product of copper-catalyzed hydrolysis (CuSO4 concentration: 500 mg kg−1, water/acylglycerides molar ratio = 30[thin space (1/6-em)]:[thin space (1/6-em)]1, T = 225 °C, t = 8 h)a
Element Concentration (mg kg−1) Max. (mg kg−1 oil) Reference
Waste cooking oil Hydrolyzed oil
a ND: not detected.
Cu 4.56 72.23 0.1–0.4 Codex Stan. 210-1999
Fe 5.11 7.18 1.5–7.0 Codex Stan. 210-1999
Pb 0.36 ND 0.1 Codex Stan. 19-1981
As 0.02 ND 0.1 Codex Stan. 19-1981
Ca & Mg 8.32 4.94 5.0 ASTM D6751
Na & K 13.01 4.14 5.0 ASTM D6751
Total ash (%) 0.0045 0.0096 0.02 ASTM D6751


Metal contamination in WCO and hydrolyzed oil has definitely disqualified its utilization in food as recommended in the Codex Alimentarius standards.34,35 Biodiesel produced from hydrolyzed product of WCO catalyzed by copper containing wastewater may pass ASTM D6751 since excessive copper and other metal contaminants may be removed in the washing step during biodiesel production. To be merit for food and pharmaceutical application, oil product may need to be purified by acid extraction of metal or fatty acid extraction by means of distillation or supercritical CO2 extraction to separate fatty acids from metal soap.5,36

High metal contamination on the FAs product signifies the capability of this studied process for reducing heavy metal toxicity in wastewater. Several published studies had referred the potency of vegetable oil to extract heavy metal such as Hg2+,37 Cu2+,38–40 Cr6+,41 and Cd2+.42 The critical role of carrier agent existence in vegetable oil to achieve high metal removal percentage was demonstrated by 50–100% copper removal after 24–28 h of extraction in the presence of di-2-ethylhexyl phosphoric acid as carrier agent38 and only 10% removal by extraction using various vegetable oil (i.e., corn oil, canola oil, sunflower oil, and soybean oil) alone.39 Compared to previous studies, the process studied here shows that at least 5 times Cu removal can be achieved in shorter time without additional carrier agent. Furthermore, production of marketable FAs amplifies the advantage of this studied process than the costly conventional wastewater treatment. Enhancement of metal capture to higher level is still possible by wastewater alkalization prior to the hydrolysis process43 or applying multistage reactor–extractor design to break metal saturation limit.44 Recycle of aqueous product up to 5 hydrolysis reaction batches of pristine WCO can increase copper removal up to 98.87% with a cost of decreasing FA yield and acylglycerides conversion in each cycle due to glycerol accumulation (Table 4). With such a low copper concentration left in the aqueous phase, remaining glycerol and fatty components in wastewater can be further treated by biological treatment or reused as nutrient in the biobased process.45

Table 4 Sequential recycle of aqueous product for batch hydrolysis of pristine WCO (Initial CuSO4 concentration: 500 mg kg−1, water/acylglycerides molar ratio = 30[thin space (1/6-em)]:[thin space (1/6-em)]1, T = 225 °C, t = 8 h)
Batch no. (i) Cumulative mass of make-up water (g) Acid value (mg KOH g−1) FA yield (%) Acylglycerides conversion (%) Cu in oil (mg kg−1 oil) Cumulative Cu removala (%) Cu2+ in water phaseb (mg kg−1)
a image file: c5ra23153a-t10.tif.b image file: c5ra23153a-t11.tif.
1 0 170.46 ± 0.25 77.61 83.03 72.23 ± 0.72 51.82 95.92
2 0.8 158.61 ± 0.21 72.23 77.56 45.13 ± 0.35 85.23 29.40
3 1.2 148.04 ± 0.15 67.38 72.96 22.12 ± 0.09 97.73 4.51
4 1.6 127.69 ± 0.31 57.86 64.34 12.12 ± 0.06 98.84 2.30
5 2.0 103.20 ± 0.36 46.15 53.31 7.36 ± 0.05 98.87 2.26


4. Conclusion

Hydrolysis of WCO by copper containing synthetic wastewater was performed. In situ formed copper soap catalyst worked particularly as Lewis acid in the reaction and as the vehicle for water to move into oil phase at low temperature. Higher temperature provides more deprotonated FA, which promotes copper soap formation. Inappropriate amount and concentration of CuSO4 may reduce net FA yield in the product. Autocatalysis by FFA may involve in the overall mechanism. Although the oil product requires further purification for direct application, this study shows a possible process for direct reuse of heavy metal containing wastewater to produce FAs from low quality oil. Studied process could remove about 51.82% and 98.87% of copper from wastewater in a batch process and 5 stepwise batch processes, respectively.

References

  1. R. D. Micic, M. D. Tomić, F. E. Kiss, E. B. Nikolić-Djorić and M. Ð. Simikić, J. Supercrit. Fluids, 2015, 103, 90–100 CrossRef CAS.
  2. V. Mills and H. K. McClain, Ind. Eng. Chem., 1949, 41, 1982–1985 CrossRef CAS.
  3. E. Minami and S. Saka, Fuel, 2006, 85, 2479–2483 CrossRef CAS.
  4. R. L. Holliday, J. W. King and G. R. List, Ind. Eng. Chem. Res., 1997, 36, 932–935 CrossRef CAS.
  5. G. C. Gervajio, in Kirk-Othmer Chemical Technology of Cosmetics, ed. A. Seidel, John Wiley & Sons, New Jersey, 2013, pp. 450–451 Search PubMed.
  6. K. Ngaosuwan, E. Lotero, K. Suwannakarn, J. James, G. Goodwin and P. Praserthdam, Ind. Eng. Chem. Res., 2009, 48, 4757–4767 CrossRef CAS.
  7. L. Lascaray, Ind. Eng. Chem. Res., 1949, 41, 786–790 CrossRef CAS.
  8. L. Lascaray, J. Am. Oil Chem. Soc., 1952, 29, 362–366 CrossRef CAS.
  9. V. R. Murty, J. Bhat and P. K. A. Muniswaran, Biotechnol. Bioprocess Eng., 2002, 7, 57–66 CrossRef CAS.
  10. J. K. Satyarthi, D. Srinivas and P. Ratnasamy, Appl. Catal., A, 2011, 391, 427–435 CrossRef CAS.
  11. Y. Zhang, M. A. Dubé, D. D. McLean and M. Kates, Bioresour. Technol., 2003, 90, 229–240 CrossRef CAS PubMed.
  12. M. Pugazhvadivu and K. Jeyachandran, Renewable Energy, 2005, 30, 2189–2202 CrossRef CAS.
  13. M. A. Barakat, Arabian J. Chem., 2011, 4, 361–377 CrossRef CAS.
  14. E. Farahat and H. W. Linderholm, Sci. Total Environ., 2015, 512–513, 1–7 CrossRef CAS PubMed.
  15. M. Al-Shannag, Z. Al-Qodah, K. Bani-Melhem, M. R. Qtaishat and M. Alkasrawi, Chem. Eng. J., 2015, 260, 749–756 CrossRef CAS.
  16. M. Kul and K. O. Oskay, Hydrometallurgy, 2015, 155, 153–160 CrossRef CAS.
  17. J.-C. Lou, Y.-J. Huang and J.-Y. Han, J. Hazard. Mater., 2009, 170, 620–626 CrossRef CAS PubMed.
  18. S. Bang, J.-W. Choi, K. Cho, C. Chung, H. Kang and S. W. Hong, Chem. Eng. J., 2016, 288, 525–531 CrossRef CAS.
  19. I. Petrinic, J. Korenak, D. Povodnik and C. Hélix-Nielsen, J. Cleaner Prod., 2015, 101, 292–300 CrossRef CAS.
  20. K. S. Low, C. K. Lee and S. C. Liew, Process Biochem., 2000, 36, 59–64 CrossRef CAS.
  21. H. J. Beckmann, World Conference on Oleochemicals Into the 21st Century, Kuala Lumpur, 1990 Search PubMed.
  22. A. Casas, M. J. Ramos, J. F. Rodriguez and A. Perez, Fuel Process. Technol., 2013, 106, 321–325 CrossRef CAS.
  23. L. H. Huynh, P. L. T. Nguyen, Q. P. Ho and Y.-H. Ju, Bioresour. Technol., 2012, 123, 112–116 CrossRef CAS PubMed.
  24. A. D. Leonardis, V. Macciola and M. D. Felice, Int. J. Food Sci. Technol., 2000, 35, 371–375 CrossRef.
  25. R. Alenezi, G. A. Leeke, R. C. D. Santos and A. R. Khan, Chem. Eng. Res. Des., 2009, 87, 867–873 CrossRef CAS.
  26. A. Sturzenegger and H. Sturm, Ind. Eng. Chem., 1951, 43, 510–515 CrossRef CAS.
  27. E. A. Lawrence, J. Am. Oil Chem. Soc., 1954, 31, 542–544 CrossRef CAS.
  28. R. C. Williams and H. W. Russel, US Pat., 1,955,522, 1934.
  29. UK Patent, 466, 596, 1935.
  30. J. Sinnema, L. De Graef, T. Meisel and I. Mussler, US Pat., 646,146 B1, 2003.
  31. J. Kansedo and K. T. Lee, Chem. Eng. J., 2014, 237, 1–7 CrossRef CAS.
  32. A. L. Milliren, J. C. Wissinger, V. Gottumukala and C. A. Schalla, Fuel, 2013, 108, 277–281 CrossRef CAS.
  33. J. S. S. Pinto and F. M. Lanças, J. Braz. Chem. Soc., 2006, 17, 85–89 CrossRef CAS.
  34. FAO/WHO, Codex Alimentarius, 1981 Search PubMed.
  35. FAO/WHO, Codex Alimentarius, 1999 Search PubMed.
  36. A. Matlack, Introduction to Green Chemistry, CRC Press, 2nd edn, 2010 Search PubMed.
  37. K. Chakrabarty, P. Saha and A. K. Ghoshal, J. Membr. Sci., 2010, 350, 395–401 CrossRef CAS.
  38. S. H. Chang, T. T. Teng, N. Ismail and A. F. M. Alkarkhi, J. Hazard. Mater., 2010, 190, 197–204 CrossRef PubMed.
  39. S. Chang, J. Kamaruzaman, T. Tjoontow and I. Norli, Proceeding of 5th IASME/WSEAS International Conference on Energy & Environment, World Scientific and Engineering Academy and Society (WSEAS), Wisconsin, USA, 2010, pp. 96–100 Search PubMed.
  40. P. Venkateswaran, A. N. Gopalakrishnan and K. Palanivelu, J. Environ. Sci., 2007, 19, 1446–1453 CrossRef CAS.
  41. S. Björkegren and R. F. Karimi, Master, Chalmers University of Technology, 2012.
  42. A. L. Ahmad, M. M. H. S. Buddin, B. S. Ooi and A. Kusumastuti, Am. J. Chem., 2015, 5, 1–6 CrossRef.
  43. J. Šiška, Hydrometallurgy, 2005, 76, 155–172 CrossRef.
  44. P. J. D. Lloyd, in Solvent Extraction Principles and Practice, ed. J. Rydberg, M. Cox, C. Musikas and G. R. Choppin, Marcel Dekker, Inc., USA, 2nd edn, 2004, ch. 8 Search PubMed.
  45. J. S. Yang, J. Cao, G. L. Xing and H. L. Yuan, Bioresour. Technol., 2015, 175, 537–544 CrossRef CAS PubMed.

Footnote

Electronic supplementary information (ESI) available. See DOI: 10.1039/c5ra23153a

This journal is © The Royal Society of Chemistry 2016
Click here to see how this site uses Cookies. View our privacy policy here.