Synthesis and properties of nanocrystalline π-SnS – a new cubic phase of tin sulphide

R. E. Abutbulab, E. Segevb, L. Zeiribc, V. Ezerskyb, G. Makovab and Y. Golan*ab
aDepartment of Materials Engineering, Ben-Gurion University of the Negev, Beer-Sheva 84105, Israel. E-mail: ygolan@bgu.ac.il
bIlse Katz Institute for Nanoscale Science and Technology, Ben-Gurion University of the Negev, Beer-Sheva 84105, Israel
cChemistry Department, Ben-Gurion University of the Negev, Beer-Sheva 84105, Israel

Received 3rd November 2015 , Accepted 23rd December 2015

First published on 5th January 2016


Abstract

We report on the synthesis of the newly discovered cubic phase of tin sulfide π-SnS and compare its properties to the well-known phase of tin sulfide, α-SnS. Shape control was achieved by the variation of synthesis parameters, resulting in cubic, rhombic dodecahedral and tetrahedral shapes of the π-SnS nanoparticles. X-ray diffraction provided authentication of the proposed model and refined determination of the lattice parameter a = 11.595 Å. Raman spectroscopy showed a substantial shift towards higher energies and peak splitting for π-SnS. Optical absorption spectroscopy indicated an indirect band gap of 1.53 eV, in good agreement with density functional theory (DFT) calculations indicating a band gap greater than that of α-SnS. DFT total energy calculations show that the π-SnS phase is energetically similar to α-SnS, and is significantly more stable than the hypothetical ideal rocksalt structure of SnS.

Introduction

Tin sulfide (SnS) has attracted much attention in recent years due to its narrow band gap that displays optical activity in the near-infrared (NIR), with potential applications in photovoltaic devices and NIR detectors. Being inexpensive, earth-abundant, environmentally friendly and free from heavy metals has also contributed to its attractiveness. In addition, SnS possesses desirable properties for incorporation in solar cells such as high absorption properties and high hole mobility.1,2 Previous syntheses of SnS nanoparticle mainly resulted in nanoparticles with an elongated platelet morphology which corresponded to the orthorhombic structure referred to as herzenbergite or α-SnS.3–8 Using galvanostatic deposition of thin films, a primitive orthorhombic phase has been discovered, also designated as d-SnS.9 Several reports yielded tetrahedral or cube like nanoparticles which in some cases were erroneously reported to possess the zinc-blende (ZB) structure.10–16 More recent publications reported on SnS thin films obtained using chemical bath deposition (CBD) that possesses a cubic crystal structure with a large unit cell (a = 11.592 Å).17,18 We have recently reported using precession electron diffraction (PED) in the transmission electron microscope (TEM) that these nano-tetrahedra particles are of a new cubic structure with an exceptionally large lattice parameter (a = 11.7 Å) referred to as π-SnS,19 yet due to the minute amounts of π-phase obtained the material properties of this new phase could not be studied. In this work, we report on progress in the synthetic protocol which now enables us to synthesize shape controlled powder samples of pure α-SnS and π-SnS nanoparticles upon demand. This allowed for characterization of π-SnS in comparison to α-SnS using a variety of techniques, including X-ray diffraction (XRD), optical absorption measurements and Raman spectroscopy. Density functional theory calculations (DFT) have been applied to validate the stability of π-SnS as well as the experimentally observed indirect band gap.

Experimental

(a) Materials

Purified water (18.2 MΩ cm) was obtained from a Millipore filtration system. Potassium ethyl xanthogenate (96%), tin(II) chloride (SnCl2, reagent grade, 98%), oleylamine (OLA, >98%), octadecylamine (ODA, >99.0%), hexamethyldisilazane (HMDS, 99.9%), elemental sulphur powder (S, >99.998%), tin(II) sulfide powder (herzenbergite, >99.99%), were purchased from Sigma-Aldrich and used without further purification. Methanol (99.8%) and chloroform (99.9%) were purchased from Bio-Lab and used without further purification.

(b) Synthesis of tin-ethylxanthate precursor

1.774 gram of SnCl2 was added to 100 mL of purified water and stirred until dissolution. In another flask, 3 gram of potassium-ethyl-xanthogenate (oethylxantic acid) was added to 400 mL of purified water until dissolution. Then, both solutions were mixed to form a yellow suspension, which was washed 5 times with water. The washing process was conducted by stirring for 5 minutes, allowing 15 minutes to precipitate, decanting the excess liquid, and then refilling with purified water. Finally, the solution was filtered and dried, resulting in a yellow powder.

(c) Synthesis of tin sulfide nanoparticles using tin-ethylxanthate as precursor

1.53 gram of octadecylamine (ODA, 5.67 mmol) surfactant and 0.094 gram of tin-ethylxanthate were added to a three necked flask. The flask was sealed and purged with argon 3 times and heated to 120 °C. After 30 minutes, 0.4 mL of HMDS was added. Bubbles evolved from the melt and shortly subsided. The reaction was left at this state for another 30 minutes under vigorous stirring. Then, the temperature was raised to predetermined value (usually 220 °C) and the reaction quickly turned black, as indication for nanoparticle formation. After 2 hours of reaction time, the synthesis was arrested by removing the flask from the heating mantle and its content was transferred into beaker with 1[thin space (1/6-em)]:[thin space (1/6-em)]1 chloroform[thin space (1/6-em)]:[thin space (1/6-em)]methanol solution and the resulting product was centrifuged for 10 minutes at 2800 rpm. The process of washing and centrifuging was repeated twice, and then the product was left to dry in air.

(d) Synthesis of tin sulfide nanoparticles using tin chloride and elemental sulfur precursors

In a typical reaction procedure 2 mL of oleylamine and 18.9 mg (0.1 mmol) of SnCl2 were loaded to a three necked flask equipped with a magnetic stirring bar. The flask was flushed with argon three times, placed in a heating mantle and then the temperature was raised to 120 °C. The melt was purged with argon for 30 minutes under vigorous stirring to remove moisture and undesired dissolved gases. 0.1 mL of HMDS was injected into the flask and the reaction was left at this temperature for another 30 min. Gas bubbles evolved from the melt instantly after injecting HMDS and shortly subsided. In parallel, 1 mL of oleylamine and 3.2 mg (0.1 mmol) of elemental sulfur were loaded onto a single necked round bottom flask, and flushed with argon three times. Then the flask was placed in a hot oil bath at 160 °C for 1 h. The clear solution turned yellowish-red as the elemental sulphur dissolved in the molten oleylamine. The temperature of the Sn-precursor flask was then further increased to 150 °C at a rate of 5 degrees per min. Once the desired temperature was reached, the S-precursor was swiftly injected into the Sn-precursor. The reaction turned dark brown within a few minutes after injection. The synthesis was stopped after 5 min by removing the flask from the heating mantle and its content were transferred into beaker with 1[thin space (1/6-em)]:[thin space (1/6-em)]1 chloroform[thin space (1/6-em)]:[thin space (1/6-em)]methanol solution and the resulting product was centrifuged for 10 minutes at 2800 rpm. The process of washing and centrifuging was repeated twice, and then the product was left to dry in air.

α-SnS platelet nanoparticles were synthesized similarly as the synthesis of the π-SnS by keeping all reaction parameters the same, except for changing the temperature of the reaction to 240 °C instead of 150 °C. After injecting the S-precursor, the solution instantly turned black.

(e) Characterization methods

Conventional TEM was carried out using a Tecnai G2 TEM operating at 120 kV. Analytical TEM analyses were performed using a JEOL JEM-2100F microscope system with accelerating voltage of 200 kV, with energy dispersive spectroscopy (EDS) analysis performed using a JEOL JED-2300T energy dispersive X-ray spectrometer. Probe tracking (drift correction), allowed chemical analysis at the nanometer scale. JEOL Analytical Station software (v. 3.8.0.21) was used for the EDS data analysis. Standardless quantitative analysis was performed using the Cliff-Lorimer method. TEM samples were prepared by solvent evaporation from chloroform suspensions. Powder X-ray diffraction was performed on a Panalytical Empyrean powder diffractometer equipped with a position sensitive X'Celerator detector using Cu Kα radiation (λ = 1.5405 Å). Rietveld refinement and quantitative extraction of phase ratios and were carried out using “PowderCell for Windows” V2.4.20

Optical absorption measurements were performed on a Shimadzu UV 3600 spectrophotometer from chloroform suspensions using Hellma 110-QX cells. The Raman system comprised a Jobin-Yvon LabRam HR 800 micro-Raman system, equipped with a Synapse CCD detector. The excitation source was an argon laser (514.5 nm) with a power of 3 mW on the sample. In most of the measurements the laser power was reduced by ×100 using ND filters. The edge filter used drastically reduced the signal measured below 100 cm−1, potentially affecting peak position and intensity. The reduction in sensitivity was more significant with decreasing wavenumber (edge filter effect). The laser was focused with an ×100 objective to a spot of about 4 μm in diameter. The grating used was a 600 g mm−1 with a confocal hole of 100 μm.

Data analysis and processing was carried out using “OriginPro 9.0.0 SR2”. Gaussian peak function was used for peak deconvolution process.

Density functional theory based calculations of the atomic and electronic structure were performed within the plane-wave pseudopotential approach using Quantum Espresso and scalar relativistic norm-conserving pseudopotentials included therein. Exchange correlation was represented in the GGA by the PBE functional21 and a 75 Ry energy cutoff was employed in the plane-wave expansion of the wavefunctions and 300 Ry for the density. Electronic structure total energy calculations were converged to better than 10−8 Ry per unit cell. Atomic structure was determined by allowing relaxation of the system until forces were less than 10−3 Ry Bohr−1.

Results and discussion

We present two types of synthetic protocols. Earlier attempts made use of tin-ethylxanthate as precursor for both the tin and the sulphide, while in more recent experiments a method involving two precursors was used. For the single precursor experiments it was found that at lower temperatures in the range of 140–160 °C, the obtained nanoparticles are very small, widely agglomerated and show irregular shapes. Increasing the temperature to range of 180–240 °C lead to formation of the typical platelet morphology (Fig. S1 in ESI), which was confirmed by XRD to correspond to the conventional α-SnS phase (herzenbergite SnS, JCPDS no. 39-0354, a = 4.3291 Å, b = 11.1923 Å, c = 3.9838 Å).3,4,6 Changing the reaction duration in a range from 20 minutes to 2 hours had little effect on the resulting product. However, by adding a small amount of HMDS (0.135 mM), two distinct nanoparticle morphologies were obtained, nano-platelets and nano-tetrahedra.19 It was found that HMDS affects the reaction rate; in absence of HMDS, the reaction reaches completion indicated by a colour change to black only after a long period of time (approx. 2 hours). Increased amount of HMDS resulted in platelet morphology only. We note that the nano-tetrahedra particles are the subject of interest in this paper since they correspond to the newly discovered π-SnS phase.19 Consequently, we sought to increase the yield of the nano-tetrahedra by changing the capping agent. While the only capping agent used so far was ODA, in this work we have gradually replaced equivalent amounts of ODA with other ligands: oleylamine (OLA), trioctylphosphine (TOP) and oleic acid (OA). It was found that a specific ratio of OLA and ODA in presence of HMDS was successful in increasing the yield of the nano-tetrahedra particles. Furthermore, in some cases, instead of nano-tetrahedra particles, rhombic dodecahedra and truncated tetrahedra were obtained (Table 1). We note that others have also reported on truncated tetrahedral particles,11 yet rhombic dodecahedral nanoparticles have not been previously observed in the binary SnS nanoparticle system and are reported here for the first time (see ESI for further information). Using “PowderCell” software,20 quantitative analysis was performed on the XRD data to extract the phase ratio obtained in each synthesis. This was made possible by using the structural model we have previously presented19 and that is further confirmed in this paper. The results are summarized in Table 1. The experimental data in Table 1 establishes a strong connection between the phase ratio obtained (along with corresponding nanoparticle morphology) and the ODA[thin space (1/6-em)]:[thin space (1/6-em)]OLA ratio used for the synthesis. At first, decreasing the concentration of ODA molecules with respect to OLA molecules lowered π-SnS yield. Thereafter, increasing the OLA concentration up to a ratio of 1[thin space (1/6-em)]:[thin space (1/6-em)]8 resulted in increased yield of π-SnS. Further replacement of the ODA molecules entirely by OLA resulted in slight reduction in π-SnS yield, as indicated in Table 1.
Table 1 Nanoparticle morphology and α-SnS[thin space (1/6-em)]:[thin space (1/6-em)]π-SnS phase ratio as a function of the ratio of octadecylamine (ODA) to oleylamine (OLA) used in the synthesis. Note that ODA and OLA had greater influence on the yield of π-SnS nanoparticles in comparison to TOP and OA. All experiments were carried out in presence of HMDS
ODA[thin space (1/6-em)]:[thin space (1/6-em)]OLA ODA only 2[thin space (1/6-em)]:[thin space (1/6-em)]1 1[thin space (1/6-em)]:[thin space (1/6-em)]1 1[thin space (1/6-em)]:[thin space (1/6-em)]2 1[thin space (1/6-em)]:[thin space (1/6-em)]8 OLA only
α-SnS[thin space (1/6-em)]:[thin space (1/6-em)]π-SnS 87.5%[thin space (1/6-em)]:[thin space (1/6-em)]12.5% 96.5%[thin space (1/6-em)]:[thin space (1/6-em)]3.5% 83.4%[thin space (1/6-em)]:[thin space (1/6-em)]16.6% 72.2%[thin space (1/6-em)]:[thin space (1/6-em)]27.3% 65.3%[thin space (1/6-em)]:[thin space (1/6-em)]34.7% 68.9%[thin space (1/6-em)]:[thin space (1/6-em)]31.1%
π-SnS shape Tetrahedra Tetrahedra Tetrahedra Rhombic dodecahedra Truncated tetrahedra Tetrahedra


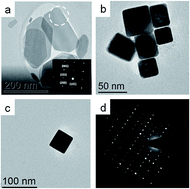
The dual precursor syntheses resulted in two different morphologies, platelets (Fig. 1a) and cube-like particles (Fig. 1b). As opposed to the single precursor synthesis protocol where separation between the phases was not achieved, here pure samples of the two phases (and subsequent morphologies) were obtained by controlling the reaction temperature. At 150 °C nano-cubes (π-SnS) were obtained, while upon changing the reaction temperature to 240 °C, the platelet morphology (α-SnS) was obtained. The two morphologies exhibited narrow size and shape distribution with average size of 43 nm and standard deviation of 0.4 nm. Both types of nanoparticles were subject to EDS chemical analysis in the TEM, and showed a Sn to S ratio of 1[thin space (1/6-em)]:[thin space (1/6-em)]1 within the experimental error (±5%) (not shown). Selected area electron diffraction (SAED) from the platelets indicated the α-SnS phase with the majority of the platelets oriented along the [010] zone axis (ZA). Combining this information with the XRD data shown in Fig. 2a confirms that these platelets belong to the conventional α-SnS phase. TEM and SAED examination of the cube-like nanoparticle sample showed cubic symmetry and the exceptionally large lattice parameter of 11.7 Å which confirmed the structure to be the same as the recently reported π-SnS.15 Since the synthetic procedure reported above now allows to separately obtain these two phases in pure form, XRD measurements were carried out for each of the powders synthesized. In Fig. 2, XRD of both kinds of nanoparticles are presented separately, clearly confirming that each type corresponds to a different crystal structure. In a previous report, we provided full structure solution of the new π-SnS phase using precession electron diffraction (PED) in the TEM, yet we were unable to separate enough π-SnS material to achieve full structure solution using powder XRD methods.19 Using the structural model obtained from PED, an XRD pattern was simulated using “PowderCell” software and compared to the acquired pattern shown in Fig. 2b (see Fig. S2 in ESI).20 Rietveld refinement showed that the proposed model well-matched to the obtained diffractogram, affirming the correctness of the structural model with a slight refinement of the lattice constant, which is now determined to be a = 11.595 Å. We note that XRD is a more suitable technique for accurate determination of the lattice parameter. We have also similarly analysed XRD diffractograms of SnS thin films obtained by chemical bath deposition (CBD).17,18 The XRD data for the CBD thin films well-matches our structural model for π-SnS and will be reported in detail in a separate publication. This points out that the π-SnS phase is not restricted only to surfactant assisted nanoparticles, and can be obtained in the form of thin films as well.


image file: c5ra23092f-f1.tif
Fig. 1 TEM micrographs showing (a) a cluster of SnS nanoparticles with platelet morphology inset: SAED taken from marked area indicating α-SnS oriented at [010] ZA, (b) a number of cube-shaped nanoparticles, (c) a single cube-shaped nanoparticle, (d) SAED obtained from (c), which matches to the [001] ZA of the new π-SnS phase.19

image file: c5ra23092f-f2.tif
Fig. 2 Powder XRD patterns of (a) SnS nanoparticles with platelet morphology (b) SnS nanoparticles with cube-like morphology.

From the two synthetic protocols described above we can outline key parameters that play crucial role in determining the phase yield of π-SnS. It is obvious that in the dual precursor protocol, temperature is one of those parameters. We can thus hypothesize that the π-SnS phase is a kinetically accessible phase where an energy barrier prevents it from immediately transforming into α-SnS. In that scenario, increasing the temperature will induce phase transition, as is indeed observed experimentally. In the case of the single precursor protocol, we found that the phase ratio can be affected primarily by the capping agent composition. It is also reasonable to assume, and showed below for bulk energies using DFT, that the surface and bulk energies of π-SnS and α-SnS phases are very close. The interaction at the surface between the growing nanocrystal and the capping agent determines the energetically favourable crystal facet. Under specific conditions, this favourable facet corresponds to the cubic phase, thus leading to the formation of π-SnS nanoparticles. We note also that current microelectronic thin film technology relies primarily on cubic based materials such as Si and GaAs. Thus, it is important to identify new semiconducting materials with cubic structure that have desirable properties and that can be integrated with Si and GaAs.

In Fig. 3 we present four distinct shapes obtained using the synthetic protocols described in this work: cube, rhombic dodecahedra, truncated tetrahedra and tetrahedra. Each of these shapes was obtained using different synthetic conditions. The dual precursor synthesis yielded only cubes while rhombic dodecahedra, tetrahedra and truncated tetrahedra were synthesized using the single precursor route. In the one-pot synthesis, the shape of the nanoparticles was determined by the ligand composition. In ODA[thin space (1/6-em)]:[thin space (1/6-em)]OLA ratio of 1[thin space (1/6-em)]:[thin space (1/6-em)]2, rhombic dodecahedra appeared while in ratio of 1[thin space (1/6-em)]:[thin space (1/6-em)]8 truncated tetrahedra could be obtained. In other cases, by using only each type of ligand or applying ratios of 1[thin space (1/6-em)]:[thin space (1/6-em)]1 and 2[thin space (1/6-em)]:[thin space (1/6-em)]1 resulted in tetrahedra. The different particle types expose different facets, which ultimately determine the shape of the nanoparticle. It was determined that cube shaped nanoparticles were terminated by {100}, rhombic dodecahedra by {110} and tetrahedra by four out of eight possible {111} facets. The truncated tetrahedra shape is obtained by combination of {111} and {110} as the terminating facets. Properties such as surface plasmon resonance, optical emission and photocatalysis are expected to be influenced by the nature of the exposed facets.


image file: c5ra23092f-f3.tif
Fig. 3 The four crystal morphologies presented in this work (a) cubic (b) rhombic dodecahedral (c) truncated tetrahedral (d) tetrahedral. The dodecahedral, truncated tetrahedral and tetrahedral shapes were obtained using tin-ethylxanthate single precursor with different ODA[thin space (1/6-em)]:[thin space (1/6-em)]OLA ratios. Cubes were obtained using the dual precursor method and were synthesized at 150 °C.

(a) Raman spectroscopy

Raman spectroscopy was used for investigation of the new π-SnS crystal phase in comparison with the conventional phase of α-SnS. We note that Raman measurements carried out without using an ND filter always resulted in conversion to the SnS2 phase, characterized by typical high and narrow peak around 300 cm−1.22

Comparison of Raman spectra for the cube-like π-SnS nanoparticles (red curve), platelet-shaped α-SnS nanoparticles (black curve) and bulk α-SnS powder (blue curve) is presented in Fig. 4a. Examination of the spectrum of the bulk α-SnS powder reveals that it possesses characteristic peaks at 69 cm−1, 97 cm−1, 165 cm−1, 194 cm−1 and 221 cm−1. The peaks at 194 cm−1, 97 cm−1 and 221 cm−1 correspond to Ag modes. The peak at 69 cm−1 corresponds to the B1g mode and the 165 cm−1 peak to the B3g mode. The peak forms are similar to previous reports, supporting the identification of this phase as α-SnS.22–26


image file: c5ra23092f-f4.tif
Fig. 4 (a) Raman spectra of bulk α-SnS (blue curve), platelets α-SnS (black curve) and π-SnS (red curve). (b) Background subtraction and peak deconvolution of the π-SnS Raman spectrum, revealing the presence of an additional vibrational frequency which is unique to the new π-SnS phase. The red curve is the experimental data and the black curve represents the sum of the fitted curves in green.

Comparison of the spectrum of α-SnS nano-platelets with that of bulk α-SnS powder shows that most of the nano-platelet peaks are clearly shifted towards lower energy vibration frequencies, with a shift of around 3–5 cm−1 along with broadening of the peaks (see Table 2), suggesting phonon confinement effects27 as expected for dimensionally confined crystals. Another difference seen in Fig. 4a in the nano-platelet spectrum is the absence of a peak circa 70 cm−1 which is present in spectra of bulk α-SnS powder. This is presumed to be a combination of two effects. One is phonon confinement, which causes the peaks to shift toward lower wavenumbers and broaden (Table 2). The second effect is related to the filter edge effect as detailed in the Experimental section.

Table 2 Raman modes observed for the two phases of SnS nanoparticles; α-SnS (bulk), α-SnS (platelets) and π-SnS (cubes). The FWHM value is shown in parentheses
Ag modes B1g modes B3g modes
α-SnS (bulk)
194(15.39) 69(10.01) 165(35.62)
97(6.8)    
221(16.59)    
[thin space (1/6-em)]
α-SnS (platelets)
189(15.08) 160(41.89)
96(9.49)    
221(20.35)    

Ag modes B1g modes B3g modes Unassigned modes
π-SnS
192(10.4) 71(10.02) 176(35.3) 90(13.27)
224(23.5)     112(10.79)
      59(6.54)
      123(5.88)
      202(10.18)


The Raman spectrum of the cube-like π-SnS nanoparticles after background subtraction is shown in Fig. 4b. It is easy to recognize narrow peaks at 59 cm−1, 71 cm−1, 90 cm−1, 112 cm−1, 123 and a much wider peak around 190 cm−1, which appears to be composed of other peaks. Deconvolution of this wide peak shows that it is comprised from four smaller peaks at 176 cm−1, 192 cm−1, 202 cm−1 and 224 cm−1. Examination of the spectrum of α-SnS nano-platelets vs. that of π-SnS nanoparticles shows that the latter is shifted towards higher energy vibration frequencies, with a shift of between 3 cm−1 to 15 cm−1. Another apparent difference is the appearance of new peaks which are not present in the spectrum of the α-SnS nano-platelets.

Both α-SnS nanoparticles and bulk α-SnS powder show a single peak around 96 cm−1, in contrast to π-SnS which shows two distinct peaks circa 96 cm−1. Since no other phases were detected in XRD it appears that the 96 cm−1 peak has split into 90 cm−1 and 112 cm−1. This peak split is attributed to two new vibrational frequencies which is unique to the π-SnS phase. Fig. 4b shows additional three peaks present in the π-SnS spectra at 59 cm−1, 123 cm−1 and 202 cm−1. These three peaks are not observed in the spectra of α-SnS and are unique to the π-SnS.

The peak at 71 cm−1 in the π-SnS spectra is absent in the α-SnS platelets spectra but exists in the α-SnS bulk powder spectrum. The absence of the peak circa 71 cm−1 in the spectrum of α-SnS nanoparticles is probably due to peak broadening and low system sensitivity in this spectral range (as discussed above).

The Raman peaks for the π-SnS and α-SnS are summarized and compared in Table 2.

(b) Optical absorption

The band gap of a semiconductor material has a significant impact on its optical, electronic and catalytic features. In order to investigate the optical properties of π-SnS in comparison to α-SnS, UV-Vis-NIR spectroscopy was carried out. Fig. 5a shows significant absorbance from ≈1000 nm for platelet nanoparticles of α-SnS (black curve) and from ≈800 nm for the cube-like nanoparticles of π-SnS (red curve). For indirect band gap materials, the band gap is related to the absorption coefficient α according to the formula αhv0.5 = A(hvEg) where h is Planck's constant, v is the light frequency, Eg is the material band gap and A is a constant. The band gap can be evaluated from the x-intercept by plotting (αhv)0.5 vs. hv, as shown in Fig. 5b. For the α-SnS nanoparticles the plot yielded a straight line, as expected for nano-platelets belonging to the α-SnS phase with an indirect band gap around 1.07–1.20 eV.1,2,28,29 In this case, the estimated band gap is located around 1.10 eV, which is with good agreement with the data reported in the literature. Similar analysis of the π-SnS cube-like nanoparticles also yielded a straight line, indicating that the π-SnS phase possesses an indirect band gap as well. For the π-SnS nanocube phase the band gap was estimated to be around 1.53 eV, significantly higher than that of α-SnS. This difference is attributed to the difference in crystal structure of the two phases. This result is consistent with our previous report π-SnS predicting unique optical and electronic properties for the new phase.19 Fig. 5a also shows a broad peak for α-SnS platelets circa 600 nm which is not present in the π-SnS spectrum. It is unclear why an absorption shoulder is absent in the π-SnS spectrum up to this point. Further investigation and studies are required.
image file: c5ra23092f-f5.tif
Fig. 5 (a) UV-Vis-NIR spectra of the α-SnS nano-platelets (black) and for the π-SnS nano-cubes (red). (b) Tauc plots, (αhv)0.5 vs. photon energy hv. The indirect band gap energies were obtained from the x-intercepts of the fitted lines (blue curves). The band gap energies obtained were 1.10 eV for α-SnS (black curve) and 1.53 eV for π-SnS (red curve).

(c) Density functional theory calculations

The stable phase of tin sulfide in the solid state is the 8 atom orthorhombic α-SnS with the space group Pnma.1,2,30–33 We performed DFT-PBE calculations of this orthorhombic 8 atom phase for reference purposes. The calculated lattice parameters were found to be a = 4.40 Å, b = 11.51 Å, c = 4.05 Å, compared to the experimental values of JCPDS #39-0354 a = 4.3291 Å, b = 11.1923 Å, c = 3.9838 Å,3,4,6 representing deviations of up to several percent as might be expected. The electronic band structure in the relaxed position was obtained and is presented in Fig. 6. It can be seen that an indirect band-gap of ca. 1.1 eV is presented between the high symmetry points Y and G, in excellent, but probably fortuitous, agreement with experiment.
image file: c5ra23092f-f6.tif
Fig. 6 Calculated band structures of (a) orthorhombic α-SnS phase, with 8 atoms in the herzenbergite structure. (b) π-SnS phase containing 64 atoms per unit cell (c) ideal rock salt lattice with 64 atoms per unit cell.

To study the 64 atom π-SnS phase we constructed a simple cubic unit cell consisting of the 64 atoms initially located in their experimentally determined positions.19 A structural relaxation allowing the atomic positions, the volume and the lattice constants of the unit cell to vary was then performed. In this cell, convergence of the calculation was achieved with a 8 × 8 × 8 k-point mesh which resulted in a total energy of −879.896 Ry per 64 atom unit cell, a total (isotropic) stress of −0.39 kbar and a relaxed lattice parameter of 11.885 Å which is only slightly larger than the experimental value of 11.595 Å reported above. The stability of the π-SnS phase can be examined by comparing the total energy per atom pair of −27.497 Ry to −27.493 Ry in the ideal rocksalt phase and −27.498 Ry in the orthorhombic phase. We see that the total energy results predict the π-SnS phase to be more stable than the ideal rocksalt phase by approximately 2 × 10⁻³ Ry per atom which is computationally significant and at the limit of physical significance. The π-SnS phase is slightly less stable than the energetically equivalent orthorhombic phase, in agreement with experiment. These results indicate why the rocksalt phase is not observed experimentally.

To examine the origin of the stability of the π-SnS phase relative to the ideal rocksalt structure we examined the band structure of both systems in a unit cell containing 64 atoms, i.e. with a similar size of the Brillouin zone. The results are shown in Fig. 6.

It is immediately seen that the band structure in the π-SnS phase is distorted relative to the highly symmetric structure in the ideal rocksalt phase, as can be seen, e.g., at the L point. More significantly the energy gap between the valence and conduction band is found to increase from ca. 0.17 eV in the ideal structure to approximately 1.27 eV in the π-SnS phase. We note that DFT-PBE is well-known to underestimate band gaps, see, e.g., ref. 34. Due to the large size of the unit cell, and the consequently small size of the Brillouin zone, it was impossible to determine from our calculations whether the band gap is indirect. The effective masses for the conduction and valence bands were calculated from our band structure results and were found to be 0.76 and 1.22 m0, respectively. These are significantly larger than the values obtained by us for the orthorhombic structure of 0.15 and 0.31 m0 respectively, which are in good agreement with previous GW calculations of ref. 35, possibly indicating less charge mobility in the new cubic structure.

Finally, to further validate our results, we consider the closely related system PbS which exhibits a stable bulk phase in the rocksalt structure. We examined the possible stability of a π-phase in this material by constructing a unit cell with the relative positions of the atoms identical to those observed in the π-SnS phase. We allowed the system to relax structurally and found that it was unstable and reduced very closely (to within less than 1%) to the ideal rocksalt structure. The energy difference between the rocksalt-like PbS structure obtained from relaxation of the π-phase of PbS and the ideal rocksalt phase was found to be negligible (less than 10–5 Ry per PbS atom pair). This indicates that the π-phase of PbS is mechanically unstable and demonstrates that the relative stability obtained in our calculations for the π-SnS phase relative to the ideal rocksalt structure is unique to SnS and not predicted for related compounds, in agreement with experimental observations.

Conclusions

We report for the first time on the synthesis for obtaining pure nanocrystalline samples of the newly discovered π-SnS phase. This allowed for characterization of the properties of π-SnS using XRD, Raman and optical absorption spectroscopies in comparison to the conventional α-SnS phase. Shape control was achieved by controlling synthesis conditions, resulting in well-defined nanocrystal morphologies of nano-cubes (the common shape), and less common shapes such as rhombic dodecahedra. XRD provided authentication of the model proposed in preceding work19 and allowed for refined determination of the π-SnS lattice parameter a = 11.595 Å. The proposed model also matched to SnS thin films obtained using chemical bath deposition ​ by other researchers. Raman spectroscopy of π-SnS nanoparticles showed a large shift towards higher energies, and showed indications for peak splitting. Optical absorption curves indicated an indirect band gap of 1.53 eV, in good agreement with DFT calculations indicating a band gap greater than that of α-SnS. Furthermore, DFT total energy calculations show that π-SnS phase is energetically similar to α-SnS, and significantly more stable than the hypothetical ideal rocksalt structure of SnS.

Acknowledgements

We thank Dr Dimitry Mogilyanski for expert assistance with XRD. This work was supported by the Israel Science Foundation under Grant #340/2010.

References

  1. K. Ramasamy, V. L. Kuznetsov, K. Gopal, M. A. Malik, J. Raftery, P. P. Edwards and P. O'Brien, Chem. Mater., 2013, 25, 266–276 CrossRef CAS .
  2. M. Parenteau and C. Carlone, Phys. Rev. B: Condens. Matter Mater. Phys., 1990, 41, 5227–5234 CrossRef .
  3. D. D. Vaughn 2nd, O. D. Hentz, S. Chen, D. Wang and R. E. Schaak, Chem. Commun., 2012, 48, 5608–5610 RSC .
  4. Z. Deng, D. Cao, J. He, S. Lin, S. M. Lindsay and Y. Liu, ACS Nano, 2012, 6, 6197–6207 CrossRef CAS PubMed .
  5. W. Cai, J. Hu, Y. S. Zhao, H. L. Yang, J. Wang and W. D. Xiang, Adv. Powder Technol., 2012, 23, 850–854 CrossRef .
  6. Y. Zhang, J. Lu, S. Shen, H. Xu and Q. Wang, Chem. Commun., 2011, 47, 5226–5228 RSC .
  7. G. H. Yue, Y. D. Lin, X. Wen, L. S. Wang, Y. Z. Chen and D. L. Peng, Appl. Phys. A, 2011, 106, 87–91 CrossRef .
  8. Q. F. Han, M. J. Wang, J. W. Zhu, X. D. Wu, L. D. Lu and X. Wang, J. Alloys Compd., 2011, 509, 2180–2185 CrossRef CAS .
  9. J. R. Brownson, C. c. Georges, G. Larramona and C. Levy-Clement, ECS Trans., 2007, 6, 587–597 CAS .
  10. E. C. Greyson, J. E. Barton and T. W. Odom, Small, 2006, 2, 368–371 CrossRef CAS PubMed .
  11. Z. Deng, D. Han and Y. Liu, Nanoscale, 2011, 3, 4346–4351 RSC .
  12. S. G. Hickey, C. Waurisch, B. Rellinghaus and A. Eychmuller, J. Am. Chem. Soc., 2008, 130, 14978–14980 CrossRef CAS PubMed .
  13. A. J. Biacchi, D. D. Vaughn 2nd and R. E. Schaak, J. Am. Chem. Soc., 2013, 135, 11634–11644 CrossRef CAS PubMed .
  14. B. K. Patra, S. Sarkar, A. K. Guria and N. Pradhan, J. Phys. Chem. Lett., 2013, 4, 3929–3934 CrossRef CAS .
  15. B. K. Patra, A. K. Guria, A. Dutta, A. Shit and N. Pradhan, Chem. Mater., 2014, 26, 7194–7200 CrossRef CAS .
  16. I. Y. Ahmet, M. S. Hill, A. L. Johnson and L. M. Peter, Chem. Mater., 2015, 27, 7680–7688 CrossRef .
  17. A. R. Garcia-Angelmo, R. Romano-Trujillo, J. Campos-Álvarez, O. Gomez-Daza, M. T. S. Nair and P. K. Nair, Phys. Status Solidi A, 2015, 212, 2332–2340 CrossRef CAS .
  18. P. K. Nair, A. R. Garcia-Angelmo and M. T. S. Nair, Phys. Status Solidi A, 2015 DOI:10.1002/pssa.201532426 .
  19. A. Rabkin, S. Samuha, R. E. Abutbul, V. Ezersky, L. Meshi and Y. Golan, Nano Lett., 2015, 15, 2174–2179 CrossRef CAS PubMed .
  20. W. Kraus and G. Nolze, J. Appl. Crystallogr., 1996, 29, 301–303 CrossRef CAS .
  21. J. P. Perdew, K. Burke and M. Ernzerhof, Phys. Rev. Lett., 1996, 77, 3865–3868 CrossRef CAS PubMed .
  22. J. Chao, Z. Xie, X. Duan, Y. Dong, Z. Wang, J. Xu, B. Liang, B. Shan, J. Ye, D. Chen and G. Shen, CrystEngComm, 2012, 14, 3163 RSC .
  23. P. M. Nikolic, L. Miljkovic, P. Mihajlovic and B. Lavrencic, J. Phys. C: Solid State Phys., 1977, 10, L289 CrossRef CAS .
  24. S. Sohila, M. Rajalakshmi, C. Ghosh, A. K. Arora and C. Muthamizhchelvan, J. Alloys Compd., 2011, 509, 5843–5847 CrossRef CAS .
  25. T. Raadik, M. Grossberg, J. Raudoja, R. Traksmaa and J. Krustok, J. Phys. Chem. Solids, 2013, 74, 1683–1685 CrossRef CAS .
  26. P. Sinsermsuksakul, J. Heo, W. Noh, A. S. Hock and R. G. Gordon, Adv. Energy Mater., 2011, 1, 1116–1125 CrossRef CAS .
  27. S. Osswald, V. N. Mochalin, M. Havel, G. Yushin and Y. Gogotsi, Phys. Rev. B: Condens. Matter Mater. Phys., 2009, 80, 075419 CrossRef .
  28. X.-L. Gou, J. Chen and P.-W. Shen, Mater. Chem. Phys., 2005, 93, 557–566 CrossRef CAS .
  29. J. Vidal, S. Lany, M. d'Avezac, A. Zunger, A. Zakutayev, J. Francis and J. Tate, Appl. Phys. Lett., 2012, 100, 032104 CrossRef .
  30. G. A. Tritsaris, B. D. Malone and E. Kaxiras, J. Appl. Phys., 2013, 113, 233507 CrossRef .
  31. G. A. Tritsaris, B. D. Malone and E. Kaxiras, J. Appl. Phys., 2014, 115, 173702 CrossRef .
  32. L. A. Burton and A. Walsh, J. Phys. Chem. C, 2012, 116, 24262–24267 CAS .
  33. R. C. Sharma and Y. A. Chang, Bull. Alloy Phase Diagrams, 1986, 7, 269–273 CrossRef CAS .
  34. Y. Zhao and D. G. Truhlar, J. Chem. Phys., 2009, 130, 074103 CrossRef PubMed .
  35. J. Vidal, S. Lany, M. d'Avezac, A. Zunger, A. Zakutayev, J. Francis and J. Tate, Appl. Phys. Lett., 2012, 100, 032104 CrossRef .

Footnote

Electronic supplementary information (ESI) available: Rietveld refinement details, supporting TEM micrographs, rhombic dodecahedron shape determination and crystallographic information file (CIF). See DOI: 10.1039/c5ra23092f

This journal is © The Royal Society of Chemistry 2016