DOI:
10.1039/C5RA22929D
(Paper)
RSC Adv., 2016,
6, 13710-13722
High removal performance of dissolved oil from aqueous solution by sorption using fatty acid esterified pineapple leaves as novel sorbents
Received
1st November 2015
, Accepted 16th January 2016
First published on 20th January 2016
Abstract
This paper demonstrates the potential use of the lignocellulosic biomass of pineapple leaves (PALs) as an oil sorbent by mercerization and esterification with long chain fatty acids in order to enhance the surface hydrophobicity and thus the oil sorption capacity for the treatment of dissolved oil contaminated wastewater. The mercerized pineapple leaves (M-PALs) were esterified with lauric acid (LA) and stearic acid (SA) in pyridine–p-toluenesulfonyl chloride (Py–TsCl) solution to yield M-LA-PAL and M-SA-PAL sorbents, respectively, which were then characterized alongside the raw PAL (R-PAL) sorbent using scanning electron microscopy (SEM), Fourier transform infrared (FTIR) spectroscopy, X-ray photoelectron spectroscopy (XPS), CHNS/O analysis and Brunauer–Emmett–Teller (BET) surface area analysis to study the changes of the surface morphology, functional groups, elemental composition and specific surface area of the sorbents. It was found that M-SA-PAL gave the highest sorption capacity (138.89 mg g−1) followed by M-LA-PAL (107.67 mg g−1) and R-PAL (35.59 mg g−1), which are generally lower than dispersed oil sorption capacities. The oil sorption process was found to be exothermic in nature. The data analysis indicated that the sorption process obeyed the Langmuir isotherm and pseudo-second order kinetic models with film diffusion as the rate limiting step, which is similar to some of the reported dispersed oil sorption results. The sorbent regeneration was repeated four times using isopropanol–water (1![[thin space (1/6-em)]](https://www.rsc.org/images/entities/char_2009.gif) :1, v/v) solution as a desorbing agent and the sorption results were found to be comparable with the freshly prepared sorbent. Finally, the present findings indicate that a lignocellulosic biomass such as PAL could be a potential alternative sorbent precursor for oil removal from oil contaminated wastewaters.
:1, v/v) solution as a desorbing agent and the sorption results were found to be comparable with the freshly prepared sorbent. Finally, the present findings indicate that a lignocellulosic biomass such as PAL could be a potential alternative sorbent precursor for oil removal from oil contaminated wastewaters.
1. Introduction
The occurrence of oil, whether in effluent or other water sources, is a worldwide concern and could have a severe impact on humans and the environment. Oil in contaminated aqueous solution mostly appears as small dispersed droplets and some is even dissolved in water, making it hard to remove and thus degrading the performance of the treatment plant.1,2 In most circumstances the oily water is just discharged to the environment, affecting the survival of aquatic life and economic activity.3 Thus, the removal of oil and hydrocarbon contaminants from water is essential to preserve water for irrigation, livestock or wildlife watering holes and habitats as well as other industrial uses.2
The removal of dispersed oil has gained considerable attention and, in fact, several separation techniques are already available such as gravity separation, chemical treatment methods, flotation systems, coagulation, filtration, hydrocyclones, and electrical processes.2 In contrast, less attention has been given to dissolved oil separation from water sources. Generally, the removal of dissolved oil can be more difficult than dispersed oil due to its solubility and low concentration. A combination of different techniques may be required to efficiently remove both forms of oil contaminants. Water produced from oil and gas exploration activities, for instance, contains both oil contaminants, while groundwater contaminated by BTEX may contain only dissolved oil or hydrocarbons.4,5
Among the main existing oil removal techniques, the sorption process has gained high popularity as it is one of the easiest and most cost effective physiochemical methods for removing contaminants from aqueous solution. Synthetic organic polymers such as polypropylene, polyurethane and polyethylene have been widely used to remove oil. Synthetic polymers have a high sorption capacity but their major drawbacks are non-biodegradability and high cost.6 As a result, new research efforts are being focused on developing low-cost sorbents derived from renewable and biodegradable materials such as lignocellulosic materials. However, appropriate modifications are required in order to achieve acceptable sorbent technical specifications.7
Pristine lignocellulosic materials mostly exhibit a lower oil sorption capacity than chemically modified ones due to the presence of hydroxyl (OH) groups on their surfaces that tend to adsorb water more than oil. There are several modification methods that have been introduced for promoting interfacial adhesion in systems where lignocellulosic materials are used as fillers, including acid treatment, alkaline treatment, etherification, esterification, polymer grafting and carbonization.8–15 As a result, low-cost sorbents from different types of lignocellulosic materials, such as kapok, sugarcane bagasse, rice husk, barley straw, oil palm fibers, and banana trunk fibers, are also being widely studied for removing oil from water.1,14,16–20 These studies are mainly focused on modifications of lignocellulosic materials for the removal of dispersed oil, while the removal of dissolved oil by the sorption process has hardly been reported, even though both forms of oil contaminants may co-exist in produced water and can be removed simultaneously during the sorption process. However, their sorption performance and mechanism can differ significantly from one another and studies towards a fundamental understanding of these factors are thus crucial, especially for the removal of dissolved oil since it is less researched than the dispersed oil contaminant.
In this study, the lignocellulosic biomass of pineapple leaves (PALs) was used as a sorbent for the removal of oil compounds from dissolved oil-in-water (o/w) solutions. PALs have a high cellulose content (70–80%) which could ease the modification processes due to the presence of a large amount of hydroxyl functional groups on its surface.11 It was reported that pineapple residue was used as a sorbent to remove cationic dyes (methylene blue and crystal violet).21–24 The PAL sorbents were prepared by mercerization and esterification of PALs under selected experimental conditions. The synthesized PAL sorbents were then characterized using scanning electron microscopy (SEM), Fourier transform infrared (FTIR) spectroscopy, X-ray photoelectron spectroscopy (XPS), and elemental analysis (EA) to study their morphological properties, surface functional groups and elemental compositions. The oil sorption performance of R-PAL, M-PAL, M-LA-PAL and M-SA-PAL sorbents was investigated under different experimental conditions and the experimental sorption data were then analyzed using existing equilibrium and kinetic models to understand the mechanism of the dissolved oil sorption process. The results of this study will be useful for the utilization of lignocellulosic biomass as low-cost sorbents in the removal of oil, especially dissolved oil, from wastewater.
2. Materials and experimental procedures
2.1. Materials
Pineapple leaves (PALs) were collected from Pekan Nenas (Johor, Malaysia). Chemicals such as fatty acids (lauric and stearic acid), pyridine, p-toluenesulfonyl chloride (TsCl), ethanol, methanol, isopropanol and acetic acid were purchased from Sigma-Aldrich (USA) and Merck (Germany). The crude oil used for the experiments was obtained from a local petroleum company. Double-distilled water was used for solution preparation throughout the experiments.
2.2. Sorbent preparation
The PALs were cut into small pieces and dried under sunlight for several days. The dried PALs were then ground into small sizes and sieved to obtain the target sample size of 75–150 μm. The sieved PAL sample was soaked in an ethanol and water mixture, followed by agitation and centrifugation to remove dirt and impurities. Then, the washed PAL sample was oven-dried for 24 hours at 333 K and stored in a desiccator for further characterization and modifications. This PAL sample was referred to as raw PAL (R-PAL).
The R-PAL was then treated with 5% (w/v) aqueous NaOH solution under constant stirring at room temperature (303 K) for 18 hours. The fibers were then washed with distilled water several times to remove any traces of NaOH sticking to the fiber surface, neutralized with acetic acid and washed repeatedly with double-distilled water until pH 7 was reached. The product of the mercerization process was denoted as M-PAL.
The long chain fatty acid (lauric and stearic acid) modified M-PAL was synthesized in a Py–TsCl system according to the procedure reported by Jandura et al.25 An accurate weight of 5 g M-PAL was added to a 2-necked flask containing 150 mL of pyridine and 35 g of TsCl with continuous stirring and nitrogen purging for 20–30 minutes. The fatty acid was then added slowly into the mixture to give a 1:1 molar ratio. The mixture was maintained at a temperature of 60–70 °C and 80–90 °C for lauric and stearic acid, respectively, in an oil bath for 4 hours. The mixture was filtered and the solid product was washed with methanol followed by Soxhlet extraction using methanol for 18 hours to remove excess fatty acids. The mixture was then filtered, washed with double-distilled water followed by acetone, and finally dried in an oven for 24 hours. M-PAL modified with lauric and stearic acids was denoted as M-LA-PAL and M-SA-PAL, respectively.
2.3. Sorbent characterization
The total content of carbon, hydrogen, oxygen and nitrogen was analyzed using a CHNS/O analyzer (CHNS/O Analyzer 2400, PerkinElmer, USA). The surface morphology was determined using a scanning electron microscope, model JEOL JSM-7500F (Japan). The FTIR spectra were obtained using a FTIR spectrometer (Thermo Scientific, Nicolet iS5) via the ATR sampling technique and scanned over the range of 4000 to 400 cm−1 at a resolution of 4 cm−1 to study the surface functional groups responsible for the oil sorption. The X-ray photoelectron spectroscopy measurement was carried out using a Shimadzu KRATOS AMICUS X-ray photoelectron spectrometer (XPS), equipped with an unmonochromated aluminium Al Kα source (1486.8 eV) with an operating pressure of 10−9 mbar and 10 mA of current. The XPS spectra were taken in 150 eV constant analyzer energy (CAE) mode with a 1 eV energy step size, while high-resolution XPS spectra of O1s, N1s and C1s were taken at 25 eV CAE and 0.05 eV energy step size. The specific surface area was measured using a Brunauer–Emmett–Teller (BET) surface area analyzer (Micromeritics ASAP 2000, USA) using a nitrogen adsorption–desorption method at −195.9 °C (77.3 K).
2.4. Crude oil sorption experiment
A dissolved oil-in-water (o/w) solution was prepared by first dissolving a specific amount of crude oil in isopropanol, followed by dilution with double-distilled water to obtain the required oil concentration. In a typical sorption experiment, an accurate weight of PAL sorbent (i.e. 0.025 g) was added into a 50 mL conical flask containing 50 mL of a 100 ppm o/w solution. The flask was tightly fastened and placed in a temperature-controlled shaker at a speed of 200 rpm at a selected temperature to reach equilibrium. The sample was then withdrawn and filtered using a 0.8 μm syringe filter, and the filtrate (supernatant) was collected. The residual oil concentration in the supernatant was extracted using isooctane and analyzed using a UV-VIS spectrophotometer (PerkinElmer model Lambda 35), measuring at 257 nm. All experiments were carried out in triplicate and an average value was reported. The sorption capacity of the sorbent at time t, qt (mg g−1) was calculated using the mass balance equation as in eqn (1).| |
 | (1) |
where C0 and Ct are, respectively, the initial (t = 0) and time t oil concentrations (mg L−1), M is the sorbent mass (g), and V is the volume of the oil solution (L). The sorption capacity at equilibrium is denoted as qe.
2.5. Crude oil composition determination
The content of crude oil-in-water was analyzed using a gas chromatography mass spectrometer (GC-MS) with a HP-5ms column (30 m × 0.25 mm × 0.25 μm). Helium was used as the carrier gas and the split injection mode was used. The injector and MSD transfer line heater temperature was set at 250 °C and 290 °C, respectively. The oven was programmed for an initial temperature of 40 °C for 2 minutes, followed by an increase of 5 °C min−1 up to 290 °C, then held for 10 minutes.
2.6. Sorbent regeneration studies
The regeneration experiments were conducted using oil-loaded sorbents (0.05 g L−1) prepared using a 100 ppm crude oil-in-water (o/w) solution. The regeneration experiments were carried out by mixing the oil-loaded sorbent with isopropanol–water (1:1, v/v) solution with a dosage of 0.05 g L−1 and shaking at 200 rpm for 24 hours to ensure sufficient desorption time. The sorbent was then separated for the next cycle of sorption while the filtrate was extracted using isooctane and analyzed using a UV-VIS spectrophotometer measured at 257 nm to determine the desorbed oil concentration. The same procedures were repeated for the subsequent sorption and desorption cycles.
3. Results and discussion
3.1. Morphology and textural properties analysis
The most common and simple device to study the surface morphology of the solid samples is a scanning electron microscope. The surface morphologies of R-PAL, M-LA-PAL and M-SA-PAL sorbents at 10000× magnifications are shown in Fig. 1(a)–(d), respectively. A regular and smooth surface can be observed for untreated PALs.26 The mercerization treatment reduced the fiber diameter and increased the number of active sites available for further modification.11 The mercerization and esterification process partially dissolved the soluble components (e.g. hemicellulose, lignin, and wax), and made the fiber surface rougher and irregular.11,12 The removal of a waxy cuticle layer of the PALs also increased the contact surface area for oil sorption.
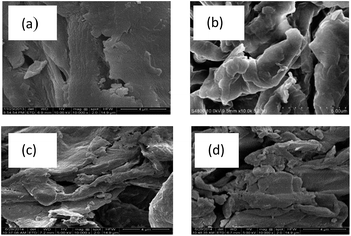 |
| | Fig. 1 SEM images of (a) R-PAL, (b) M-PAL, (c) M-LA-PAL, and (d) M-SA-PAL sorbents (magnification: 10000×). | |
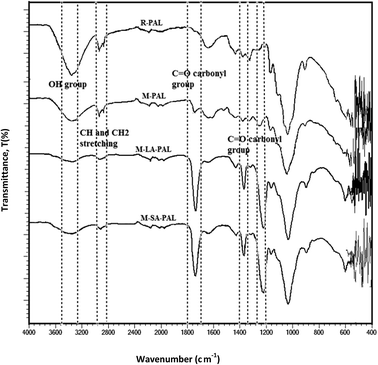
3.2. Functional group identification
The surface functional groups of PAL sorbents before and after chemical modification were determined by examining the FTIR spectra as shown in Fig. 2. The band observed at ∼3340 cm−1 corresponded to intermolecular and intramolecular hydrogen bonding in cellulose.8 Two peaks observed at 2850–3000 cm−1 were identified as asymmetric CH and CH2 group stretching.27 Peaks at ∼1730 and ∼1245 cm−1 corresponded to the presence of pectin.28 A lignin peak was found at ∼1631 cm−1 due to C![[double bond, length as m-dash]](https://www.rsc.org/images/entities/char_e001.gif) C in-plane aromatic vibrations.28 Cellulose was characterized by the peak at 1036 cm−1.26
C in-plane aromatic vibrations.28 Cellulose was characterized by the peak at 1036 cm−1.26
 |
| | Fig. 2 FTIR spectra for R-PAL, M-PAL, M-LA-PAL, and M-SA-PAL sorbents. | |
The effect of mercerization and esterification was observed as the vibration peak intensity at ∼1631 cm−1 decreased due to the decrease in the stretching vibration of lignin. This indicated that mercerization and esterification led to the partial removal of lignin.29 Besides this, the sharp peak at ∼3340 cm−1 was broadened and less defined indicating that the fibers have reduced hydrogen bonding with the change in the structure after the chemical modifications. The decrease in intermolecular hydrogen bonding indicated that the hydroxyl groups have been esterified by fatty acids. This was supported by the increment of the peak intensity of CH2 and CH3 groups and the CO stretching of the carbonyl group (∼1750 cm−1) which also indicated the successful grafting of lauric and stearic acids onto the PAL surfaces after the treatment of PALs with fatty acids.8
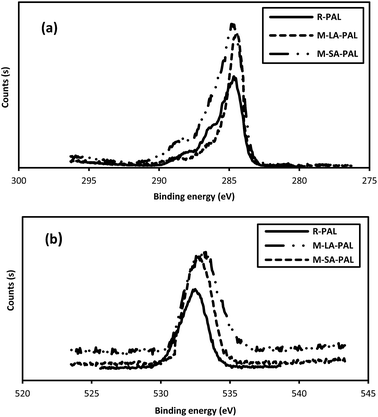
The XPS spectra of R-PAL, M-LA-PAL and M-SA-PAL are shown in Fig. 3(a)–(c), respectively. The PAL sorbents mainly comprise carbon and oxygen as the main elements observed at 285 and 533 eV as they are from lignocellulosic material.30 Fig. 4(a) shows the analysis of the total C1s high-resolution spectra of the raw and fatty acid modified PALs sorbents confirming that the four component peaks found at 285.0 eV, 286.9 eV, 288.7 eV and 289.6 eV represent C1(C–C/C–H), C2 (C–OH), C3(O–C–O, CO), and C4 (O–CO), respectively.13,31 Meanwhile, Fig. 4(b) shows the O1s high resolution spectra of the unmodified and fatty acid grafted PALs at 532.2 eV. R-PAL was found to have abundant C1 and C2 signals in the C1s spectra, indicating that R-PAL mainly consists of lignin (plant wax in lignocellulose mainly contributes to C1), hemicellulose and cellulose.13 After the esterification process, C4 groups (carbon atoms bonded to a carbonylic and a non-carbonylic oxygen (OC–O)) were found in the M-LA-PAL and M-SA-PAL sorbents. It was observed that the peak intensity of the O1s spectra increased after the surface modification, proving that ester groups had been added to the PAL surfaces.
 |
| | Fig. 3 XPS wide scans of (a) R-PAL, (b) M-LA-PAL, and (c) M-SA-PAL sorbents. | |
 |
| | Fig. 4 (a) Total C1s and (b) total O1s high resolution XPS spectra of the R-PAL, M-LA-PAL and M-SA-PAL sorbents. | |
3.3. Elemental analysis
The elemental compositions of the PALs before and after fatty acid grafting are given in Table 1. The carbon and oxygen content decrease after mercerization might be due to the removal of hemicellulose and lignin during the mercerization. Hemicellulose is water soluble as it is composed of a mixture of different sugars while lignin has components which are soluble in NaOH solution.29 After the esterification, the composition of carbon in M-LA-PAL and M-SA-PAL was increased to 57.95% and 63.08%, respectively. There was also a drastic decrease in the O/C atomic ratio from 1.1290 (M-PAL) to 0.5186 (M-LA-PAL) and 0.3862 (M-SA-PAL) after the esterification. This was due to the introduction of the long chain alkyl groups of lauric acid (12 carbons) and stearic acid (18 carbons) onto the M-PAL surfaces.
Table 1 Elemental compositions (wt%) of R-PAL, M-PAL, M-LA-PAL, and M-SA-PAL sorbents
| Sorbents |
Composition (wt%) |
Atomic ratio |
| C |
H |
O |
N |
O/C |
H/C |
| R-PAL |
43.06 |
6.184 |
48.976 |
0.98 |
1.1374 |
0.1436 |
| M-PAL |
41.71 |
6.50 |
47.09 |
0.15 |
1.1290 |
0.1558 |
| M-LA-PAL |
57.95 |
8.08 |
30.05 |
0.12 |
0.5186 |
0.1394 |
| M-SA-PAL |
63.08 |
9.15 |
24.36 |
0.11 |
0.3862 |
0.1451 |
3.4. Effect of pH
The solution pH is a crucial parameter to study in the sorption process as it affects the solute chemistry and surface binding sites of the sorbents.8,32 The sorption of oil on PAL sorbents as a function of the solution pH was studied as shown in Fig. 5. It was observed that the oil sorption capacity was highest at the equilibrium pH of 7.07 observed for R-PAL (20.58 mg g−1), 5.07 for M-LA-PAL (106.62 mg g−1) and 5.30 for M-SA-PAL (148.85 mg g−1). The oil sorption capacity of M-LA-PAL was found to decrease slightly with the increase of the solution pH after the equilibrium pH of 5.07. The M-SA-PAL oil sorption capacity decreased rapidly to 116.55 mg g−1 at an equilibrium pH of 6.81 and then decreased slightly with the increase of solution pH. This indicated that the oil sorption process is more favorable in slightly acidic to neutral conditions. The increase of acidity or alkalinity of the oil solution may cause the oil solubility to increase, indicating a decrease of the hydrophobicity of the oil molecules. This leads to a decrease in the oil sorption on the hydrophobic M-LA-PAL and M-SA-PAL surface in highly acidic or alkaline solution. Besides this, there is also a possibility of reducing the sorbent’s hydrophobicity due to the existence of a huge amount of protons that are localized on the sorbent’s surface at a lower pH.33 In alkaline conditions, the oil sorption capacity at high pH values does not in fact correspond to the oil removal efficiency. The addition of NaOH to the oil solution caused the saponification process to occur, where the oil underwent hydrolysis with NaOH to produce glycerol and fatty acid salts that are more soluble in water than the isooctane solvent.8 Thus, the final oil concentration determined was lower than it should be as the oil was being hydrolyzed in the solution and not extracted by the isooctane.
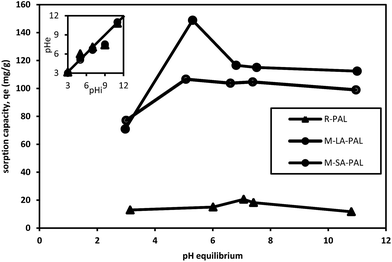 |
| | Fig. 5 Effect of pH on oil sorption onto PAL sorbents and the initial and equilibrium solution pH changes. Experimental conditions: pH 3–11; oil concentration 100 ppm; sorbent dosage 0.5 mg mL−1; t 24 hours; and T 303 K. | |
3.5. Effect of initial oil concentration
The study of initial oil concentration is important as it strongly affects the thermodynamics and kinetics of the adsorption process.34 The effect of initial oil concentration on the oil sorption capacity was studied by varying the oil concentration from 10 to 300 ppm, while other parameters such as the sorbent dosage (0.5 mg mL−1), contact time (24 hours) and temperature (303 ± 0.5 K) were kept constant. Fig. 6(a) shows the relationship between the initial oil concentration and the oil sorption capacity for R-PAL, M-LA-PAL, and M-SA-PAL. The experimental data show that the oil sorption capacity increases with the oil concentration up to a certain level and attains equilibrium. This result may be due to saturation of the active sites of the PAL sorbents with oil which hinders further oil adsorption onto the active sites. The low oil sorption capacity at the initial stage is due to the limited oil molecules that are available for attachment on the sorbent surfaces. The maximum oil sorption capacity for R-PAL, M-LA-PAL and M-SA-PAL sorbents was 37.45, 182.47 and 198.93 mg g−1, respectively, obtained at an equilibrium concentration (Ce) of 63.97, 131.47 and 123.24 ppm, respectively, following the order of M-SA-PAL > M-LA-PAL > R-PAL. The modified PAL sorbents exhibited a higher sorption capacity than R-PAL due to the presence of hydrophobic groups on the long chain fatty acids, thus enhancing the hydrophobic character of the sorbent surfaces. M-SA-PAL shows the highest sorption capacity as stearic acid has a longer carbon chain (18 carbons) as compared to lauric acid (12 carbons) for M-LA-PAL.
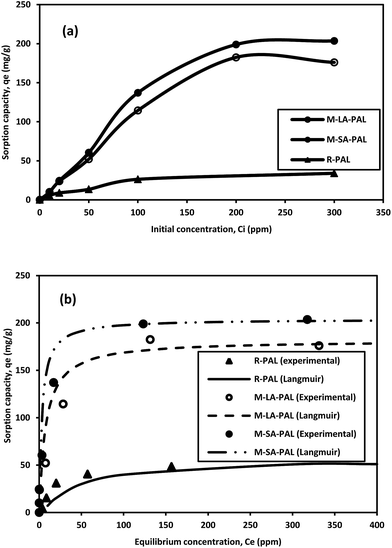 |
| | Fig. 6 Oil sorption on PAL sorbents: (a) effect of initial concentration and (b) sorption isotherm. Experimental conditions: pH 7; oil concentration 10–300 ppm; sorbent dosage 0.5 mg mL−1; t 24 hours; and T 303 K. | |
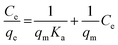
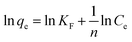
The sorption data were further analyzed using the existing isotherm models in order to study the distribution of the adsorbed molecules between the liquid and solid phases in the equilibrium state.35 This is crucial for a better understanding of the fundamental aspects of the sorption process and optimizing the use of sorbents in the oil removal process.34 The experimental data were thus fitted into the three most commonly used sorption isotherm models, namely Langmuir, Freundlich and Temkin. The Langmuir isotherm was initially developed to describe the sorption of gases on solid surfacees. It assumes a monolayer sorption onto a homogeneous surface which contains a finite number of adsorption sites. The Freundlich isotherm is an empirical equation which represents multilayer adsorption on heterogeneous surfaces that have non-uniform available sites with different energies of adsorption. The Temkin model considers the effect of indirect sorbate–adsorbate interactions on the sorption isotherm; due to the interactions, the heat of sorption of all the molecules in the layer would decrease linearly with coverage.35
The linear forms of the Langmuir, Freundlich and Temkin isotherm models are given in eqn (2)–(4), respectively.
| |
 | (2) |
| |
 | (3) |
where
qe is the oil sorption capacity at equilibrium (mg g
−1),
Ce is the oil concentration at equilibrium (mg L
−1),
qm is the theoretical maximum sorption capacity (mg g
−1),
Ka is the Langmuir sorption constant,
KF and
n are Freundlich constants, respectively, indicating the extent of the adsorption and the favorability of the sorption process, 1/
n is the slope of the plot ranging from 0 to 1 and is the measure of the surface heterogeneity – the closer the value to zero, the more heterogeneous the sorbent surface.
14 In
eqn (5),
A is the Temkin isotherm equilibrium binding constant (L g
−1) and
B =
RT/
bT in which
bT is the Temkin constant related to the heat of sorption (J mol
−1),
R is the gas constant (8.314 J mol
−1 K
−1) and
T is the absolute temperature (K).
The best-fitted isotherm model for R-PAL, M-LA-PAL and M-SA-PAL is shown in Fig. 6(b), while the model constant parameters, coefficient of determination (R2) and Pearson's chi-squared test (χ2) analyses are tabulated in Table 2. χ2 was determined according to eqn (5).
| | |
χ2 = (qexp − qcal)2/qcal
| (5) |
where
qexp and
qcal refer to the experimental and calculated
q, respectively. The best fitting model should have an
R2 value of equal or near to 1, a smaller value of
χ2, a closer
qe,calc value to that of the
qe,exp, and a good non-linear fitting, according to which the Langmuir isotherm model meets the most criteria. This indicates that the oil sorption onto the PAL sorbents occurs as monolayer sorption. Similar results were reported for the sorption of dispersed/emulsified oil onto oil palm fiber, rice husk and barley straw surfaces, indicating monolayer sorption.
1,20,27
Table 2 Isotherm model analysis of PAL sorbents
| Isotherm |
Parameters |
Values |
| R-PAL |
M-LA-PAL |
M-SA-PAL |
| No data for bT as an oil used in the study has unknown molecular weight. |
| Langmuir |
qm (mg g−1) |
62.50 |
181.82 |
204.08 |
| Ka (L mg−1) |
0.0256 |
0.1285 |
0.3043 |
| R2 |
0.9417 |
0.9958 |
0.999 |
| χ2 |
6.987 |
21.588 |
24.24 |
| Freundlich |
KF (mg g−1) (L mg−1)1/n |
2.5060 |
36.162 |
21.815 |
| n |
1.5342 |
3.3967 |
2.1988 |
| R2 |
0.8674 |
0.9796 |
0.8302 |
| χ2 |
20.087 |
14.775 |
86.79 |
| Temkin |
A (L g−1) |
0.345 |
35.703 |
1.5541 |
| bT (J mol−1) |
N/Aa |
N/Aa |
N/Aa |
| R2 |
0.9311 |
0.84 |
0.9741 |
| χ2 |
5.100 |
32.567 |
5.4786 |
3.6. Effect of temperature
Temperature has a direct influence on the sorption capacity of a sorbate onto any sorbent. It needs to be studied as it is a primary thermodynamic property that determines other properties such as ΔH, ΔS and ΔG. These thermodynamic properties are important to evaluate in order to understand the nature of the sorption process. In the present study, sorption experiments were conducted in the temperature range of 303–343 K, while other parameters were kept constant. As shown in Table 3, the sorption capacity of the PAL sorbent decreases with the increase of temperature, indicating that the process is exothermic.8
Table 3 Temperature dependent thermodynamic parameters analysis
| Temperature (K) |
qe (mg g−1) |
ΔG (kJ mol−1) |
ΔH (kJ mol−1) |
ΔS (kJ mol−1 K) |
Ea (kJ mol−1) |
| R-PAL |
| 303 |
35.59 |
2.908 |
−2.0043 |
−0.0756 |
10.74 |
| 323 |
26.92 |
4.422 |
|
|
|
| 343 |
17.74 |
5.974 |
|
|
|
|
| M-LA-PAL |
| 303 |
107.67 |
−3.180 |
−11.021 |
−0.0259 |
18.34 |
| 323 |
103.32 |
−3.164 |
|
|
|
| 343 |
95.48 |
−2.974 |
|
|
|
|
| M-SA-PAL |
| 303 |
138.89 |
−5.304 |
−14.981 |
−0.0319 |
23.67 |
| 323 |
120.69 |
−4.666 |
|
|
|
| 343 |
111.85 |
−4.030 |
|
|
|
The performance of oil sorption as a function of temperature could be further evaluated by analyzing the thermodynamic parameters, namely the Gibbs free energy (ΔG), enthalpy (ΔH) and entropy (ΔS). The change in Gibbs free energy (ΔG) of the sorption is calculated according to eqn (6).
| | |
ΔG = −RTlnKc
| (6) |
where
Kc is the sorption equilibrium constant, obtained by
Kc =
qe (sorbent)/
Ce (solution) at the process temperatures of 303 K, 323 K and 343 K after 24 hours. The value of the enthalpy change (Δ
H) and entropy change (Δ
S) related to the Gibbs free energy change at a constant temperature is given in
eqn (7). The combination of
eqn (6) and
(7) gives the van't Hoff equation (
eqn (8)).
| |
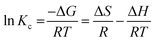 | (8) |
where
T is the absolute temperature (K) and
R is the universal gas constant (8.314 J mol
−1 K
−1). The values of the thermodynamic parameters determined at different temperatures are tabulated in
Table 3. The sorption performance of PAL sorbents was found to decrease with increasing temperature. The Δ
G values of M-LA-PAL and M-SA-PAL sorbents were negative and increased with temperature indicating a decrease in the spontaneity and feasibility of sorption at a higher temperature. In general, Δ
G for physisorption is in the range of −20 to 0 kJ mol
−1 while the chemisorption varies between −80 and −400 kJ mol
−1. The Δ
G values for M-LA-PAL and M-SA-PAL vary from −5.304 to −2.974 kJ mol
−1 over the temperature studied, indicating that physisorption took place in the sorption process. Conversely, the Δ
G value obtained for R-PAL is positive, which meant the sorption process is non-feasible and non-spontaneous at the studied temperature. However, Δ
H and Δ
S are negative, revealing that the sorption was feasible for R-PAL at lower temperatures.
36 The negative values of Δ
H for the PAL sorbents reveal that the sorption is exothermic and is more possible to control through physical processes involving weak forces of attraction.
37 The negative value of Δ
S indicates an increase in randomness in the solid–solution interface and oil molecules were orderly sorbed onto the PAL surfaces.
36
The minimum kinetic energy needed by the sorbate molecules to react with the active sites available on the surface of a sorbent is defined as the activation energy, Ea (kJ mol−1). The value of Ea can be determined from the Arrhenius equation (eqn (9)).
| |
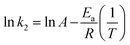 | (9) |
where
k2 is the pseudo-second order rate constant at a different temperature,
A is the Arrhenius constant and
R is the gas constant (8.314 J mol
−1 K
−1). The type of sorption (physisorption or chemisorption) can be identified from the magnitude of
Ea calculated. It was reported that an
Ea value of 5–40 kJ mol
−1 is due to physisorption while an
Ea value of 40–800 kJ mol
−1 is given by chemisorption.
8,36 During physisorption, equilibrium is attained rapidly and is easily reversible as the forces involved are weak while chemisorption is specific and the forces involved are much stronger than in physisorption.
38 The calculated
Ea values obtained were 10.74, 14.18 and 23.67 kJ mol
−1 for R-PAL, M-LA-PAL and M-SA-PAL, respectively and these imply that the sorption of oil molecules onto the PAL surfaces occurs through physisorption. These results are basically in agreement with the values of Δ
G and Δ
H, which confirmed that physisorption takes place during oil sorption onto the PAL sorbents. Sidik
et al. also reported that physisorption took place during the removal of dispersed crude oil by modified oil palm leaves.
8
3.7. Effect of contact time
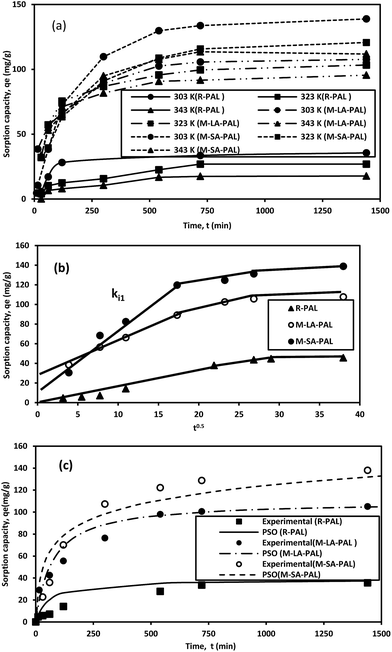
Sorption is a time dependent process and it is crucial to know the rate of sorption for designing and evaluating the sorbent performance in oil removal. The kinetics of oil sorption onto R-PAL and fatty acid esterified PAL (M-LA-PAL and M-SA-PAL) sorbents at various temperatures is presented in Fig. 7(a). It was found that the sorption rate was rapid for the first few hours, then proceeded at a slower rate and finally attained equilibrium sorption at 9 hours (540 minutes). The fast phase sorption may be due to sorption by the external surface area or the fiber pores whereas the slower rate is probably associated with the diffusion of the sorbate in the inner part of the fiber micropores.39 The sorption capacities of the PAL sorbents were found to decrease when the temperature was increased. The highest sorption capacities obtained at 303 K were 35.59, 107.67 and 138.89 mg g−1 for R-PAL, M-LA-PAL and M-SA-PAL, respectively.
 |
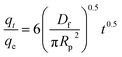
| | Fig. 7 Kinetics of oil sorption onto PAL sorbents: (a) sorption time dependence, (b) intraparticle/Weber–Morris plots of oil sorption kinetic data and (c) surface chemical interaction model analysis. Experimental conditions: pH 7; oil concentration 100 ppm; sorbent dosage 0.5 mg mL−1; t 0.5–24 hours and T 303–343 K. | |
The time dependence of sorption data was further analyzed assuming that the mechanism of oil sorption can generally be described by four consecutive rate controlling steps, namely external mass transfer (transport from the bulk solution to the sorbent surface), film diffusion (diffusion across the liquid film from the sorbent surface), intraparticle diffusion (pore diffusion, surface diffusion or a combination of both mechanisms), and surface interactions on the sorbent active sites. The diffusional model was derived by assuming (i) intraparticle diffusion occurs by pore volume diffusion (Fick diffusion) and surface diffusion, (ii) the rate of sorption on the active site is instantaneous, and (iii) sorbent particles are spherical.40
It is commonly known that the sorption process is a rate-controlled process in which the slowest step determines the process’s rate limiting step. Most of the time, only film and intraparticle diffusions are considered as rate limiting steps as the external mass transfer and surface chemical interaction processes are rapid. The rate limiting step of the sorption can be qualitatively determined by analyzing kinetic data using the Weber–Morris model as given by eqn (10).41,42
where
ki is the diffusion coefficient (mg g
−1 min
−0.5) and
C is a constant that gives an indication of the thickness of the boundary layer. The sorption process is said to be intraparticle diffusion controlled if the straight line plot passes through the origin while boundary layer diffusion (external mass transfer or film diffusion) may take place if it does not pass through the origin.
41 Fig. 7(b) shows that the plot of R-PAL passes through the origin, while those of M-LA-PAL and M-SA-PAL did not pass through the origin. A three-stage multi-linear sorption process is represented by: (a) 1st stage (
ki1) is attributed to the boundary layer diffusion of the sorbate molecules; (b) 2nd stage (
ki2) is the gradual intraparticle diffusion and (c) 3rd stage (
ki3) is attributed to the final equilibrium of the sorption process. The Weber–Morris model gives only a basic understanding of the diffusion mechanism. In order to confirm the rate limiting step of the diffusion process, the film diffusion and intraparticle coefficients need to be determined from the Fick's law model and Boyd's plot, respectively.
During the film diffusion, a fictitious laminar boundary film is formed near to the sorbent surface which the solute diffuses across. By considering other diffusion pathways as absent, the solute film diffusivity, Df (cm2 min−1) can be calculated using the Fick's law model developed by Crank as given in eqn (11).43,44
| |
 | (11) |
where
qt and
qe respectively represent the sorption capacity at any time
t and equilibrium (mg g
−1), and
R is the sorbent particle radius (m). The
Df value was calculated from the initial slope of the kinetic data and is tabulated in
Table 4. It was found that M-SA-PAL gave the highest calculated
Df value, followed by M-LA-PAL and R-PAL at a temperature of 303–343 K. The
Df value decreased as the temperature increased due to the greater internal energy of oil molecules.
Table 4 The calculated external mass transfer coefficient, film and effective diffusivities of PAL sorbents at 303–343 K
| |
Temperature (K) |
Sorbents |
| R-PAL |
M-LA-PAL |
M-SA-PAL |
| Effective diffusivity, Deff (×1013 m2 min−1) |
303 |
6.410 |
13.10 |
16.03 |
| 323 |
3.526 |
12.20 |
11.86 |
| 343 |
3.206 |
9.91 |
10.26 |
| Film diffusivity, Df (×1013 m2 min−1) |
303 |
3.080 |
5.6 |
6.8 |
| 323 |
2.552 |
5.5 |
6.7 |
| 343 |
2.507 |
5.0 |
5.5 |
Intraparticle diffusion occurs immediately after the film diffusion step. It involves the solute diffusing into the sorbent pores to the internal sorbent surface active sites. Intraparticle diffusion is usually dependent on the sorbent particle size, sorbate initial concentration and solid/fluid ratio (sorbent dosage) of the system.45,46 It comprises pore diffusion (Dp) and surface diffusion (Ds) in which the combination of both diffusion types is expressed as an effective diffusivity, Deff (m2 min−1). Previously, there were several models developed to study the intraparticle diffusivity, namely the film-pore diffusion model, pore volume diffusion model, pore volume and surface diffusion model and surface diffusion model by a numerical method (based on the tortuosity factor (τ)) and an analytical method (by minimizing the error (ARE) between the experimental time and the calculated time from the sorption model.47,48 However, Boyd's plot was used in this study rather than the above methods as it is simple and gives satisfactory results. By neglecting the effect of film diffusion, the effective diffusivity, Deff (m2 min−1) can be calculated using eqn (12)–(15):
| |
 | (12) |
| |
 | (13) |
where
F =
qt/
qe is the fractional attainment of equilibrium at time
t (min),
B is the time constant (min
−1) and
R is the radius of the sorbent particle.
Deff can be determined from Boyd's plot (
Bt versus time) in which
Bt can be expressed by
eqn (14) and
(15):
| | |
F values > 0.85, Bt = −0.4997 − ln(1 − F)
| (14) |
| |
 | (15) |
The slope of Boyd's plot (S) is given by eqn (16), from which the Deff value was then calculated and tabulated in Table 4.
| |
 | (16) |
Similar to the film diffusion study, the Deff of the PAL sorbents at any temperature follow the order M-SA-PAL > M-LA-PAL > R-PAL (Table 4). Deff was also found to decrease, as was observed for Df, with the increase of the sorption temperature. Since the film diffusion coefficient (Df) obtained was found to be lower than Deff, the film diffusion was identified as the rate limiting step of oil sorption onto R-PAL, M-NBS-PAL and M-SA-PAL sorbents.
The surface chemical interactions between solute and sorbent surface active sites can be either physical (physisorption), chemical (chemisorption) or a combination of both depending on the interaction forces involved. Several chemical reaction kinetic models have been reported to describe these interactions and the most widely used chemical reaction kinetic models are the pseudo-first order (Lagergren model), pseudo-second order (Ho and Mckay model) and Elovich models. The pseudo-first order (PFO) equation is generally applicable over the initial stage of the adsorption process whereas the pseudo-second (PSO) order equation predicts the behavior over the whole range of adsorption. The PFO assumes that the sorption is a pseudo-chemical reaction and the rate of occupation of binding sites is proportional to the number of the unoccupied sites of the sorbent.
The PSO model also assumes the sorption is a pseudo-chemical reaction and the rate of occupation of binding sites is proportional to the square of the number of unoccupied sites on the sorbent surface. The Elovich kinetic model is generally applicable to chemisorption kinetics whereby active sites are heterogeneous in nature and therefore exhibit different activation energies for chemisorption. This model was originally developed to describe the kinetics of heterogeneous chemisorption of gases onto solid surfaces but it is later used in soil chemistry generally to describe the kinetics of sorption and desorption of different types of inorganic materials on soils.49 The PFO, PSO and Elovich kinetic models can be expressed in a linear form as shown in eqn (17)–(19), respectively.
| |
 | (17) |
| |
 | (18) |
| |
 | (19) |
where
q0,
qt and
qe are, respectively, the initial (
t = 0), time
t (minutes) and equilibrium sorption capacities (mg g
−1),
k1 (g mg
−1 min
−1) and
k2 (g mg
−1 min
−1) are, respectively, the rate constants of the pseudo-first order and pseudo-second order kinetic models,
α is the initial sorption rate (mg g
−1 min
−1), and
β is the desorption constant (mg g
−1 h
−1).
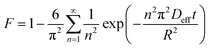
The coefficient of determination (R2), Pearson's chi-squared test (χ2) analysis and model parameter constants were calculated and are given in Table 5. The non-linear plot of the best fitting model using the parameters obtained from the linear fitting for the kinetic data of the PAL sorbents is shown in Fig. 7(c). For the entire sorption process, it shows that the PSO kinetic model gave the highest R2 and lowest χ2 values for the PAL sorbents studied compared to the PFO and the Elovich model. The kinetic data generated from the PFO and PSO models fitted the experimental data reasonably well and the qe,calc values were also close to qe,exp. However, the Elovich model shows poor fitting with the experimental data and the lowest R2 and highest χ2 values. Thus, the PSO kinetic model is much better than the PFO and Elovich models in interpreting the sorption behavior of oil sorption onto R-PAL, M-LA-PAL and M-SA-PAL after all the criteria were taken into consideration. This indicates that chemisorption takes place during the sorption of oil onto PAL sorbents.
Table 5 Kinetic model analysis of PAL sorbents
| |
Sorbents |
| R-PAL |
M-LA-PAL |
M-SA-PAL |
| qe,exp (mg g−1) |
35.59 |
107.67 |
138.89 |
|
| Pseudo-first order (PFO) |
| k1 (g mg−1 h−1) |
0.0668 |
0.0062 |
0.0076 |
| qe,calc (mg g−1) |
38.64 |
128.85 |
256.51 |
| R2 |
0.8926 |
0.9612 |
0.9095 |
| χ2 |
95.8295 |
|
|
|
| Pseudo-second order (PSO) |
| k2 × 103 (g mg−1 h−1) |
10.482 |
0.127 |
0.0716 |
| qe,calc (mg g−1) |
38.7597 |
109.89 |
131.58 |
| R2 |
0.9724 |
0.9929 |
0.9874 |
| χ2 |
20.8052 |
|
|
|
| Elovich |
| α (mg g−1 min−1) |
65.6011 |
8.5313 |
6.9359 |
| β (g mg−1) |
0.08244 |
0.0644 |
0.0465 |
| R2 |
0.9299 |
0.9521 |
0.8751 |
| χ2 |
34.8452 |
|
|
The kinetics of the process can thus be controlled by either diffusion or chemical steps which can be determined by analyzing the Ea calculated from the Arrhenius equation by plotting the Weber–Morris diffusion coefficient (ki1) against the reciprocal temperature.41 The energy of diffusion controlled sorption processes is usually less than 25–30 kJ mol−1 while energies higher than 25–30 kJ mol−1 normally indicate a chemical (activation) controlled process. The calculated Ea values of R-PAL, M-LA-PAL and M-SA-PAL were found to be 11.338, 8.443 and 8.183 kJ mol−1 respectively, indicating that the sorption process was controlled by diffusion. The film diffusion was thus confirmed as the rate limiting step of the oil sorption whereby the natural interactions at the surface active sites was physisorption for all the PAL sorbents studied. The same results were also reported for dispersed oil sorption.8
3.8. Oil sorption mechanism
The mechanism of oil sorption by natural fibers can be through absorption, capillary action, adsorption and/or a combination of these processes. The esterified PAL sorbents may follow the same mechanism as flax as both sorbents have hydrophobic and oleophilic features on the surface.50 Thus, the mechanism of oil sorption onto esterified PAL sorbents could be the combination of adsorption by the interaction of a hydrophobic surface and oil, adsorption of fibers that have an irregular surface morphology, and capillary action by the diffusion of oil into the sorbent (as a result of a concentration gradient and capillary pressure existing in the sorbent pores). Since the esterified PAL sorbent is a cellulosic fiber, the oil sorption of PAL sorbents by absorption into the pores may be assumed to be negligible.50
The oil sorption process on surface active sites may be physical, chemical and/or a combination of both. Physical sorption involves the transport of oil molecules from the bulk solution to the sorbent surfaces, while chemical sorption involves the interaction of oil molecules with sorbent surfaces either through physical or chemical interactions and/or a combination of both interactions. The sorption time needed by PAL sorbents in order to reach equilibrium is about 9 hours. The long sorption time denotes a slow external and intraparticle diffusion of oil molecules. The rapid phase at the early sorption stage is due to sorption by the external area or fiber pores whereas the slow phase is probably due to the diffusion of oil into the inner part of the fiber micropores.39 The calculated Ea value using the Weber–Morris diffusion coefficient (ki1) indicates that the oil sorption process was controlled by the diffusion process and film diffusion was confirmed as the rate limiting step based on the diffusion analyses which have been discussed previously.
The sorbate interactions at the sorbent surface active sites can be distinguished as physisorption, chemisorption and ion-exchange processes. Physisorption normally happens at a lower temperature and is characterized by a relatively low energy of sorption. It occurs due to van der Waals forces of attraction, which also means that the sorbate is not held strongly to the sorbent. Chemisorption is characterized by a high energy of sorption and is favored at a higher temperature. It involves valence forces through the sharing or exchange of electrons between the sorbent and sorbate and thus the chemisorbed molecules are held together by strong localized bonds.51 Ion-exchange involves the exchange of ions between the substance concentrated at the surface due to electrostatic attraction and the solute in the bulk solution.52 As discussed in the previous section, the sorption enthalpies of oil by R-PAL, M-LA-PAL and M-SA-PAL sorbents were 10.74, 14.18 and 23.67 kJ mol−1 which were in the range of 5–40 kJ mol−1. These results suggest that physical interactions (physisorption) took place in the sorption process. On the contrary, the results of surface chemical interaction data analysis indicated that chemisorption played a role in the dissolved oil sorption process too.
The characteristics of the sorbents also affect the sorption performance. The oil sorption capacity of natural fibers depends mostly on the surface void ratio and the surface composition of the fibers.53 Thus, in this case, the presence of active sites and functional groups on the sorbents is needed in order to attach the oil molecules onto the PAL sorbents. Many researchers reported that sorbents with hydrophobic and oleophilic properties are more favorable for oil removal processes.18,50 Due to this, mercerization was conducted to increase the active sites available, followed by esterification to attach the more hydrophobic and oleophilic long chain hydrocarbon groups onto the sorbent surface to enhance the sorption performance. The effect of the modifications is proven with the appearance of a peak at ∼1750 cm−1 which corresponds to the carbonyl groups originating from the fatty acids. Besides this, a broad band intensity observed at ∼3440–3252 cm−1 due to intermolecular hydrogen bonding was also reduced indicating that the hydroxyl groups in R-PAL were replaced by the acyl groups from the fatty acids. The effect of fatty acid esterification can also be proven by the results obtained from the XPS analysis as shown in Fig. 4(a) and (b). From the total C1s high resolution spectra, C4 (O–CO) appeared in the esterified PAL sorbents and the peak intensity for C1s increased in the PAL sorbents after the esterification process as the acyl groups from the fatty acids were introduced into the PAL sorbent. This was confirmed by the increase in peak intensity of the total O1s high resolution spectra after the sorbent modification.
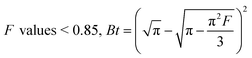
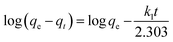
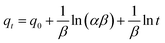
Crude oil consists of various types of hydrocarbons which have different affinities for sorption onto the sorbent surfaces. Fig. 8 shows the crude oil compositions: (a) crude oil; (b) crude oil-in-water before sorption; and crude oil-in-water after sorption by (c) M-LA-PAL and (d) M-SA-PAL sorbents. These results show that the crude oil comprises both short and long chain (C6 to C23) hydrocarbons as shown in Fig. 8(a). Only C7 to C13 hydrocarbons were detected in the oil-in-water solution and this represents dissolved hydrocarbons such as benzene, toluene, ethylbenzene and xylene (BTEX) and alkyl naphthalene.54 After sorption by the PAL sorbents, the peak number and peak abundance were reduced and this proved that certain hydrocarbon compounds were sorbed by the sorbents during the sorption process. These results indicate that the removal performance decreased with the decreasing carbon chain length of hydrocarbon compounds. This supports the fact that the dispersed oil has a better removal performance than the dissolved oil contaminant.
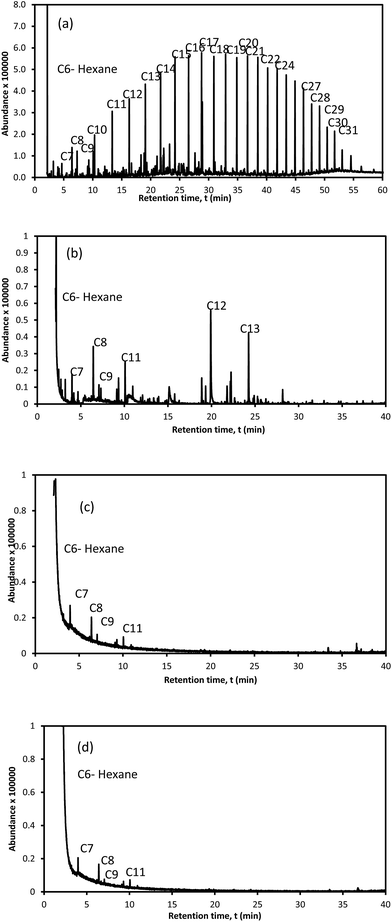 |
| | Fig. 8 The crude oil compositions: (a) crude oil; (b) crude oil-in-water before sorption; and crude oil-in-water after sorption by (c) M-LA-PAL and (d) M-SA-PAL sorbents. | |
3.9. Regeneration analysis
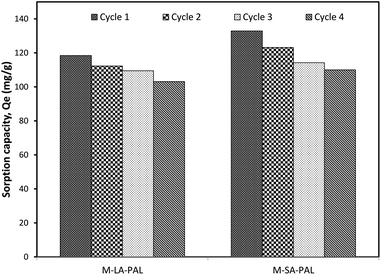
A regeneration study was conducted to demonstrate the reusability of the sorbent. The sorbent has to be reusable in order to save the operating cost. In the current study, the regeneration process was conducted up to 4 cycles, which was enough to demonstrate the reusability performance of the sorbent as illustrated in the literature. The study was conducted on M-LA-PAL and M-SA-PAL, which had a better performance than R-PAL. The sorbents were first loaded with crude oil and then the crude oil loaded sorbent was desorbed using isopropanol–water (1:1) solution. The oil sorption capacity with respect to the number of regeneration cycles is given in Fig. 9. The sorption capacity of M-LA-PAL and M-SA-PAL was 118.4 and 132.9 mg g−1, respectively for freshly prepared sorbents. After regeneration, the oil sorption capacity of M-LA-PAL and M-SA-PAL for the second cycle reduced by ∼5.20% and ∼7.44%, respectively. The sorbent sorption capacity decreased by 12.9 and 17.2% after four cycles for M-LA-PAL and M-SA-PAL, respectively. The results show that the repeatedly washed M-LA-PAL and M-SA-PAL can be used for up to 4 continuous cycles without a drastic drop of sorption capacity. The oil sorption capacity decrease with the increasing cycle number might be due to the incomplete desorption of oil molecules and led to some oil molecules still being retained on the sorbent surface after the sorption. Besides this, the sorption capacity decrease may also be due to leaching of the carbonyl functional groups into the desorbing solution during the desorption process. This study shows that M-LA-PAL and M-SA-PAL sorbents can be regenerated and reused repeatedly at least for four times. The comparison of the maximum oil sorption capacity of crude oil on various sorbents is shown in Table 6. Due to the different oil-in-water systems used in the previous and the current studies, the results were difficult to compare. Thus, M-LA-PAL and M-SA-PAL were also used to sorb oil from a dispersed oil system according to the method proposed by Sidik et al.8 and Sathasivam et al.14 The results show that M-LA-PAL and M-SA-PAL performed better than lauric acid treated OPL, carbonized rice husks and fatty acid modified BTF.8,14,15 These results show that PAL fiber and thus lignocellulosic biomass could be potentially used economically as precursors in sorbent synthesis for the treatment of oil contaminated wastewater such as water produced from oil and gas exploration activities.
 |
| | Fig. 9 Regeneration of M-LA-PAL and M-SA-PAL. | |
Table 6 Sorption capacity of various sorbents
| Oil-in-water (o/w) system |
Sorbent |
Sorption capacity, qe (g g−1) |
Oil concentration (ppm) |
Reference |
| Dissolved oil |
M-LA-PAL |
0.108 ± 0.004 |
100 |
This study |
| M-SA-PAL |
0.138 ± 0.002 |
100 |
This study |
| Dispersed oil |
M-LA-PAL |
1.860 ± 0.170 |
5000 |
This study |
| M-SA-PAL |
1.920 ± 0.170 |
5000 |
This study |
| M-LA-PAL |
8.230 ± 1.400 |
66667 |
This study |
| M-SA-PAL |
8.480 ± 2.000 |
66667 |
This study |
| Lauric acid treated oil palm leaves (OPL) |
1.200 ± 0.120 |
5600 |
Sidik et al.8 |
| Carbonized rice husks |
6.000 |
— |
Kumagai et al.15 |
| Fatty-acid modified banana trunk fibers (BTF) |
8.000 |
66667 |
Sathasivam et al.12 |
4. Conclusions
The lignocellulosic biomass of pineapple leaves (PALs) was used as a precursor for synthesis of a dissolved oil sorbent. The PALs were first mercerized followed by esterification with fatty acids to modify the surface chemistry and thus enhance the dissolved oil sorption performance. The sorption performance of the PAL sorbents follows the order M-SA-PAL > M-LA-PAL > R-PAL which is lower than the dispersed oil sorption. The sorption data analysis indicates that oil sorption onto PAL sorbents obeys the Langmuir isotherm and pseudo-second order (PSO) kinetic models. The experimental evidence indicates that oil removal from dissolved oil-in-water (o/w) solution was controlled by a physical phenomenon with film diffusion as the rate-limiting step, which is similar to those results previously reported for dispersed o/w sorption studies. The regeneration results show that the synthesized PAL sorbents can be regenerated and reused repeatedly at least for four times. These results indicate that lignocellulosic biomass such as PALs could potentially be used as a sorbent precursor not only for the removal of oil but also for other organic components from wastewaters. The conversion of lignocellulosic biomass to high value-added products such as sorbents could provide economic benefits and also reduce the potential risk of environmental pollution.
Acknowledgements
The financial supports from the Ministry of Higher Education (MOHE), Malaysia for the MyBrain15 scholarship and the Universiti Teknologi Malaysia, Malaysia for the Research University Grants (GUP Grant No. 00H63 and 06H85) are gratefully acknowledged.
References
- O. Rattanawong, L. Kaewsichan, N. Grisdanurak and A. Yuasa, Korean J. Chem. Eng., 2007, 24, 67–71 CrossRef CAS.
- A. Fakhru'l-Razi, A. Pendashteh, L. C. Abdullah, D. R. A. Biak, S. S. Madaeni and Z. Z. Abidin, J. Hazard. Mater., 2009, 170, 530–551 CrossRef PubMed.
- J. Wang, Y. Zheng and A. Wang, J. Environ. Sci., 2013, 25, 246–253 CrossRef CAS.
- A. Fakhru'l-Razi, A. Pendashteh, L. C. Abdullah, D. R. A. Biak, S. S. Madaeni and Z. Z. Abidin, J. Hazard. Mater., 2009, 170, 530–551 CrossRef PubMed.
- A. Torabian, H. Kazemian, L. Seifi, G. N. Bidhendi, A. A. Azimi and S. K. Ghadiri, Clean: Soil, Air, Water, 2010, 38, 77–83 CrossRef CAS.
- G. Deschamps, H. Caruel, M. E. Borredon, C. Bonnin and C. Vignoles, Environ. Sci. Technol., 2003, 37, 1013–1015 CrossRef CAS PubMed.
- A. R. Tembhurkar and R. Deshpande, J. Hazard., Toxic Radioact. Waste, 2012, 16, 311–315 CrossRef CAS.
- S. M. Sidik, A. A. Jalil, S. Triwahyono, S. H. Adam, M. A. H. Satar and B. H. Hameed, Chem. Eng. J., 2012, 203, 9–18 CrossRef CAS.
- W. Zhang, H. Li, X. Kan, L. Dong, H. Yan, Z. Jiang, H. Yang, A. Li and R. Cheng, Bioresour. Technol., 2012, 117, 40–47 CrossRef CAS PubMed.
- C. Vaca-Garcia, S. Thiebaud, M. E. Borredon and G. Gozzelino, J. Am. Oil Chem. Soc., 1998, 75, 315–319 CrossRef CAS.
- N. Lopattananon, K. Panawarangkul, K. Sahakaro and B. Ellis, J. Appl. Polym. Sci., 2006, 102, 1974–1984 CrossRef CAS.
- A. R. Bertoti, S. Luporini and M. C. A. Esperidião, Carbohydr. Polym., 2009, 77, 20–24 CrossRef CAS.
- J. Wang, Y. Zheng and A. Wang, Ind. Crops Prod., 2012, 40, 178–184 CrossRef CAS.
- K. Sathasivam and M. R. H. Mas Haris, Water, Air, Soil Pollut., 2010, 213, 413–423 CrossRef CAS.
- S. Kumagai, Y. Noguchi, Y. Kurimoto and K. Takeda, Waste Manag., 2007, 27, 554–561 CrossRef CAS PubMed.
- N. Ali, M. El-Harbawi, A. A. Jabal and C. Y. Yin, Environ. Technol., 2012, 33, 481–486 CrossRef CAS PubMed.
- X. F. Sun, R. C. Sun and J. X. Sun, J. Mater. Sci., 2003, 38, 3915–3923 CrossRef CAS.
- L. Vlaev, P. Petkov, A. Dimitrov and S. Genieva, J. Taiwan Inst. Chem. Eng., 2011, 42, 957–964 CrossRef CAS.
- M. Husseien, A. A. Amer, A. El-Maghraby and A. Taha, Int. J. Environ. Sci. Technol., 2009, 6, 123–130 CrossRef CAS.
- S. Ibrahim, H. M. Ang and S. Wang, Bioresour. Technol., 2009, 100, 5744–5749 CrossRef CAS PubMed.
- N. A. Lutpi, in Proceedings of the 3rd (2011) CUTSE International Conference, 2011, pp. 8–9 Search PubMed.
- S. Neupane, S. T. Ramesh, R. Gandhimathi and P. V. Nidheesh, Desalin. Water Treat., 2014, 54, 2041–2054 CrossRef.
- C. H. Weng, Y. T. Lin and T. W. Tzeng, J. Hazard. Mater., 2009, 170, 417–424 CrossRef CAS PubMed.
- B. H. Hameed, R. R. Krishni and S. A. Sata, J. Hazard. Mater., 2009, 162, 305–311 CrossRef CAS PubMed.
- P. Jandura, B. V. Kokta and B. Riedl, J. Appl. Polym. Sci., 2000, 78, 1354–1365 CrossRef CAS.
- A. R. Sena Neto, M. A. M. Araujo, F. V. D. Souza, L. H. C. Mattoso and J. M. Marconcini, Ind. Crops Prod., 2013, 43, 529–537 CrossRef CAS.
- N. E. Thompson, G. C. Emmanuel and K. J. Adagadzu, Arch. Appl. Sci. Res., 2010, 2, 142–151 Search PubMed.
- P. Garside and P. Wyeth, Stud. Conserv., 2003, 48, 269–275 CrossRef CAS.
- M. S. Huda, L. T. Drzal, A. K. Mohanty and M. Misra, Compos. Interfaces, 2008, 15, 169–191 CrossRef CAS.
- A. Valadez-Gonzalez, J. M. Cervantes-Uc, R. Olayo and P. J. Herrera-Franco, Composites, Part B, 1999, 30, 321–331 CrossRef.
- L. M. Matuana, J. J. Balatinecz, R. N. S. Sodhi and C. B. Park, Wood Sci. Technol., 2001, 35, 191–201 CrossRef CAS.
- S. Ibrahim, S. Wang and H. M. Ang, Biochem. Eng. J., 2010, 49, 78–83 CrossRef CAS.
- M. Zhu, J. Yao, L. Dong and J. Sun, Chemosphere, 2016, 144, 1639–1645 CrossRef CAS PubMed.
- H. H. Sokker, N. M. El-Sawy, M. A. Hassan and B. E. El-Anadouli, J. Hazard. Mater., 2011, 190, 359–365 CrossRef CAS PubMed.
- I. A. W. Tan, B. H. Hameed and A. L. Ahmad, Chem. Eng. J., 2007, 127, 111–119 CrossRef CAS.
- L. Abramian and H. El-Rassy, Chem. Eng. J., 2009, 150, 403–410 CrossRef CAS.
- V. Vimonses, S. Lei, B. Jin, C. W. K. Chow and C. Saint, Chem. Eng. J., 2009, 148, 354–364 CrossRef CAS.
- Z. Aksu and E. Kabasakal, Sep. Purif. Technol., 2004, 35, 223–240 CrossRef CAS.
- F. Aloulou, S. Boufi and J. Labidi, Sep. Purif. Technol., 2006, 52, 332–342 CrossRef CAS.
- R. Ocampo-Pérez, M. M. Abdel daiem, J. Rivera-Utrilla, J. D. Méndez-Díaz and M. Sánchez-Polo, J. Colloid Interface Sci., 2012, 385, 174–182 CrossRef PubMed.
- Y. S. Ho, J. C. Y. Ng and G. McKay, Sep. Purif. Rev., 2000, 29, 189–232 CrossRef CAS.
- A. E. Ofomaja, Bioresour. Technol., 2010, 101, 5868–5876 CrossRef CAS PubMed.
- J. Crank, The Mathematics of Diffusion, Oxford University Press, Oxford, 1975 Search PubMed.
- G. L. Dotto and L. A. A. Pinto, J. Hazard. Mater., 2011, 187, 164–170 CrossRef CAS PubMed.
- V. K. Gupta and N. Verma, Chem. Eng. Sci., 2002, 57, 2679–2696 CrossRef CAS.
- C. F. Chang, C. Y. Chang, W. Höll, M. Ulmer, Y. H. Chen and H. J. Gross, Water Res., 2004, 38, 2559–2570 CrossRef CAS PubMed.
- K. K. H. Choy, J. F. Porter and G. McKay, Chem. Eng. Sci., 2004, 59, 501–512 CrossRef CAS.
- R. Ocampo-Perez, R. Leyva-Ramos, P. Alonso-Davila, J. Rivera-Utrilla and M. Sanchez-Polo, Chem. Eng. J., 2010, 165, 133–141 CrossRef CAS.
- D. L. Sparks, in Soil Physical Chemistry, ed. D. L. Sparks, CRC Press, 2nd edn, 1999, pp. 135–191 Search PubMed.
- I. A. Ansari, G. C. East and D. J. Johnson, J. Text. Inst., 2009, 94, 1–15 CrossRef.
- Y. S. Ho and G. McKay, Process Biochem., 1999, 34, 451–465 CrossRef CAS.
- S. Ayoob, A. K. Gupta and V. T. Bhat, Crit. Rev. Environ. Sci. Technol., 2008, 38, 401–470 CrossRef CAS.
- T. A. Dankovich and Y. Lo Hsieh, Cellulose, 2007, 14, 469–480 CrossRef CAS.
- T. Utvic, Chemosphere, 1999, 39, 2593–2606 CrossRef.
|
| This journal is © The Royal Society of Chemistry 2016 |
Click here to see how this site uses Cookies. View our privacy policy here. 
 b and
Hanapi Mat*ac
b and
Hanapi Mat*ac