A. Bele,
G. Stiubianu,
S. Vlad,
C. Tugui,
C. D. Varganici,
L. Matricala,
D. Ionita,
D. Timpu and
M. Cazacu*
“Petru Poni” Institute of Macromolecular Chemistry, Aleea Gr. Ghica Voda 41A, 700487 Iasi, Romania. E-mail: mcazacu@icmpp.ro
First published on 15th January 2016
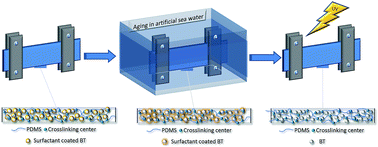
A series of silicone–barium titanate composites (multiple specimens of each sample), designed as dielectric elastomeric films to be used as active elements in wave energy conversion devices, were immersed in artificial sea water in pseudo-dynamic conditions. While some of specimens were extracted after half a year and subsequently subjected to UV irradiation for 500 h (ASW1/2 + UV procedure), the rest were kept in the saline environment for one year (ASW procedure). The changes that occurred in the structure and morphology as well as in mechanical and dielectric properties were assessed by comparing the obtained results to those of the original samples. Thus, the surface and cross-section morphology was studied by Scanning Electron Microscopy (SEM) having an attached Energy Dispersive X-ray system (EDX), which was used for qualitative elemental analysis and elemental mapping. Changes in surface roughness due to the aging of samples were estimated on the basis of Atomic Force Microscopy (AFM) measurements. The thermal transitions were identified from the Differential Scanning Calorimetry (DSC) data and based on these, the crystallinity degree of the samples was evaluated in each of the three stages. The changes in the structural order were also verified by Wide Angle X-ray Diffraction (WAXD). The tensile toughness, as the amount of energy per volume unit that the material can absorb until failure, was estimated by the area under tensile stress–strain curves. The toughness at 100% elongation was determined on the basis of cyclic stress–strain curves of the original samples as an indirect measure of the energy that the elastic material could release when force that acted on it is removed, like in an energy harvesting system. The aging effect on the viscoelasticity of the samples was evaluated by dynamic mechanical analysis (DMTA), while dielectric spectroscopy was used to estimate the changes in dielectric properties.
Marine medium is considered aggressive from chemical (high content of salts), physical (water pressure, wave power, temperature changes) and biological (attachment of bacteria and microalgae) points of view. Although aging in marine environment has been extensively investigated for some organic materials,18–20 there are few reports about the behavior and aging mechanism of the elastomers such as silicone, in such an environment.21–24 The processes that can occur in the marine environment are water absorption, hydrolysis, additive extraction, oxidation, in dependence on material nature and composition.24–26 However, there are very few long term data available, which limits clear explanations of the aging mechanisms involved.24 Three different silicones formulated to have high refractive index were subjected to accelerated aging tests differing by light source, humidity, temperature, time. The results indicated in general a good survival of the original properties but in dependence on silicone compositions.27 Other aging tests on the silicone rubber outdoor polymer insulator under salt water based on a standardized procedure (dip wheel, continuous 30000 test cycles) revealed decreasing in hydrophobicity and increasing in hardness.28
In this paper, we studied the aging of a series of silicone–barium titanate composites designed to be used as dielectrics in wave energy conversion devices. We have developed these composites in a larger study aiming the optimization of the silicones mainly in terms of mechanical and dielectric properties for use as dielectrics in wave energy harvesting units. We chose barium titanate as filler for silicones, which is one of the most researched dielectric materials, due to its high dielectric permittivity and low loss characteristics. In addition, it can be easily prepared and used, being chemically and mechanically very stable.29,30 Barium titanate powder of high purity is reported to be a key component in applications, such as energy storage capacitors and multilayer capacitors.29,31
Considering the fact that these materials will be an essential part of ocean energy recovery devices that should work as long as possible in a marine environment where, besides water and its components, sunlight including UV radiation also acts on the immersed materials, we considered appropriate to assess their behavior in such an environment. For this purpose, the composites were immersed for one year in artificial sea water mainly in static conditions with intermittent back and forth movements (ASW procedure). Similar samples extracted after half a year from saline water were further exposed to UV radiation (ASW1/2 + UV procedure). The changes occurred in the morphology, thermal, mechanical and dielectric properties were monitored from time to time. Similar studies have been reported in literature but on other types of composite (i.e., epoxy resins reinforced with glass fiber,32,33 carbon fiber/epoxy composites34,35). We started from the premise that hydrophobic silicone matrix will limit water sorption, which is the key issue in ensuring the long term stability of polymer matrix composites.34,36,37
Sample | Mn, g mol−1 | PDMS, g | BT, g | Pl L31, mL | MTAS, g |
---|---|---|---|---|---|
M1BT10 | 40![]() |
5 | 0.50 | 0.50 | 0.0230 |
M1BT15 | 40![]() |
5 | 0.75 | 0.75 | 0.0230 |
M2BT10 | 235![]() |
5 | 0.50 | 0.50 | 0.0040 |
M2BT15 | 235![]() |
5 | 0.75 | 0.75 | 0.0040 |
M3BT10 | 650![]() |
5 | 0.50 | 0.50 | 0.0015 |
M3BT15 | 650![]() |
5 | 0.75 | 0.75 | 0.0015 |
![]() | ||
Fig. 2 Comparative Raman spectra of the sample M1BT10, original and aged by ASW1/2 + UV and ASW procedures. |
![]() | ||
Fig. 3 WAXD patterns for: (a) barium titanate as compared with composite samples M2BT10, M2BT15 and M1BT10: (b) no aged; (c) ASW1/2 + UV aged; (d) ASW aged. |
Differential scanning calorimetry analysis results (Fig. 5S, Table 2S†) reveal the glass transition values for the initial samples in the range −123 ÷ (−120) °C. Unsignificant variations occur as a result of aging. However, larger changes are registered for the crystallization degree, χc (Fig. 4), evaluated on the basis of DSC curves (calculated with the equation ΔHt2/ΔHliterature, where ΔHliterature = 61.3 J g−1 (ref. 46–50) in dependence on the polymeric matrix structure). As can be observed in Fig. 4, it decreases with decreasing molecular weight of the polymer matrix. This is normal behavior because here the crosslinking degree is higher, thus limiting the degree of freedom of the chain to adopt ordered conformations. No significant changes develop in the degree of crystallinity of the samples due to variation in the filler content or due to their submission to the two aging processes, excepting M1BT series were a slight decrease in this parameter could be observed after ASW aging.
![]() | ||
Fig. 4 Crystallization degree, χc, for M1BT, M2BT, and M3BT series (Table 2S†). |
![]() | ||
Fig. 5 SEM images of M2BT15 (left) and M1BT10 (right) samples in different stages: (a) original; (b) ASW1/2 + UV aging; (c) ASW aging; (d) extracted in clean water. |
It is presumed that in the high polar medium or/and UV light exposure, the film surface reorganizes leading to considerable increases in its hydrophilicity and roughness as has also been revealed by other studies.51 AFM images of initial films and those aged through the two procedures, after these were well washed with clean water, confirm the SEM observations (Fig. 6). The root mean square roughness, Sq (nm), estimated by statistical processing of the AFM measurements in three different areas with 20 × 20 μm surface for sample M2BT15, for example, increase from 9.5 (no aged) to 199.6 (ASW1/2 + UV) and 346.0 nm (ASW).
![]() | ||
Fig. 6 2D (top) and 3D (down) AFM images for the sample M2BT15: (a) no aged; (b) ASW1/2 + UV aged; (c) ASW aged. |
EDX analysis reveals the presence of Na and Cl besides the other expected elements, O, Si, Ba and Ti, on the surface of the aged film (Fig. 7). After extraction with distilled water, one can see the imprint left on the surface film by sodium chloride crystals as track of their dissolution (Fig. 5d). EDX analysis and elemental mapping confirms the absence of Na and Cl on the film surface after washing (Fig. 8). By analyzing again the EDX data of the samples as were removed from artificial sea water (Fig. 7), it can be seen that in samples containing a larger amount of surfactant, such as those of M2BT15 (amount of surfactant incorporated is equal to that of BT as shown in Table 1), a greater amount of chlorine and sodium was found both on surface and in section of the aged films. In the case of sample M2BT10, where a lower amount of surfactant was used, the natrium chloride deposited on the outer surface or migrated into the sample is in very little amount (much below one percent). On this basis, we can opine that the surfactant is one that favors both sodium chloride deposition on the surface and its migration inside the film. Also the amount of natrium and chlorine elements identified by EDAX within the samples increase when the immersion time in artificial sea water is longer.
![]() | ||
Fig. 7 EDX spectra and elemental composition estimated for the sample M1BT10 and M2BT15 aged by different protocols, on outer surface and in section. |
![]() | ||
Fig. 8 Elements mapping on the surface of sample M1BT10 aged according to ASW1/2 + UV procedure and subsequently washed with clean water. |
![]() | ||
Fig. 9 Normal (left) and cyclic (right) stress–strain curves for no aged (a and b), ASW + UV aged (c and d) and ASW aged (e and f) samples. |
![]() | ||
Fig. 10 Comparative graphic representation of the relevant mechanical characteristics for all samples in different stages of aging (Table 3S†). |
A drastic decrease of the elongation is observed when the samples were submitted to ASW1/2 + UV aging (Fig. 9c, Table 3S,† Fig. 10). It is well-known that silicones are UV resistant, so rises question in connection with other components such as surfactant used. Pluronic L31 is an amphiphile copolymer that acts like a surfactant with the hydrophilic part, poly(ethylene glycol), oriented to the polar hydrophilic barium titanate particles, while the hydrophobic blocks are oriented in the opposite direction to hydrophobic silicone matrix, thus assuring the compatibilization of the two components and good dispersibility of the particles within continue silicone phase. UV degradation of polyethers in general and Pluronic in particular is well documented in the literature54–58 and it has been shown to result from oxidability of the carbon atoms in the α-position to the oxygen atom.55 Degradation begins with molecular oxygen addition reaction followed by intermolecular extraction of hydrogen with formation of hydroperoxide species and their foto-induced splitting generating alkoxy radicals. Poly(propylene oxide) block of Pluronic is more susceptible to degradation due to the high lability of the hydrogen from the tertiary carbon. It is generally agreed that the α-scission of alkoxy radical results in aldehyde carbonyl.54 Our IR study on the behaviour of surfactant subjected to UV irradiation alone reveals the appearance and development of a new absorption band at 1724 cm−1 assigned to formate CO (Fig. 4S†).54 The weak absorption band at 1641 cm−1 could be associated with the bending mode of water molecule in monomer state.59
Thus, due to surfactant degradation and its migration outside, the filler is no longer compatible with the matrix and the maximum elongation decrease. The elastic properties are not changed during this aging (Fig. 9d). After one year in saline water only, almost all samples show around 30% decreasing in the maximum elongation values (Fig. 9e, Table 3S,† Fig. 10), while the mechanical strength significantly increases. M3BT and M2BT series still maintain high elongation that suits from this point of view for energy harvesting (more than 400%, up to 800%). The elastic properties are not affected, moreover for M3BT series the hysteresis loop disappears (Fig. 9f).
The domains characteristic for perfectly elastic materials within the samples behaviour were estimated on the basis of linear part of the stress–strain curves (Table 4S†) and the values are graphical showed in Fig. 11 as strain and elasticity modulus values. As expected, elastic modulus increases by decreasing the molecular mass of the polymeric matrix, while the elongation limits slightly decrease. An increasing in elasticity modulus is also registered as a result of either ASW1/2 + UV or ASW aging process, the elongation remaining almost in the same range values.
![]() | ||
Fig. 11 Permanent set values estimated on the basis of tensile tests on the initial samples and after aging (Table 4S†). |
While the strength indicates how much force the material can support, the tensile toughness is a measure of the amount of energy per volume that a material can absorb to failure and is estimated as area under tensile stress–strain curves (Table 3S†).60–62 The values of the area integrated under the entire stress–strain curve, to the break point, known as ultimate tensile toughness (UTT), are graphically presented for both our original and aged samples in Fig. 12a. As it is known, in order to be tough, a material must be both strong and extensible. If we analyze the entire spectrum of stress–strain curves, and taking into account the structure and composition of the materials, it would be expected as the balance to be best met by the samples based on PDMS having molecular mass of 235000 g mol−1 (M2BT series). The samples based on the highest molecular mass PDMS (650
000 g mol−1) (M3BT series) possess low crosslinking density that results in high elongation and low brittleness, while the samples from M1BT series, which are based on the lowest molecular mass PDMS (40
000 g mol−1), are strong but have weak stretching capability. Excepting the original M3BT10 sample, which shows the highest UTT value, 17.46 kJ m−3, this expectation is confirmed. The values for the original M2BT series are larger (9.88 and 6.79 kJ m−3) as compared with the other samples, M3BT15 (5.35 kJ m−3) and M2BT1 series (2.78 and 3.90 kJ m−3). However, these values are lower as compared with those reported in literature for examples, for stronger polystyrene and ethylene–styrene interpolymers, and estimated on the same bases, when they are ranging between 9 and 61 MJ m−3 in dependence on composition.62 On silicones, we found in literature the fracture energy estimated for commercial ZruElast™ A1040 to be 6.15 kJ m−2.63 This suggests that our material would be suitable for harvesting rather low energies. Instead they have the advantage of a good weathering behaviour if properly formulated (e.g., avoid using surfactants). By ASW1/2 + UV aging, significant decrease of the toughness occurs for the samples M2BT and M3BT (3.06–6.11 kJ m−3), while by applying ASW procedure, the values for these samples are significantly higher (13.89–15.53 kJ m−3). An explanation could be that, during the ASW1/2 + UV aging process, surfactant through its UV degradation polar products migrates to the outer surface of the non-polar matrix as SEM images revealed (Fig. 5b). Great length of chains between crosslinking nodes of the series M2BT and M3BT and their flexibility facilitate this phenomenon. Proof are and decrease elongation and increasing modulus values for these two series aged by ASW1/2 + UV procedure as compared with the values for the initial samples (Fig. 10b and c, Table 3S†). The M1BT series having the lowest toughness values seems to be the least affected by the aging process from this point of view.
![]() | ||
Fig. 12 The ultimate tensile toughness (UTT) values in dependence on the aging state for all prepared samples (Table 3S†) – (a), and toughness at 100% elongation in cyclic regime for initial samples (Table 5S†) – (b). |
Other values of absorbed energy from an integration of partial stress–strain curves have no standard name. Although it is not a common practice, we evaluated the toughness at 100% elongation on cyclic stress–strain curves of the original samples as an indirect measure of the energy that the elastic material could release when force that acted on it was removed like in a harvesting energy system. If we analyse the values presented in Table 5S† and graphical showed in Fig. 12b, it can see that the M1BT samples show significantly higher toughness values as compared with M2BTs and M3BTs. Concerning to the effect of the barium titanate content, its enhancing percentage of 5 wt% leads to an increase in toughness with about 3% in M1BTs but with about 72% in M3BTs, probably as a result of BT contribution mainly to reduce the extensibility of the sample. Excepting the first cycle, the toughness estimated on the basis of the other cycles is almost unmodified in all cases.
The effect of aging on the viscoelastic properties of M2BT15 sample was also investigated in isochronal measurements using DMTA. Fig. 13 shows in comparison the storage modulus and loss factor spectra for the no aged and aged samples under procedure ASW1/2 + UV and ASW, respectively. Three regions of viscoelastic behavior were observed for all samples: the glassy region, the glass transition region and the rubbery region. The most relevant changes in the viscoelastic behavior brought about by aging on the main viscoelastic characteristic are presented in Fig. 13 and Table 2.
![]() | ||
Fig. 13 Variation of the storage modulus and loss factor with temperature for no aged and aged M2BT15 samples. |
Sample | Glassy region | Glass transition region | Rubbery region | |
---|---|---|---|---|
−125 °C | Tg, °C | 25 °C | ||
E′, GPa | tan![]() |
htan![]() |
E′ × 10−4, Pa | |
a htan![]() ![]() |
||||
M2BT15 | 2.5 | −120.8 | 0.085 | 1.71 |
M2BT15 ASW1/2 + UV aged | 2.6 | −118.7 | 0.088 | 1.73 |
M2BT15 ASW aged | 2.8 | −119.1 | 0.098 | 4.64 |
The glassy region was characterized by a stiff material response evidenced by a storage modulus higher than 109 Pa. In this region, the macromolecular chains are in frozen state, so the segmental mobility is restricted. An increase in E′ is observed after aging, either by ASW1/2 + UV or ASW procedure reflecting a higher rigidity. This trend is similar to those recorded for the evolution of Young's modulus. The aging also modifies the viscoelastic behavior in the glass transition region. The beginning of α-relaxation associated with the glass transition of M2BT15 is marked by a gentle drop in the storage modulus and is accompanied by a small tanδ peak. The very low value of tan
δ and the decrease of E′ with less than one order of magnitude are justified by the presence of crystalline domains in PDMS as was already proved by DCS measurements. These crystalline regions act as crosslinking points and restrict the long range segmental motion characteristic to a glass transition, thus providing the prevailing of the elastic component over the viscous component. After aging, the onset of E′ drop and the tan
δ peak are shifted slightly to higher temperatures compared with the sample before aging, resulting in a slight increase in Tg. Interestingly, the aging also generates an increase in intensity and a broadening of tan
δ peak (left side inset of Fig. 13). The broadening of the tan
δ peak indicates the presence of a more heterogeneous structure, whereas the increase in amplitude reflects a higher mobility of polymeric chains. As the temperature is raised above Tg, an abrupt decrease of the storage modulus accompanied by a sharp change in tan
δ was observed. These changes mark the melting of the crystalline phase, which comes out at the same temperature (−49 °C) for all samples. After the sharp drop, the storage modulus of the non-aged and ASW1/2 + UV aged reaches plateaus at a relatively constant value (around 104 Pa) and preserves a good thermal stability until the end of the experiment. The increase of temperature above −40 °C brings additional rigidity for M2BT15 ASW aged. Therefore an increase in E′ is observed in this region strongly dependent on the chemical structure of the polymer.
As expected, the dielectric permittivity for samples without aging increases by incorporation of barium titanate, a dielectric ceramic. Thus, while pure crosslinked PDMS have ε′ ∼ 3 at 10 Hz, increases up to 3.78 and 5.03 for M1 series, 4.41 and 5.07 for M2 series, 4.95 and 5.89 for M3 series, at 10 and 15% BT addition, respectively, were observed for this characteristic. Comparing the samples containing the same amount of BT, we can conclude that even the polymeric matrix has some influence on dielectric permittivity, this increasing from 3.78 up to 4.95 when molecular weight of PDMS used increases for example, from 40 000 g mol−1 (M1BT10) up to 650 000 g mol−1 (M3BT10), respectively (Fig. 14a, Table 3S†). There is a sudden drop at about 103 Hz for ε′, accompanied with the maximum dielectric loss, ε′′ (Fig. 14b), suggesting a relaxation process occurring at silicone–filler interface. The decrease in the dielectric permittivity is due to the inability of the dipoles to return to its original random orientation, known as relaxation time, which is larger than the rate of oscillating electric field.
![]() | ||
Fig. 14 Frequency variation of dielectric permittivity (left) and dielectric losses (right) for samples without aging (a and b), after ASW1/2 + UV aging (c and d) and ASW aging (e and f). |
After ASW1/2 + UV aging (Fig. 14c and d, Table 3S†), slight decreases in dielectric permittivity and dielectric loss are observed (Fig. 15) and, moreover, stabilization at high frequencies occurs. After one year in saline water (ASW) along with an increase in permittivity, a high increase in dielectric loss was observed for M3BT and M2BT series (Fig. 14e and f and 15 Table 3S†), due to the salt ions that migrate inside films as EDX results showed (Fig. 7). For M1BT series, a small decrease both in dielectric permittivity and dielectric loss can be noticed. However, the conductivity–frequency curves (Fig. 6S†) show that all samples are maintained in semiconductor (10−18 to 10−8 S cm−1) field regardless of the aging process in which they were submitted.
![]() | ||
Fig. 15 Comparative dielectric permittivity (a) and loss (b) values at 10 Hz for all samples in different stages of aging (Table 3S†). |
Analyzing the results from the perspective of the target application of the prepared materials, e.g., their use as active elements in devices for wave energy harvesting, it can be said that, the main features that determines the electromechanical functionality are Young modulus that must be kept low, high elongation, high dielectric permittivity and low dielectric loss but also their constancy for a longer period in the given conditions (immersed in seawater under the influence of sunlight, which includes UV radiation). Considering the molecular weight of PDMS matrix and content of BT including compatibilizing agent (surfactant) as control parameters for their design, based on the mechanical and dielectric measurements results, it can be appreciated that increasing molecular weight leads, as it expected, to lower modulus and increased elongation. The BT and surfactant addition in increasing amounts has the effect of increasing the dielectric permittivity up to 33% for 5 wt% addition of BT but both elongation and modulus decrease. Dielectric loss amounts are low and do not vary significantly. As a result of the successive action of salt water and UV (ASW1/2 + UV), dielectric permittivity and the elongation decreased significantly and the modulus increases, while the prolonged action of salt water only (ASW) does increase all these parameters, elongation, modulus, but the dielectric permittivity and loss. Some anomalies in the behavior of composites, such as lowering modulus when increases the BT addition, but also different aging patterns in the conditions ASW1/2 + UV or ASW only are determined by surfactant that can play and lubricant role but is photodegradability is the weak point of the composite formula.
Footnote |
† Electronic supplementary information (ESI) available. See DOI: 10.1039/c5ra22780a |
This journal is © The Royal Society of Chemistry 2016 |