DOI:
10.1039/C5RA22645G
(Paper)
RSC Adv., 2016,
6, 11609-11617
Inverse effects of supporting electrolytes on the electrocatalytic nitrate reduction activities in a Pt|Nafion|Pt–Cu-type reactor assembly
Received
29th October 2015
, Accepted 13th January 2016
First published on 15th January 2016
Abstract
In this article, the effects of Cl− and SO42− ions on the electrocatalytic nitrate reduction activities in a sandwich-type reactor assembly are illustrated. It was noticed that a Pt|Nafion|Pt–Cu assembly offers its best efficiency in the absence of any supporting electrolytes. The Pt–Cu thin layers adsorb chloride and sulphate ions firmly, and this adsorption blocks the H+ reducing sites at the cathode end of the catalytic assembly, leading to a decrease in catalytic efficiency. In the presence of chloride and sulphate ions, the reduction reactions of NO3− and NO2−, respectively, are relatively favoured.
Introduction
The nitrate reduction process is extremely important to researchers working in an environmental context.1–25 Furthermore, numerous useful chemicals, such as NH3, N2, NO, N2O, NO2, HNO2, and NH2OH, may be synthesized by reducing nitrate ions.8–32 Therefore, studies of nitrate reduction reactions (NRR) are essential from the view of both environmental and synthetic issues. Catalytic hydrogenation of nitrate ions has been widely studied in the literature.6–9 This process is cost-effective, as well as the materials often cannot be reused. In this connection, the development of suitable catalytic materials and their application in an electrolysis reactor is relatively inexpensive and easily done.
The geometry of a reactor plays crucial roles concerning the reactivity, selectivity and reproducibility of a catalytic process.17 In a conventional electrolysis reactor, the catalytic surfaces often become poisoned and/or lose stability.27 To overcome this problem, a sandwich-type membrane reactor has been fabricated as shown in Fig. 1.21,27 These types of reactors (M|membrane|M, M = Pt, Pd, Pt–Pd) have been successfully employed for the selective oxidation of various organic compounds.33–37 In a conventional reactor, ample of supporting electrolyte is a prerequisite, as it can decrease the solution resistance. Although the conductivity requirement is successfully satisfied in such a case, an additional process is required to separate the synthesized products from the supporting electrolytes. However, such a constraint is not applicable for the M|membrane|M-type reactors because a conductive membrane serves as an electrolytic junction between the anode and the cathode. In a previous article, we reported that reproducible catalytic performance (of Pt–Cu cathode) can be observed if a pure nitrate-containing solution is electrolysed,17 but the impacts of supporting electrolytes have never been investigated as they pertain to reduction reactions using these types of reactors. In addition, in the coastal regions of many areas (e.g. Bangladesh), various electrolytes such as NaCl and Na2SO4 coexist along with NaNO3.38 Thus, if someone intends to reduce nitrate ions from saline water using this type of reactor, the electrocatalytic ability/responses of the electrode assembly must be checked in the presence of some common electrolytes such as NaCl, Na2SO4 etc. Hence, the aim of this article is to unveil the responses of these two very common electrolytes on the activities of the sandwich-type membrane reactor. Since copper metal is known as one of the best electrocatalysts in attaining NRR,15,17,19 a Pt|Nafion|Pt–Cu reactor was fabricated to evaluate the NRR activities in the presence of NaCl and Na2SO4 electrolytes.
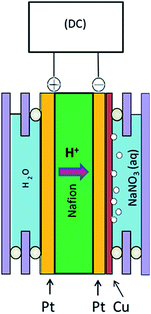 |
| | Fig. 1 Schematic diagram of the electrolysis reactor. | |
Experimental
In order to prepare a membrane–electrode assembly (MEA), platinum was first chemically deposited from H2PtCl6 on a Nafion-117 membrane (Wako Incorp. Japan) by using a reduction mixture of sodium borohydride and sodium hydroxide. At first, a slice of Nafion membrane (2 cm × 3 cm) was sand-blasted and dried at 110 °C; then it was merged into 200 ml of a 7.5 mM H2PtCl6 solution. Next, a mixed solution of 2.0 M NaBH4 and 4.0 M NaOH was added to the membrane-containing system at a rate of 2.0 ml h−1. At the same time, the reaction mixture was heated from 35 °C at a rate of 5 °C h−1 up to 70 °C. The Pt plating on both sides of the Nafion membrane was completed within 12 hours. The total geometric area of each surface was 6 cm2, where the resistivity of the plated surfaces was less than 10 Ω cm−1. The as-prepared assemblies were first washed with dilute HCl, ultrasonically vibrated for 30 s to remove adhered NaBH4 and NaOH from the surface, and finally dried at 110 °C in air. The as-prepared MEAs were then installed in a self-assembled rigid acrylate frame to fabricate the reactor as shown in Fig. 1, where the cathode surface is separated from the anode surface by the H+ conducting Nafion membrane. To perform electrolysis, the cathode and the anode chambers were filled with 8 ml aqueous solution of NaNO3 and water, respectively, which was previously connected with a DC supplier.
In order to analyze the changes in concentration of NO3−, NO2− and NH4+ with time, a 20 μl portion was collected from the solution in the cathode compartment at a constant interval and diluted to 5 ml. The concentration changes of NO3−, NO2− and NH4+ were measured by an ICA-2000 model (DKK-TOA Corporation) ion chromatograph. In order to estimate catalytic performance, the rate constant (k) was evaluated on the assumption that the concentration of NO3− (C) decreases following first-order kinetics, i.e., C = C0![[thin space (1/6-em)]](https://www.rsc.org/images/entities/char_2009.gif) exp(−k1t), where C0 is the initial concentration and t is time (min).
exp(−k1t), where C0 is the initial concentration and t is time (min).
The electrochemical investigations were carried out under thermostatic and N2-atmosphere condition using an Autolab PGSTAT128N instrument (Metrohm Autolab B.V.). All potentials in the present work are reported with respect to Ag|AgCl (sat. KCl) reference electrode. In order to prepare the Pt–Cu catalytic surface, a Pt disk (ϕ = 2 mm) was placed in a 0.01 M CuSO4 solution, then the potential was cycled six times between 0 and 1.0 V at a scan rate of 100 mV s−1. This yielded the electrodeposition of Cu overlayers on the Pt disk. Prior to use in NRR experiments, the as-prepared electrode was washed thoroughly with water, and the potential was swept repeatedly between 0 and 1.5 V in a 0.05 M KCl solution until stable cyclic voltammograms were obtained. In order to record CVs, the system was kept at a rest potential of −0.1 V for 30 s, then the potential scanning of nitrate-containing solution was performed between 0 and −1.4 V at various scan rates. A similar electrochemical setup was also used for EIS studies. The surface morphology was analysed by energy dispersive X-ray analysis (EDS) coupled with FESEM (JEOL, Japan). The FTIR spectra of the Nafion membranes were recorded on potassium bromide (KBr) pellets with a SHIMADZU IR spectrometer (model no-dxp 400). First, a Nafion membrane sheet was sand-blasted, washed several times with distilled water, dried and chipped into three pieces. The one dried piece of Nafion membrane was placed into 0.1 M NaCl solution, and another piece in 0.1 M Na2SO4 solution, for 60 min. The soaked Nafion membranes were washed with distilled water and dried in an oven at 40 °C. To record the FTIR spectra, the dried Nafion membrane was chipped as small as possible and then ground with KBr to form pellets. The X-ray photoelectron spectra (XPS) study was performed using the Kratos Axis-Ultra DLD spectrometer, with Al Kα radiation source (1486.6 eV). Energy calibration and component separation were carried out with the bundled software using pure Gaussian profiles with a linear background.
Results and discussion
Electrolysis
In order to investigate the responses of chloride and sulphate ions on the NRR activity of the sandwich-type membrane reactor (Pt|Nafion|Pt–Cu; shown in Fig. 1), 180 min-long electrolysis experiments were performed.
Fig. 2 shows that electrolysis data were well-matched with respect to the first-order rate equation (r2 ≥ 0.99), whereas Table 1 summarizes the corresponding analytical data. In the absence of any supporting electrolytes, nitrate ions reduced with a rate constant (k1) of 42.8 × 10⁻³ min−1. However, in the presence of 0.01 M NaCl and 0.01 M Na2SO4 electrolytes, k1 decreased to 40.6 × 10⁻³ min−1 and 35.3 × 10⁻³ min−1, respectively. This observation suggests that the catalytic assembly exhibited its highest efficiency when a pure nitrate-containing solution was electrolyzed alone. The presence of chloride or sulphate ions adversely affected the performance of the catalytic surface, and between these two spectator anions; sulphate ions caused inferior performance compared to chloride ions. In the sandwich-type reactor, water molecules are oxidized on the anode surface, producing molecular oxygen and protons. Under the applied potential, protons migrate towards the cathode surface through the conducting Nafion membrane. These protons are next reduced at the cathode surface to form adsorbed hydrogen atoms and/or molecules as per the following mechanism.24
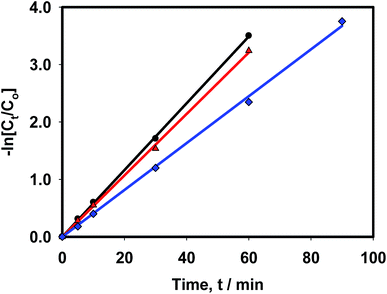 |
| | Fig. 2 Linear fittings of first-order kinetic equation with respect to 0.05 M NaNO3 reduction reaction in the presence of (●) water only, (▲) 0.01 M NaCl and (■) 0.01 M Na2SO4. [DC input 100 mA, catholyte 8 ml, 300 K]. | |
Table 1 Effects of supporting electrolytes on 0.05 NaNO3 reductiona
| Parameter |
AE |
NaCl |
Na2SO4 |
| 100 mA, 300 K, 180 min, cathode: 18 atom% Cu + 82 atom% Pt, 0.01 M NaCl/Na2SO4, AE: absence of supporting electrolytes. |
| k1/10−3 min−1 |
42.8 |
40.6 |
35.3 |
| NO3− removal/% |
100 |
100 |
100 |
| S (NO2−)/% |
45.0 |
21.0 |
11.6 |
| S (NH4+)/% |
4.2 |
7.0 |
8.5 |
Anode (Pt):
| |
 | (1) |
| | |
H+ (anode) → H+ (cathode) (migration)
| (2) |
Cathode (Pt–Cu):
| | |
2H+ + 2e− → 2Hads →H2,ads
| (3) |
The adsorbed hydrogen atoms participate in the catalytic hydrogenation reactions (shown in Scheme 1) to reduce nitrate ions.8 Because of circuit requirement reasons and the catalytic ability of adsorbed hydrogen atoms, H+ conductivity of Nafion (reaction (2)) determines the catalytic performance of the reactor. Thus, in order to elucidate the catalytic dissimilarities in the presence of chloride and sulphate ions, electrochemical and spectroscopic studies were performed as described below.
 |
| | Scheme 1 Catalytic hydrogenation reactions of nitrate ions on the Pt–Cu surface. | |
EIS studies
Electrochemical impedance spectroscopy (EIS) is a powerful tool to elucidate the efficiency of various diffusionless processes like binding of the electroactive species, electron transfer reactions at the surface, H+ conductivity through a medium, and different interfacial processes (e.g. analyte adsorption, oxide formation etc.).39–42 Since NRR also occurs due to heterogeneous electron transfer reactions, the comparative binding of the catalyst (Pt–Cu) with the specific reactant (NO3−) in the presence of supporting electrolytes was studied using a three-electrode system. The EIS spectra are classically presented in the form of a complex plane plot, where Z′ is the real and Z′′ is the imaginary part of impedance, as shown in Fig. 3, which was obtained in the presence of 0.1 M supporting electrolytes (NaCl and Na2SO4). For an ideal non-polarizable system, the circuit comprises a series connection of solution resistance (Rs) with a parallel combination of a charge transfer resistance (Rct) and a double layer capacitance (Cd). The impedance of such a system may be written as:41| | |
Z(ω) = ZRs(ω) + Zpl(ω)
| (4) |
where ZRs(ω) and Zpl(ω) represent the impedance of solution resistance (Rs) and the parallel combination of double-layer capacitance (Cd) and charge transfer resistance (Rct). Eqn (4) is often rewritten in terms of reactance as42| |
 | (5) |
Here, the first and second parentheses represent the real and the imaginary parts, respectively, of the impedance. As can be seen from the complex plan plots (see Fig. 3a), both in the chloride and sulphate media, the impedance of the system exhibited semicircles at −1.2 V, which is typical for a kinetically controlled process. At 100 kHz, the capacitive impedance was short-circuited, which practically diminished the Rct. As a consequence, only Rs remained at the high-frequency intercept.
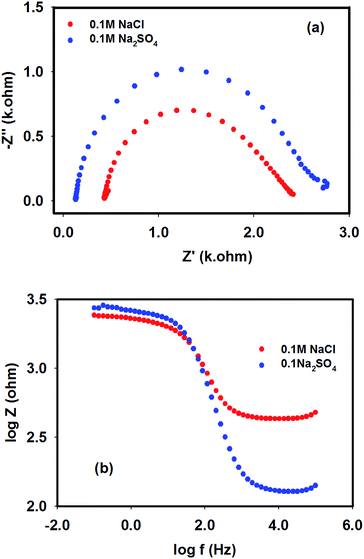 |
| | Fig. 3 EIS spectra recorded with Pt–Cu electrode in the presence of NaCl and Na2SO4 supporting electrolytes (0.1 M in each case) at −1.2 V. (a) Complex plan plot and (b) Bode plot. | |
Meanwhile, the low-frequency intercept represents the sum of Rs and Rct. Therefore, the diameter of the semicircle represents Rct.40 It can be noticed from eqn (5) and Fig. 3a that the maximum of Z′′ occurred at Z′ = Rs + Rct/2, which denotes the specific frequency of the charge transfer process (ωmax). It can be seen from Fig. 3b that the Bode magnitude of the system provided two breakpoints: starting from the high-frequency edge, the first breakpoint corresponds to the time constant τ1:
| |
 | (6) |
and the second breakpoint represents time constant
τ2:
42| |
 | (7) |
It is notable that as the chloride and sulphate ions are non-reducible species at the working potential, the diameter of the complex plane plots (hence Rct) should measure the resistance due to dissolution of Cu(II) and/or Cu(I) species on the Pt–Cu surface. Considering these facts, different EIS properties are tabulated in Table 2. According to the tabulated data, it is clear that the Pt–Cu surface was more resistive and less capacitive in the sulphate medium compared to the chloride medium.
Table 2 EIS properties of Pt–Cu surface in the presence of chloride and sulphate ions measured at −1.2 V
| Medium |
Rs/ohm |
Rct/ohm |
Cdl/μF cm−2 |
| 0.1 M NaCl |
427 |
1990 |
25.57 |
| 0.1 M Na2SO4 |
125 |
2601 |
19.11 |
By taking advantage of the EIS information, the impedance spectra of 0.015 M NaNO3 were next recorded in the presence of supporting 0.1 M electrolytes as shown in Fig. 4. At the working potential of −1.0 V, the complex plan plots provided arcs (with the diameter associated to the charge transfer resistance, Rct, originated due to reduction of the NO3− ions at the interface of the electrode), followed by a diagonal straight line. Thus, in this case, kinetic control process coupled with the mass transfer process, where the simplified Randles circuit was modified by introducing Warburg impedance (W), as shown in the inset of Fig. 4, to model the mixed-control process. As expected, a larger semi-circular diameter (hence larger Rct value) is seen in the presence of sulphate ions compared with that of chloride ions. This observation suggests that the increased surface coverage of sulphate ions on the Pt–Cu surface, due to either specific or nonspecific adsorption, exposed a lower number of sites for the nitrate reduction reactions. Consequently, the evaluation of Rct and Cdl suggests that in comparison with chloride ions, sulphate ions impeded the Pt–Cu surface more prominently in the reduction of nitrate ions.
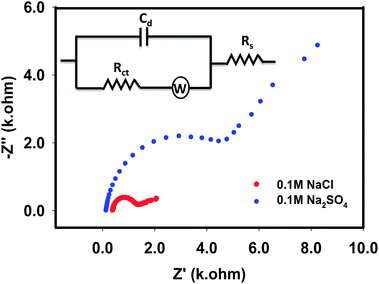 |
| | Fig. 4 EIS spectra recorded with Pt–Cu electrode for 0.015 M NaNO3 in the presence of 0.1 M NaCl and 0.1 M Na2SO4 at −1.0 V. Inset shows equivalent circuit. | |
However, in the reactor (Fig. 1), the conducting membrane (solid electrolyte) acts as an electrolytic junction between the anode and cathode, where the protons are the charge carriers. In order to illustrate the functions of supporting electrolytes on H+ conducting parameters (hence reactivity) of the Pt|Nafion|Pt–Cu assembly, EIS spectra were finally recorded in the presence and absence of supporting electrolytes by installing this catalytic assembly in the reactor shown in Fig. 1. The cell impedance was measured at various frequencies ranging from 100 kHz to 0.001 Hz, applying an AC excitation voltage of −0.8 V. For this particular membrane assembly, the electrical equivalent circuit (shown in the inset of Fig. 5) represents electron transfer, charging of the double layer and migration of H+ through the membrane. The real component of the EIS spectra at 100 kHz was credited almost exclusively to the resistance of the membrane (Rm), which may be used to calculate proton conductivity of the membrane. The active area of the membrane was 3 cm2, and its thickness was 118.75 μm (determined from the SEM image of the cross-section of the Nafion membrane, Fig. 6). Using these data, the specific H+ conductivity (CH+) due to reaction (2) through the membrane in the presence of pure water was evaluated as 0.027 S cm−1. However, when water was replaced with 0.01 M NaCl and 0.01 M Na2SO4 solution, in separate experiments, CH+ decreased to 0.016 S cm−1 and 0.015 S cm−1, respectively. This means that H+ conductivity of Nafion membrane was greatly interrupted in the presence of supporting electrolytes. It is notable that the semi-circular arc, which appeared in the frequency range 10 Hz to 10 kHz, was attributed to the charging of the electrode–solution interface (Cdl). The charge transfer resistance (Rct) was associated to the reduction of H+ (given by reaction (3)) at the edge of the lower-frequency region. It is clear from Fig. 5 that the shapes of the semi-circular arcs, hence Cdl and Rct, were highly penetrated by the supporting electrolytes. The least Rct was noticed when no supporting electrolyte was present in the system, and it increased following the order of pure water < NaCl < Na2SO4. This observation is consistent with the performance of the electrolysis data reported in Table 1 and i.e., NRR rate was inhibited in the membrane reactor in the presence of chloride and sulphate ions following a reverse trend of Rct increase.
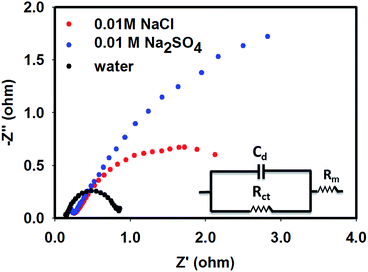 |
| | Fig. 5 EIS spectra of the Pt|Nafion|Pt–Cu system recorded in the presence and absence of 0.01 M supporting electrolytes (NaCl and Na2SO4) at a working potential of −0.8 V. Inset shows the associated equivalent circuit. | |
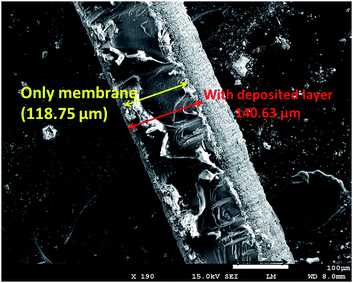 |
| | Fig. 6 SEM image of the cross-section of Pt|Nafion|Pt assembly. | |
Voltammetry
Fig. 7 shows CVs of nitrate (Fig. 7a) and nitrite (Fig. 7b) reduction reactions with corresponding voltammetric responses of supporting electrolytes (Fig. 7c) recorded with an Pt–Cu electrode. Nitrate ions are reduced on a catalytic surface using a consecutive reaction trail (NO3− → NO2− → NH3), where nitrite ions evolve as intermediates. It can be seen from Table 1 that electrolysis of a pure nitrate solution yielded the highest nitrite selectivity (45%), which decreased to 21% and 11.6% in the presence of chloride and sulphate ions, respectively. This observation suggests that supporting electrolytes can promote reduction of intermediate nitrite ions, where SO42− ions had stronger influence over the Cl− ions in minimizing the concentration of intermediate nitrite ions. To elucidate this phenomenon, voltammetric experiments were performed. Fig. 7a shows the CVs of 0.015 M NaNO3 solution recorded using a Pt–Cu electrode at a scan rate of 50 mV s−1 in the presence of 0.1 M NaCl and 0.1 M Na2SO4 electrolytes. In the double-layer region, the waves E1 and E2 are associated to the reduction of Cu(I) and Cu(II) species, respectively. Meanwhile, the E5 and E6 correspond to the oxidation of Cu(0) to Cu(II) and Cu(I), respectively. From the CVs, it is clearly seen that oxidation–reduction currents (hence the total charge) of the copper species were more intense in the presence of sulphate ions than in the presence of chloride ions. Such difference suggests that under the sulphate environment, more Cu(II)/Cu(I) species were generated than in the chloride environment, which is consistent with the EIS studies. However, in the kinetic region, the E3 and E4 waves denote the reduction of nitrate and nitrite ions, respectively, as per the following reactions.24| | |
at (E3): NO3ads− + H2Oads + 2e− → NO2ads− + 2OHads−
| (8) |
| | |
at (E4): NO2ads− + 5H2Oads + 6e− → NH3ads + 7OHads−
| (9) |
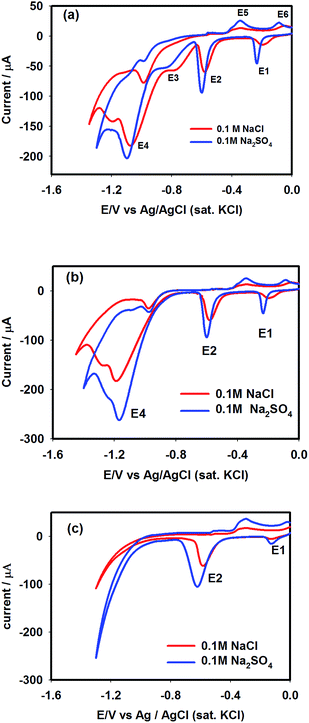 |
| | Fig. 7 Cyclic voltammograms of 0.015 M NaNO3 (a) and 0.015 M NaNO2 (b) recorded with the Pt–Cu electrode at a scan rate of 50 mV s−1 using NaCl and Na2SO4 supporting electrolytes. (c) represents CVs of supporting electrolytes (NaCl and Na2SO4). | |
The E3 wave generated more current in the presence of chloride ions than in the presence of sulphate ions, implying that reaction (8) was relatively favoured in the chloride medium. But the opposite effect is seen in the case of the E4 wave, i.e., nitrite reduction current (reaction (9)) in the sulphate medium suppressed that generated in the chloride medium. As a consequence, the least nitrite selectivity was noticed during the electrolysis experiments in the sulphate medium, as reported in Table 1. In order to justify these results, CVs of NO2− ions were next recorded in the presence of chloride and sulphate ions, as shown in Fig. 7b. The CV profiles of nitrite ions notably matched with those observed for the reduction of nitrate ions.
Surface morphology
In this present study, the catalytic surface contained 18 atom% Cu and 82 atom% Pt, which was confirmed by the energy-dispersive X-ray analysis (Fig. 8a). The SEM image of the Pt–Cu surface shows that the catalytic particles existed as an aggregated network of 61–132 nm in size (Fig. 8b).
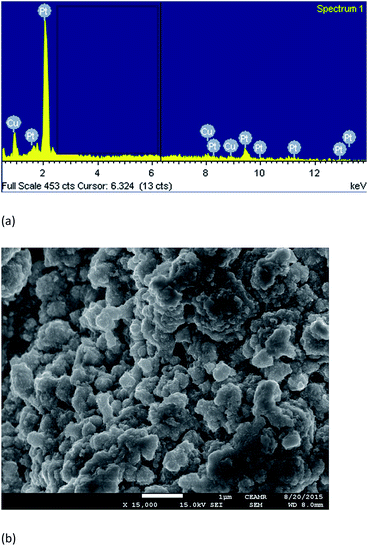 |
| | Fig. 8 Surface morphology of Pt–Cu surface; (a) EDS spectra and (b) SEM image. | |
FTIR study
In order to assess the reasons for decreased H+ conductivity and increased charge transfer resistance (Rct) in the presence of supporting electrolytes at the cathode surface of the reactor shown in Fig. 1, FTIR analysis of Nafion membrane was performed. Fig. 9 shows the FTIR spectra of Nafion membranes recorded before and after soaking in 0.1 M sulphate and chloride solutions. Since the Nafion membrane is proton-conducting by nature, it was assumed that cations (Na+) might be entrapped by the Nafion membrane, which might induce nonspecific adsorption of counter-anions. The IR spectrum of the Nafion membrane shows the characteristic vibrations of Nafion at 1220 cm−1 (asymmetric C–F stretching). The peaks at 1156 cm−1 are assumed for symmetric C–F stretching. The peaks at 1057 cm−1 are attributed for S–O stretching. The C–F stretching of (–CF2–CF(R)–CF2–) groups shows the vibrations at 982 cm−1. The other characteristic peaks of Nafion were found at 970 cm−1 (C–O–C stretching), 653 cm−1 (asymmetric O–S–O bending), 636 cm−1 (C–S stretching), 554 cm−1 (asymmetric C–F bending), and 512 cm−1 (symmetric O–S–O bending) according to a previous report.43 However, none of these bands were penetrated by the chloride or sulphate ions. This observation suggests that nonspecific adsorption of chloride or sulphate ions by the Nafion membrane did not play any role in deciding the reactor's performance. It was rather assumed that sulphate and chloride ions were adsorbed by the Pt–Cu layers deposited on the Nafion membrane, which probably blocked the H+ reducing sites and decreased the reactor's performance accordingly.
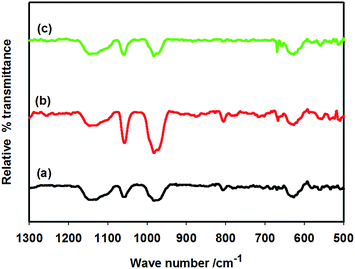 |
| | Fig. 9 FTIR spectra of pure Nafion (a), 0.1 M NaCl-soaked Nafion (b), and 0.1 M Na2SO4-soaked Nafion (c). | |
XPS study
The adsorption characteristics of chloride and sulphate ions on the Pt–Cu surface were investigated with X-ray photoelectron spectroscopy (XPS) analysis. The Cu 2p3/2 core energy level was employed to study the oxidation state of the Cu surface. The linear background subtraction and Gaussian peak fitting of the broad Cu 2p3/2 XPS spectra presents a major peak at ∼932.2 eV and a relatively small peak at 934.8 eV (see Fig. 10a and b). The major peak has been attributed to Cu(0) and/or Cu(I).
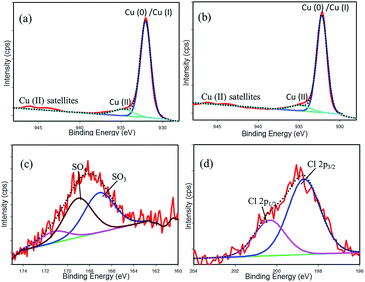 |
| | Fig. 10 (Top) XPS fine-scan spectra for Cu 2p3/2 of the Cu-modified Pt sample. (a) Cu surface dipped in sulphate solution, (b) Cu surface dipped in chloride solution, (c) S 2p, (d) Cl 2p. | |
However, Cu(0)/Cu(I) could not be determined directly by the deconvolution because of their very similar binding energies.44 These peaks can be distinguished by LMM-2 auger transition in the XPS spectra, which are 568 eV and 570 eV for Cu(0) and Cu(I), respectively.45 In this specimen, we observed this peak at 567 eV in both chloride and sulphate ion adsorption cases. From this fact, we considered that this major peak is attributed to Cu(0). However, this peak is in a slightly lower binding energy in comparison with pure metallic copper (932.6 eV).46 This discrepancy may arise due to the interaction of Cu with Pt (figure not shown). The peak at 934.8 eV with board FWHM value (2.8 eV) has been attributed to the existence of Cu(II). The broadened peak shape of Cu(II) as compared to the major one (Cu(0)/Cu(I)) is due to coupling between unpaired electron (d9) (multiple splitting) in the paramagnetic cupric ions.47,48 Moreover, the shake-up satellite structure centered at a binding energy of 943 eV also denotes the presence of Cu(II) species. This satellite peak can only be ascribed to the charge transfer transition to unfilled d-orbital of the Cu atom. In the case of Cu(0)/Cu(I), there is a filled (d10) ground state configuration. In this case, no charge transfer is possible, and no satellite peak can be observed.48,49 Binding energy, FWHM and Cu(II)/Cu(0) ratio obtained from deconvolution of the Cu 2p3/2 peak is presented in Table 3. Fig. 10c and d shows the XPS fine-scan spectra of S 2p and Cl 2p. From the tabulated results, it is seen that 11.25% of Cu(II) was formed on the sulphate-treated Pt–Cu surface, and this quantity was decreased to 9.62% when the surface was treated in the chloride medium. This may happen due to strong interactions of SO42− ions with Cu species of the Pt–Cu electrode rather than chloride ions under identical reaction conditions. This observation is consistent with CV and EIS results. In Fig. 10c, two intense S 2p features are seen to appear at 167.1 eV and 169.0 eV, indicating the attribution of SO3 and SO4 species, respectively.50 The remaining small peak at higher binding energy (171.2 eV) may be attributed to charging of sulphur. In the case of Cl 2p deconvolution, the two peaks at 198.7 eV and 200.3 eV represent the binding energies of Cl 2p3/2 and Cl 2p1/2, respectively. Thus, it is clear that the Pt–Cu layers adsorbed chloride and sulphate ions firmly, and this adsorption blocked the H+ reducing sites at the cathode end of the catalytic assembly shown in Fig. 1. This study also confirms that formation of Cu(II) from Cu(0) was favoured by the more prominent adsorption of sulphate ions than that of chloride ions. The existence of more Cu(0) species favoured the NO3− reduction, but the existence of slightly increased amounts of Cu(II) and/or Cu(I) favoured the reduction of NO2− ions.
Table 3 The XPS data of Cu 2p3/2 peak in the presence of NaCl and Na2SO4a
| Binding energy of Cu 2p3/2 (eV) |
FWHM of Cu 2p3/2 (eV) |
% Cu(II) |
| Medium |
Cu(0)/Cu(I) |
Cu(II) |
Cu(0)/Cu(I) |
Cu(II) |
| % Cu(II) was obtained from deconvolution of Cu 2p3/2 peaks. |
| SO42− |
932.1 |
934.8 |
1.5 |
2.8 |
11.25 |
| Cl− |
932.2 |
934.8 |
1.5 |
2.8 |
9.62 |
Surface stability
Finally, the stability of the Pt–Cu surface in the presence of electrolytes was evaluated by measuring the corrosion rate. Fig. 11 shows the polarization curves of the Pt–Cu surface in the form of Tafel plots. The corrosion potential (Ecorr) in the presence of chloride ions was −0.09 V. Meanwhile, this value shifted to −0.03 V in the presence of sulphate ions. From the slopes of V-shaped curves, the corrosion rate of Cu species was determined to be 5.5 × 10⁻⁴ and 14.0 × 10⁻⁴ mm per year in the presence of chloride and sulphate ions, respectively. This observation suggests that chloride ions were less aggressive than sulphate ions in destabilizing the surface. This is because chloride ions generated less Cu(I)/Cu(II) species than did the sulphate ions.
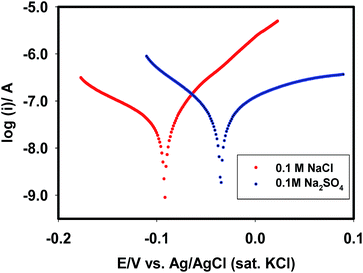 |
| | Fig. 11 Polarization curves of Pt–Cu surface in the presence of NaCl and Na2SO4. | |
Summary
A sandwich-type reactor assembly (Pt|Nafion|Pt–Cu) can show the best reduction efficiency when no supporting electrolytes are present in the reactor. The anions (chloride and sulphate ions) have no interactions with the electrolytic junction (Nafion membrane); rather they are adsorbed on the Pt–Cu surface. In comparison, the presence of sulphate ions attributed greater charge transfer resistance, generated more Cu(II) species, induced more corrosion of catalytic particles and attained less NRR rate than those exhibited in the presence of chloride ions. Since Cl− and SO42− ions can deactivate catalytic performance, the reactor may not be suitable (in the presence of these anions) for operation from the view of reproducible performance. However, in terms of long-term use, the concentration of these anions might be minimized, possibly by separating them using other techniques (such as precipitation, etc.). Conversely, a notable point is that a sulphate-adsorbed Pt–Cu surface could reduce nitrite ions more efficiently than a chloride-adsorbed surface.
Acknowledgements
The authors acknowledge Prof. Masato Machida, Department of Nano Science and Technology, Kumamoto University, Japan, for providing required materials. The World Academy of Sciences (TWAS) is acknowledged greatly for financial support (Ref: 14-050 RG/CHE/AS_G; UNESCO FR 34028605) to Mohammad A. Hasnat. Shahjalal University of Science and Technology research center is acknowledged for partial financial support.
Notes and references
- N. F. Gray, Drinking Water Quality: Problems and Solutions, Wiley and Sons Ltd, Chichester, 1994, p. 21 Search PubMed.
- A. Pintar, J. Batista and J. Levec, Chem. Eng. Sci., 2001, 56, 1551 CrossRef CAS.
- A. E. Tugtas and S. G. Pavlostathis, Biotechnol. Bioeng., 2007, 97, 1448 CrossRef CAS PubMed.
- A. Pintar, J. Batista and J. Levec, Water Sci. Technol., 1998, 37, 177 CrossRef CAS.
- S. Horod, K. D. Vorlop, T. Tacke and M. Sell, Catal. Today, 1993, 17, 21 CrossRef.
- F. Epron, F. Gauthard, C. Pineda and J. Barbier, J. Catal., 2001, 198, 309 CrossRef CAS.
- F. Gauthard, F. Epron and J. Barbier, J. Catal., 2003, 220, 182 CrossRef CAS.
- N. Barrabés, J. Just, A. Dafinov, F. Medina, J. L. G. Fierro, J. E. Sueiras, P. Salagre and Y. Cesteros, Appl. Catal., B, 2006, 62, 77 CrossRef.
- S. Kerkeni, E. Lamy-Pitara and J. Barbier, Catal. Today, 2002, 75, 35 CrossRef CAS.
- W. Siriwatcharapiboon, Y. Kwon, J. Yang, R. L. Chantry, Z. Li, S. L. Horswell and M. T. M. Koper, ChemElectroChem, 2014, 1, 172 CrossRef.
- M. Duca, M. O. Cucarella, P. Rodriguez and M. T. M. Koper, J. Am. Chem. Soc., 2010, 132, 18042 CrossRef CAS PubMed.
- M. A. Hasnat, N. Ahamad, S. M. Nizam Uddin and N. Mohamed, Appl. Surf. Sci., 2012, 258, 3309 CrossRef CAS.
- J. F. van der Plas and E. Barendrecht, Electrochim. Acta, 1979, 25, 1463 CrossRef.
- M. S. Alam, M. A. Hasnat, M. A. Rashed, M. R. Miah and I. S. M. Saiful, Electrochim. Acta, 2012, 76, 102 CrossRef CAS.
- G. E. Dima, A. C. A. de Vooys and M. T. M. Koper, J. Electroanal. Chem., 2003, 15, 554 Search PubMed.
- Y. Wang, Y. Sakamoto and Y. Kamiya, Appl. Catal., A, 2009, 361, 123 CrossRef CAS.
- M. A. Hasnat, M. A. Islam and M. A. Rashed, RSC Adv., 2015, 5, 9912 RSC.
- H. Cheng, K. Schot and P. A. Chiristensen, J. Appl. Electrochem., 2005, 35, 551 CrossRef CAS.
- D. Reyter, G. Chamoulaud, D. Belanger and L. Roue, J. Electroanal. Chem., 2006, 596, 13 CrossRef CAS.
- I. Katsounaros, D. Ipsakis, C. Polatides and G. Kyriacou, Electrochim. Acta, 2006, 52, 1329 CrossRef CAS.
- M. A. Hasnat, M. A. Islam, S. M. Borhanuddin, M. R. U. Chowdhury and M. Machida, J. Mol. Catal. A: Chem., 2010, 317, 61 CrossRef CAS.
- M. A. Hasnat, M. S. Alam, M. H. M.-U. Karim, M. A. Rashed and M. Machida, Appl. Catal., B, 2011, 107, 294 CrossRef CAS.
- M. A. Hasnat, M. A. Rashed, S. Ben Aoun, S. M. Nizam Uddin, M. Saiful Alam, S. Amertharaj, R. K. Majumder and N. Mohamed, J. Mol. Catal. A: Chem., 2014, 243, 383 Search PubMed.
- M. A. Hasnat, S. Ben Aoun, S. M. Nizam Uddin, M. Mahbubul Alam, P. P. Koay, S. Amertharaj, M. A. Rashed, M. M. Rahman and N. Mohamed, Appl. Catal., A, 2014, 478, 259 CrossRef CAS.
- M. A. Hasnat, I. Ishibashi, K. Sato, R. Agui, T. Yamaguchi, K. IKeue and M. Machida, Bull. Chem. Soc. Jpn., 2008, 12, 1 Search PubMed.
- M. Machida, K. Sato, I. Ishibashi, M. A. Hasnat and K. Ikeue, Chem. Commun., 2006, 7, 732 RSC.
- M. A. Hasnat, M. R. Karim and M. Machida, Catal. Commun., 2009, 10, 1975 CrossRef CAS.
- M. da Chunha, J. P. I. De Souza and F. C. Nart, Langmuir, 2000, 16, 771 CrossRef.
- S. Amertharaj, M. A. Hasnat and N. Mohamed, Electrochim. Acta, 2014, 136, 557 CrossRef CAS.
- D. Reyter, D. Belanger and L. Roue, Electrochim. Acta, 2008, 53, 5977 CrossRef CAS.
- A. Anastasopoulos, L. Hannah and B. E. Hayden, J. Catal., 2013, 305, 27 CrossRef CAS.
- Y. Y. Birdja, J. Yang and M. T. M. Koper, Electrochim. Acta, 2014, 140, 518 CrossRef CAS.
- Z. Ogumi, S. Ohashi and Z. Takehara, Electrochim. Acta, 1985, 30, 121 CrossRef CAS.
- Z. Ogumi, H. Yamashita, K. Nishio, Z. I. Takehara and S. Yoshizawa, Electrochim. Acta, 1983, 28, 1687 CrossRef CAS.
- K. Otuska and I. Yamanaka, Appl. Catal., 1986, 26, 401 CrossRef.
- G. R. Dieckmann and S. H. Langer, J. Appl. Electrochem., 1997, 27, 1 CrossRef CAS.
- G. R. Dieckmann and S. H. Langer, Electrochim. Acta, 1998, 44, 437 CrossRef CAS.
- R. K. Majumder, M. A. Hasnat, S. Hossain, K. Ikeue and M. Machida, J. Hazard. Mater., 2008, 159, 536 CrossRef CAS PubMed.
- J. R. Macdonald, Impedance spectroscopy, Ann. Biomed. Eng., 1992, 20, 289 CrossRef CAS PubMed.
- A. Bogomolova, E. Komarova, K. Reber, T. Gerasimov, O. Yavuz, S. Bhatt and M. Aldissi, Anal. Chem., 2009, 81, 3944 CrossRef CAS PubMed.
- L. R. F. Allen and J. Bard, Electrochemical Methods: Fundamentals and Applications, Wiley, 2nd edn, 2000 Search PubMed.
- B. A. Lasia, Electrochemical impedance spectroscopy and it's applications, in Modern Aspects of Electrochemistry, ed. B. E. Conway, J. O. M. Bockris and R. White, Springer, New York, NY, USA, 2002, pp. 143–248 Search PubMed.
- M. Laporta, M. Pegoraro and L. Zanderighi, Phys. Chem. Chem. Phys., 1999, 1, 4619 RSC.
- T. Ghodselahi, M. A. Vesaghi, A. Shafiekhani, A. Baghizadeh and M. Lameii, Appl. Surf. Sci., 2008, 255, 2730 CrossRef CAS.
- J. Y. Park, J. Y. S. Jung and W. K. Cho, Appl. Surf. Sci., 2006, 252, 2877 Search PubMed.
- V. Hayez, A. Franquet, A. Hubin and H. Terryn, Surf. Interface Anal., 2004, 36, 876 CrossRef CAS.
- A. Rosencwaig and G. K. Wertheim, J. Electron Spectrosc. Relat. Phenom., 1972/1973, 1, 493 Search PubMed.
- K. S. Kim, J. Electron Spectrosc. Relat. Phenom., 1974, 3, 217 CrossRef CAS.
- J. Ghijsen, L. H. Tjeng, J. van Elp, H. Exkes, J. Westerink, G. A. Sawatzky and M. T. Czyzyk, Phys. Rev. B: Condens. Matter Mater. Phys., 1988, 38, 11322 CrossRef CAS.
- J. A. Rodriguez, T. Jirsak, A. Freitag, J. C. Hanson, J. Z. Larese and S. Chaturvedi, Catal. Lett., 1999, 62, 113 CrossRef CAS.
|
| This journal is © The Royal Society of Chemistry 2016 |
Click here to see how this site uses Cookies. View our privacy policy here. ![[thin space (1/6-em)]](https://www.rsc.org/images/entities/char_2009.gif) exp(−k1t), where C0 is the initial concentration and t is time (min).
exp(−k1t), where C0 is the initial concentration and t is time (min).


