Qualitative analysis of chiral alanine by UV-visible-shortwave near infrared diffuse reflectance spectroscopy combined with chemometrics

Xiangling Li, Kailin Xu, Hui Li, Shun Yao, Yanfang Li and Bing Liang*
School of Chem. Eng., Sichuan Univ., Chengdu 610065, P. R. China. E-mail: lianngbing@sina.com; Fax: +86-028-85405221

Received 27th October 2015 , Accepted 6th January 2016

First published on 12th January 2016


Abstract

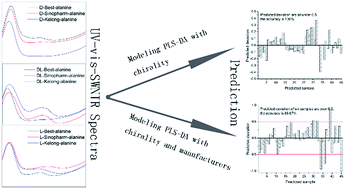
UV-visible-shortwave near infrared diffuse reflectance spectroscopy (UV-vis-SWNIR DRS) combined with chemometrics is investigated for the first time to discriminate enantiomers and their racemic compounds, using D-, L- and DL-alanine as model compounds. After optimizing the measuring conditions of powder particle sizes and the distance between fiber probe and sample, discriminant partial least squares (PLS-DA) models were built with UV-vis-SWNIR DRS to implement the qualitative analysis of alanine chirality. As a result, under the optimized conditions of particle size sifted through 100-mesh and a distance of 5.3 mm, an excellent discrimination of chirality with an accuracy of 100% was obtained, which is better than that of manufacturers with an accuracy of 86.67%. The results of this study infer that UV-vis-SWNIR DRS combined with chemometrics can be a rapid, simple and noninvasive method for chiral analysis.

1 Introduction

Separation and analysis of enantiomers are continuously active areas in chiral research, as individual enantiomers and racemates of chiral compounds have significant differences in pharmacological activity, pharmacokinetic characteristics and toxicological properties. It is hardly surprising that with the increasing production of chiral drugs, the pharmaceutical industry needs some more effective and rapid chiral analytical methods for drug quality control. Methods generally used to determine enantiomers are based on either separation or spectroscopic techniques. While separation-based methods, such as chromatography1,2 and capillary electrophoresis,3–5 which often need complex sample pretreatment, are time-consuming and expensive. Circular dichroism as a spectrophotometry, NMR as a spectroscopy and MS as a spectrometry are also commonly used. However, circular dichroism is less sensitive6 and often performed in solution.7,8 NMR9 and MS10,11 require the addition of chiral reagents, besides they are both expensive and the latter is destructive. As for spectroscopic methods, such as UV-visible spectroscopy,12–14 UV spectroscopy,15–19 fluorescence spectroscopy,20–22 resonance Rayleigh scattering spectroscopy23 and near-infrared spectroscopy,6,24 guest–host complexes are formed in solution which results in a spectral shift between enantiomers consequently allowing chiral analysis. However, guest–host complexation in solution not only makes the analytical procedure complicated but also more costly.

On the other hand, diffuse reflectance infrared Fourier transform spectroscopy (DRIFT)25,26 and terahertz time domain spectroscopy (THz-TDS)27–29 methods were reported for analysis of enantiomers in solid powder, but they demand to mix samples with KBr and magnesium oxide, respectively. The THz-TDS27–29 also has some other shortcomings: relatively weak absorption intensities compared to those of mid-infrared spectra and UV-visible spectra and the interference from the strong absorption of water.27

Therefore, developing a simple-preprocessing, rapid and inexpensive chiral analytical technique is significant. UV-visible-shortwave near infrared diffuse reflectance spectroscopy, one of the spectral analysis techniques based on the measurement of the output light loading information of the structure and composition of sample through multiple interactions of incident light with internal molecules, has been used for studying the surface structures of molecules dispersed vanadium oxide on various supports,30 for determining the composition of mineral-organic mixes,31 for the detection of p-aminophenol,32 for the qualitative and simultaneous quantitative analysis of cimetidine polymorphs.33 Above all of these imply that UV-vis-SWNIR DRS can be expected to be a nondestructive chiral analytical technique.

In our preliminary study, it was found that the UV-vis-SWNIR diffuse reflectance spectra showed a significant difference among L-alanine, D-alanine and DL-alanine. Moreover, according to literature survey, there is still no report on the study of UV-vis-SWNIR DRS for chiral analysis. Therefore, the aim of our study is to investigate the feasibility of applying UV-vis-SWNIR DRS coupled with chemometrics to achieve the analysis of D-, L- and DL-alanine, in order to develop a new strategy i.e. a convenient, fast, low-cost and nondestructive method for discrimination of enantiomers.

Accordingly, based on this study, we propose a new method to determine enantiomers of compounds with UV-vis-SWNIR DRS.

2 Experimental

2.1 Reagents

D-, L- and DL-alanine (purity ≥ 98%) were purchased from Kelong chemical reagent factory and Best-Reagent Company in Chengdu and Sinopharm chemical Reagent Co., Ltd in Shanghai, respectively. They were qualified by the polarimetry listed in the current Chinese Pharmacopoeia, in which their solutions of 0.05 g ml−1 were prepared and used.

Each of the nine kinds of alanine products was milled and sifted through 60, 80, 100, 120 and 200-mesh sieve (0.300, 0.200, 0.150, 0.125, 0.075 mm nominal diameters), and stored in shade for analysis. Among the particle samples, 200-mesh was used for X-ray diffraction patterns and 60, 80, 100 and 120-mesh were used for study on UV-vis-SWNIR DRS.

2.2 Instruments

S3000 Fiber Optic Spectrometer (Race-Technology Co., Ltd, Hangzhou, China) equipped with a 3648-element linear silicon CCD array detector (Toshiba TCD 1305), a Y-type optical fiber probe with 100 cm in length and 0.4 mm in diameter, a light source (Oceans Optics Inc., USA) and a home-made sample cell made from dark gray PVC, was used to measure the UV-vis-SWNIR diffuse reflectance spectra within the wavelength region of 200–1100 nm.

WZZ-3 automatic polarimeter (Shen Guang Instrument Co., Ltd, Shanghai, China), Optical microscope (UOP Photoelectric Technology Co., Ltd, Chongqing, China) and X'Pert PRO powder diffractometer (PANalytical Company, Holland) with a Pixcel 1D detector and Cu Kα1 radiation in the range of 5–50° 2θ were used to measure specific rotation, micrographs and X-ray diffraction patterns of D-, L- and DL-alanine, respectively.

Differential Scanning Calorimeter (DSC) 8500 (Perkinelmer Company, USA) with a measured temperature range of −180 °C to 750 °C and extremely fast controlled scanning rates to 750°C min−1 was used to analyze the melting points of D-, L- and DL-alanine.

2.3 Acquisition of UV-vis-SWNIR diffuse reflectance spectra

Spectra were measured under the following conditions: in the range from 200 to 1100 nm, integral time of 397 ms and a resolution of 0.29 nm, with a spectralon as background reference. Each alanine sample of 0.18 g was filled in the sample cell, pressed by free fall impacts of a round rod from a same height. Then the optical probe was placed vertically on the upper surface of the sample powders. Each sample was measured three times and their average spectrum was treated as the final spectrum of the sample. And each kind of alanine had fifteen samples by re-filling a given amount of the same kind of alanine fifteen times.

2.4 Data analysis

The UnscramblerX version10.2 (Camo Process AS, Oslo, Norway) was applied to analyze the acquired UV-vis-SWNIR diffuse reflectance spectral data. This software supplies many data preprocessing methods such as mean center and scale, autoscaling, normalization (Nor), Savitzky–Golay smoothing (SG), multiplicative scatter correction (MSC), standard normal variate transformation (SNV), detrend, the first derivative (1D), the second derivative (2D) and so on. Then, discriminant partial least squares (PLS-DA) were utilized to establish models and make prediction.

PLS-DA is a multiple linear classification based on principal component analysis in which the dimension reduction of both the independent and dependent variable matrix are carried out. And in the model of PLS-DA, calibration set and test set of a number of samples are needed. Calibration set is used to establish the model in which test set is used for prediction. What's more, the optimized latent variables (LVs) is selected to obtain a good result when the smallest root mean standard error of cross validation and largest square correlation coefficient are given by leave-one-out cross validation method.

The index values of square correlation coefficient (R2), root mean square error of calibration (RMSEC), root mean square error of cross-validation (RMSECV), root mean square error of prediction (RMSEP), ratio of performance deviation (RPD) and accuracy (A) are used to evaluate the established models as shown in eqn (1)–(4).

 
image file: c5ra22488h-t1.tif(1)
 
image file: c5ra22488h-t2.tif(2)
 
image file: c5ra22488h-t3.tif(3)

image file: c5ra22488h-t4.tif
 
image file: c5ra22488h-t5.tif(4)
where n = numbers of samples; ŷi = actual values of sample i; yi = predicted values of sample i; ȳi = mean of all the predicted values; Ncorrection = correct numbers of predicted samples; Ntotal = total numbers of predicted samples.

Generally, the values of R2, RMSEC, RMSECV and RMSEP close to 1, 0, 0 and 0 respectively, represent an accurate classification of models. And based on the RPD statistics, the predicted accuracy of the model is categorized into three states: accurate (RPD > 2), moderate (1.4 < RPD < 2), and poor (RPD < 1.4).34,35

3 Results and discussions

3.1 Characterization of D-, L- and DL-alanine

The nine kinds of alanine products with different chirality from three different manufactures were characterized by X-ray powder diffractometer and Differential Scanning Calorimetry (DSC) to learn their crystal structures and optical microscopy to learn their appearances.
3.1.1 X-ray diffraction patterns. Powders of the nine kinds of alanine through 120-mesh were milled for two minutes and then measured by an X'Pert PRO diffractometer with an PIXcel 1D detector and Cu Kα1 radiation (λ = 1.54056 Å, generator setting: 40 kV, 40 mA). The X-ray diffraction data were collected at room temperature in the range of 5–50° 2θ, using a step size of 0.013° 2θ and a count time of 29 s per step. By searching and matching, the achieved X-ray diffraction patterns of the nine kinds of alanine are consistent with the standard X-ray diffraction patterns in the Powder Diffraction File (PDF) card in International Centre for Diffraction Data (ICDD) of D-, L- and DL-alanine as presented in Fig. 1, and the detailed crystal information was displayed in Table 1. As seen, firstly, they have different space groups. DL-Alanine belongs to monoclinic while D- and L-alanine are orthorhombic. Secondly, in terms of unit cell, the length of a, b and c, volume (V) and density (Dc) also show difference in an extent. Even for the same chirality of alanine, after cell refinement, varieties are obtained in a, b, c, V and Dc. These difference prove that these nine kinds of alanine do have different crystal forms.
image file: c5ra22488h-f1.tif
Fig. 1 X-ray diffraction patterns of DL-, D- and L-alanine.
Table 1 Crystal structure information of DL-, D- and L-alanine
Alanine Space group a × b × c/nm α = β = γ V/nm3 Dc/g cm−3 Z
DL PDF#-21-1569 Pna21 12.019 × 6.044 × 5.831 90° 423.58 1.396 4
Best 12.017 × 6.000 × 6.016 433.76 1.364
Kelong 12.018 × 6.025 × 5.830 422.16 1.402
Sinopharm 12.020 × 5.987 × 5.840 420.33 1.408
D PDF#-11-0993 P212121 6.000 × 12.100 × 5.750 417.45 1.418
Best 6.020 × 12.102 × 5.778 421.03 1.406
Kelong 6.006 × 12.099 × 5.809 422.15 1.402
Sinopharm 5.995 × 12.050 × 5.788 418.13 1.415
L PDF#-28-1508 P212121 6.031 × 12.351 × 5.782 430.69 1.375
Best 6.021 × 12.317 × 5.778 428.53 1.381
Kelong 6.020 × 12.324 × 5.784 429.10 1.379
Sinopharm 6.002 × 12.312 × 5.776 426.84 1.386


3.1.2 Differential scanning calorimetry thermograms. The characteristics of the nine kinds of alanine were studied with differential scanning calorimetry. The measurement was carried out in protecting nitrogen atmosphere with a flow rate of 20.0 ml min−1 and a heating rate of 10 °C min−1 within a temperature range of 100–350 °C. Fig. 2 shows the obtained thermograms. It is found that the nine kinds of alanine have different melting points, although they fell into the reported range of 296–316 °C. As for the alanine from Best and Kelong, the melting temperature of L-alanine is higher than D-alanine, while that of D-alanine is higher than DL-alanine. While as for Sinopharm, the melting point of D-alanine is higher than L-alanine. Besides, the height and area of these peaks are also different in value. These differences indicate that the nine kinds of alanine have some different crystal structures.
image file: c5ra22488h-f2.tif
Fig. 2 The DSC thermograms of DL-, D- and L-alanine (P: peak; H: peak height; A: peak area).
3.1.3 Optical micrographs. Optical microscopy was applied to look insight the micrographs of alanine products from the different manufacturers, since the size and shape of particles may differ with crystal forms and habits. The optical micrographs with 10 × 40 times magnification of the nine kinds of alanine products through 100-mesh were got as shown in Fig. 3. Their size and shapes are different between different kinds of chirality and manufacturers. The D-alanine from Sinopharm and Kelong are near to irregular sphere while the one from best is in the shape of cylindrical. All DL-alanine are in acicular shape besides the difference in size. As for the L-alanine, they are in a good cylinder with some difference between each other. These considerable differences demonstrate that they have different crystal habits.
image file: c5ra22488h-f3.tif
Fig. 3 Micrographs of DL-, D- and L-alanine with 10 × 40 times magnification.

All these reveal that D-, L- and DL-alanine have different crystal structures probably resulting in diverse absorption or reflectance of spectroscopy, which may allow UV-vis-SWNIR DRS to be applied for classification.

3.2 Optimization of measuring conditions of UV-vis-SWNIR spectra

Based on the Kubelka–Munk light scattering theory,36,37 the absorption intensities will increase along with the increasing of powder particle sizes. Therefore, to establish an accurate model of discrimination in this research, the effect of particle sizes was investigated with the original spectral data in the region of 220–980 nm instead of 200–1100 nm in order to filter the noise of machine, using the samples of D-, L- and DL-alanine from best with the size of 60, 80, 100 and 120-mesh.

45 spectral samples for each particle sizes were divided into a calibration set and a prediction set by randomly. The calibration set had 30 spectra and prediction set had 15 spectra. The result of modeling PLS-DA is shown in Table 2. It indicates that the best size for UV-vis-SWNIR DRS is 100-mesh, resulted in the discrimination with a R2 of 0.9919 and RMSEP of 0.0400 for prediction.

Table 2 Optimization by modeling PLS-DA with UV-vis-SWNIR spectra
Optimum condition LVs Calibration Cross-validation Prediction
Particle size (mesh) R2 RMSEC R2 RMSECV R2 RMSEP RPD
60 6 0.9900 0.0816 0.9779 0.1216 0.9745 0.0090 6.7267
80 4 0.9801 0.1151 0.9671 0.1478 0.9511 0.4144 4.5222
120 8 0.9957 0.0533 0.9762 0.1497 0.9879 0.0124 9.0909
100 6 0.9941 0.0117 0.9861 0.0902 0.9919 0.0400 11.1111

Optimum condition LVs Calibration Cross-validation Prediction
Distance (mm) R2 RMSEC R2 RMSECV R2 RMSEP RPD
3.8 4 0.9284 0.2185 0.9049 0.2783 0.8658 0.5905 2.7298
4.5 6 0.9947 0.0596 0.9892 0.0896 0.9789 0.2412 6.8843
5.3 6 0.9953 0.0557 0.9905 0.0872 0.9767 0.2417 6.5512
6.1 6 0.9955 0.0550 0.9905 0.0798 0.9838 0.2750 7.8567


Then, the distance of 3.8, 4.5, 5.3 and 6.1 mm between fiber probe and sample was also investigated by modeling PLS-DA with original spectral data under the condition of constant 100-mesh. The spectra of a same chiral alanine differed very seldom with distance. The predicted result given in Table 2 displays that the farther distance the better performance of the model within the distance of 4.5 mm, but beyond that there is no notable difference.

The total results suggest that the optimum powder size and distance are 100-mesh and 5.3 mm, respectively.

3.3 Qualitative analysis

3.3.1 UV-vis-SWNIR spectra of nine kinds of alanine products. The spectra of nine kinds of alanine products were measured under the optimal conditions of 100-mesh and distance of 5.3 mm as presented in Fig. 4 and each kind of alanine products has 15 spectral samples. In total, there are 135 spectra.
image file: c5ra22488h-f4.tif
Fig. 4 UV-vis-SWNIR spectra of nine kinds of alanine products.

Among the spectra of nine kinds of alanine products there are big differences in the wavelength region of 227–233 nm and 250–350 nm, besides the differences in the total shifts in absorbance. The maximum peaks of alanine shifted slightly from 227 nm to 233 nm with an absorbance change from 0.4 to 0.75. Meanwhile, in the region of 250–350 nm, there was a big valley in which six kinds of alanine products have a notable peak with different peak position and absorbance, except for D-alanine from Sinopharm and Kelong and DL-alanine from Best. Although these differences are not enough in direct identification of chirality by eyes, when combined with chemometrics they could be used to realize the above goal, as being proved subsequently.

3.3.2 Classification basing on chirality. In this case, the nine kinds of alanine products were classified into three groups numbered with 1–3, according to their chirality but regardless of their manufacturing origins. The 135 spectra were split into a calibration set and a prediction set by randomly. The calibration set had 90 spectra and prediction set had 45 spectra. Modeling PLS-DA with several data preprocessing methods was carried out in the range of 220–980 nm. Table 3 gives the result that modeling PLS-DA without data preprocessing but just eliminating 3 outlier samples has a good discrimination with a better prediction of a R2 of 0.9673 and a RMSEP of 0.1476 as shown in Fig. 5. Moreover, Table 4 and Fig. 6A and B demonstrate in detail that the 9 kinds of alanine products could be grouped into 3 classes with a 100% accuracy according to their chirality. It turns out that it is feasible for UV-vis-SWNIR DRS to implement the discrimination of chirality.
Table 3 Result of modeling PLS-DA of the 3 grouped alanine
Data preprocessing Origin SG SNV MSC Nor Center&scale Detrend
No eliminating outlier
LVs 7 7 8 7 7 7 5
Calibration R2 0.9708 0.9708 0.9704 0.9610 0.9641 0.9701 0.9654
RMSEC 0.1394 0.1396 0.1405 0.1613 0.1546 0.1411 0.1519
Cross-validation R2 0.9571 0.9570 0.9580 0.9476 0.9480 0.9553 0.9570
RMSECV 0.1711 0.1713 0.1692 0.1889 0.1883 0.1745 0.1711
Prediction R2 0.9668 0.9667 0.9675 0.9661 0.9630 0.9657 0.9696
RMSEP 0.1489 0.1491 0.1471 0.1504 0.1571 0.1512 0.1425
Accuracy% 100 100 100 100 100 100 100
[thin space (1/6-em)]
Eliminating outlier
  38, 61, 70 38, 6, 70 38, 46, 70 38, 70 32, 37, 38, 70 38, 61, 70 61
LVs 7 7 8 7 7 6 5
Calibration R2 0.9785 0.9785 0.9733 0.9640 0.9739 0.9753 0.9662
RMSEC 0.1196 0.1196 0.1346 0.1554 0.1338 0.1283 0.1496
Cross-validation R2 0.9714 0.9714 0.9616 0.9526 0.9668 0.9653 0.9576
RMSECV 0.1397 0.1397 0.1632 0.1804 0.1527 0.1538 0.1670
Prediction R2 0.9673 0.9670 0.9684 0.9675 0.9621 0.9620 0.9707
RMSEP 0.1476 0.1485 0.1452 0.1472 0.1589 0.1591 0.1396
Accuracy% 100 100 100 100 100 100 100


image file: c5ra22488h-f5.tif
Fig. 5 Diagram of outlier samples of the 3 grouped alanine.
Table 4 Prediction of the 3 grouped alanine by PLS-DA
Samples Numbered values Predicted values Samples Numbered values Predicted values Samples Numbered values Predicted values
a Correct numbers means the correct numbers of predicted samples.
1 1 0.84 16 2 1.93 31 3 3.08
2 1 0.81 17 2 1.92 32 3 3.37
3 1 0.90 18 2 1.94 33 3 2.99
4 1 0.89 19 2 1.94 34 3 2.60
5 1 0.77 20 2 1.90 35 3 3.01
6 1 1.08 21 2 1.90 36 3 2.79
7 1 1.05 22 2 1.92 37 3 3.07
8 1 1.06 23 2 1.89 38 3 2.95
9 1 1.07 24 2 1.93 39 3 3.23
10 1 1.12 25 2 1.88 40 3 2.88
11 1 1.01 26 2 2.14 41 3 2.97
12 1 1.09 27 2 2.23 42 3 3.04
13 1 1.10 28 2 2.15 43 3 2.96
14 1 1.19 29 2 2.26 44 3 3.10
15 1 1.04 30 2 2.26 45 3 2.88
Threshold   1 ± 0.5     2 ± 0.5     3 ± 0.5
Correct numbersa 45
Accuracy% 100


image file: c5ra22488h-f6.tif
Fig. 6 Results of prediction of the 3 grouped alanine: (A) diagram of actual and predicted values, (B) deviation map of predicted samples.
3.3.3 Classification basing on both chirality and manufacturing origins. To see whether the observed differences in spectra are due to their chirality or to different habits of D- and L-alanine in solid, classification basing on both chirality and manufacturers was carried out. All alanine samples were divided into nine groups according to both their chirality and manufacturers, numbered with 1–9. The following data processing was the same as the procedure mentioned above. As shown in Table 5, the result of modeling PLS-DA indicates that MSC has a better prediction with a R2 of 0.9787 and RMSEP of 0.3770 by eliminating 2 outlier samples shown in Fig. 7. The detailed information in Table 6 and Fig. 8A and B show that the accuracy of the nine groups just reach 86.67% with six wrong discrimination which is not very well compared with the 3 grouped alanine.
Table 5 Result of modeling PLS-DA of the 9 grouped alanine
Data preprocessing Origin SG SNV MSC Nor Center&scale Detrend
No eliminating outlier
LVs 7 7 7 7 6 7 6
Calibration R2 0.9761 0.9760 0.9723 0.9769 0.9699 0.9755 0.9693
RMSEC 0.3988 0.4003 0.4296 0.3926 0.4478 0.4040 0.4522
Cross-validation R2 0.9652 0.9650 0.9627 0.9687 0.9517 0.09635 0.9607
RMSECV 0.4871 0.4886 0.5046 0.4619 0.5737 0.4990 0.5178
Prediction R2 0.9768 0.9766 0.9797 0.9793 0.9738 0.9761 0.9715
RMSEP 0.3932 0.3947 0.3681 0.3717 0.4183 0.3996 0.4359
Accuracy% 84.44 84.44 80 84.44 82.22 84.44 73.33
[thin space (1/6-em)]
Eliminating outlier
  38, 61, 70 38, 61, 70 38, 70 38, 70 21, 32, 37, 38, 70 38, 61, 70 37, 38, 89
LVs 7 7 7 7 6 7  
Calibration R2 0.9800 0.9799 0.9748 0.9780 0.9744 0.9796 0.9617
RMSEC 0.3683 0.3694 0.4131 0.3854 0.4215 0.3721 0.5063
Cross-validation R2 0.9709 0.9708 0.9669 0.9711 0.9635 0.9696 0.9536
RMSECV 0.4496 0.4506 0.4784 0.4471 0.5092 0.4596 0.5633
Prediction R2 0.9760 0.9738 0.9760 0.9787 0.9611 0.9762 0.9609
RMSEP 0.3997 0.4182 0.4004 0.3770 0.5095 0.3980 0.5105
Accuracy% 84.44 84.44 77.78 86.67 66.67 84.44 64.44


image file: c5ra22488h-f7.tif
Fig. 7 Diagram of outlier samples of the 9 grouped alanine.
Table 6 Prediction of the 9 grouped alanine by PLS-DA
Samples Numbered values Predicted values Threshold Samples Numbered values Predicted values Threshold
1 1 0.55 1 ± 0.5 24 5 5.16 5 ± 0.5
2 1 0.67 25 5 4.96
3 1 0.81 26 6 6.21 6 ± 0.5
4 1 0.54 27 6 6.33
5 1 0.91 28 6 6.03
6 2 1.81 2 ± 0.5 29 6 6.43
7 2 2.13 30 6 6.53
8 2 2.07 31 7 7.06 7 ± 0.5
9 2 2.30 32 7 7.52
10 2 1.86 33 7 6.89
11 3 2.52 3 ± 0.5 34 7 6.05
12 3 2.72 35 7 6.90
13 3 2.92 36 8 7.23 8 ± 0.5
14 3 2.75 37 8 8.26
15 3 3.05 38 8 7.92
16 4 4.36 4 ± 0.5 39 8 8.89
17 4 4.08 40 8 7.56
18 4 4.47 41 9 8.85 9 ± 0.5
19 4 4.09 42 9 9.37
20 4 4.15 43 9 8.86
21 5 4.96 5 ± 0.5 44 9 9.36
22 5 5.24 45 9 7.99
23 5 4.94      
Correct numbers 39
Accuracy% 86.67


image file: c5ra22488h-f8.tif
Fig. 8 Results of prediction of the 9 grouped alanine: (A) diagram of actual and predicted values, (B) deviation map of predicted samples.
3.3.4 Comparison of classification by chirality with by manufacturers. The above results that the accuracy of 100% obtained when the alanine was divided into 3 groups is much better than that of 86.67% when grouped into 9 groups imply that UV-vis-SWNIR DRS with chemometrics is more sensitive to chirality than to manufacturing origins. In other words, other than manufacturing origins, the chirality is the preferential factor for the difference of spectra between enantiomers and racemates of alanine.

3.4 Inference of principle

It is well known that UV-vis spectra of enantiomers are the same in non-chiral media or solutions. But the situation in UV-vis reflectance spectra of alanine enantiomers in powder are different as observed in this work. This is likely due to their different crystal structures and habits. It also has been reported that different polymorph can display different ultraviolet-visible spectra,38 different crystal structures can cause different UV-vis-SWNIR diffuse reflectance spectra.33 Here a preliminary inference is made that UV-vis-SWNIR diffuse reflectance spectra of enantiomers in pure solid state may be different, because different configuration of enantiomer pairs can result in different crystal forms and habits. Although the differences are small, it forms the basis to apply UV-vis-SWNIR DRS combined with chemometrics on the identification of enantiomers.

4 Conclusion

The feasibility of UV-vis-SWNIR DRS for qualitative analysis of enantiomers and racemates of chiral compound in solid state was first investigated and proved by using D-, L- and DL-alanine from three different manufactures as model compounds. The classification based on chirality has an accuracy of 100% which is better than that of 86.67% based on manufactures. It is obvious that UV-vis-SWNIR DRS is more sensitive to chirality of alanine. Hence, UV-vis-SWNIR diffuse reflectance spectroscopy as a novel qualitative analysis method for chiral compounds is proposed. It is simply sample-preprocessing, rapid, convenient and inexpensive and can be expected to apply in pharmaceutical industry. More work is needed for its development and better understanding of the effect of molecular configuration on diffuse reflectance spectra.

References

  1. Y. Shen, D. N. Yi and J. N. Liu, Discussion of the application of three-point interaction principle to the phenyl glycine racemic compound in is spectrometry and its enantiomers separation in HPLC, Acta Pharmacol. Sin., 2002, 37, 636–638 CAS.
  2. M. A. Martínez-Gómez, J. J. Martínez-Pla, S. Sagrado, R. M. Villanueva-Camañas and M. J. Medina-Hernández, Chiral separation of oxprenolol by affinity electrokinetic chromatography-partial filling technique using human serum albumin as chiral selector, J. Pharm. Biomed. Anal., 2005, 39, 76–81 CrossRef PubMed.
  3. J. J. Martínez-Pla, Y. Martín-Biosca, S. Sagrado, R. M. Villanueva-Camañas and M. J. Medina-Hernández, Fast enantiomeric separation of propranolol by affinity capillary electrophoresis using human serum albumin as chiral selector: application to quality control of pharmaceuticals, Anal. Chim. Acta, 2004, 507, 171–178 CrossRef.
  4. X. Guo, Z. Q. Wang, L. H. Zuo, Z. X. Zhou, X. J. Guo and T. M. Sun, Quantitative prediction of enantioseparation using β-cyclodextrin derivatives as chiral selectors in capillary electrophoresis, Analyst, 2014, 139, 6511–6519 RSC.
  5. L. H. Zuo, Y. F. Zhao, F. F. Ji, M. Zhao, Z. Jiang, T. M. Sun and X. J. Guo, Determination of the enantiomeric and diastereomeric impurities of RS-glycopyrrolate by capillary electrophoresis using sulfated-β-cyclodextrin as chiral selectors, Electrophoresis, 2014, 35, 3339–3344 CrossRef CAS PubMed.
  6. C. D. Tran, D. Oliveira and V. I. Grishko, Determination of enantiomeric compositions of pharmaceutical products by near-infrared spectrometry, Anal. Biochem., 2004, 325, 206–214 CrossRef CAS PubMed.
  7. C. Z. Wang, Z. A. Zhu, Y. Li and R. T. Chen, The cyclic dichromism studies of chiral zincporphyrins, Wuji Huaxue Xuebao, 2001, 17, 244–248 CAS.
  8. C. N. Guo, R. D. Shah, R. K. Dukor, X. L. Cao, T. B. Freedman and L. A. Nafie, Determination of enantiomeric excess in samples of chiral molecules using fourier transform vabrational circular dichroism spectroscopy: simulation of real-time reaction monitoring, Anal. Chem., 2004, 76, 6956–6966 CrossRef CAS PubMed.
  9. F. N. Ma, X. M. Shen, X. Ming, J. M. Wang, J. O. Yang and C. Zhang, The novel macrocyclic compounds as chiral solvating agents for determination of enantiomeric excess of carboxylic acids, Tetrahedron: Asymmetry, 2008, 19, 1576–1586 CrossRef CAS.
  10. W. A. Tao and R. G. Cooks, Chiral analysis by MS, Anal. Chem., 2003, 1, 25A–31A Search PubMed.
  11. L. M. Wu, E. C. Meurer and R. G. Cooks, Chrial morphing and enantiomeric quantification in mixtures by mass spectrometry, Anal. Chem., 2004, 76, 663–671 CrossRef CAS PubMed.
  12. S. O. Fakayode, P. N. Brady, D. A. Pollard, A. K. Mohammed and I. M. Warner, Multicomponent analyses of chiral samples by use of regression analysis of UV-visible spectra of cyclodextrin guest-host complexes, Anal. Bioanal. Chem., 2009, 394, 1645–1653 CrossRef CAS PubMed.
  13. Q. Q. Li, J. Duan, L. J. Wu, Y. Huang, G. Tang and S. G. Min, Sucrose as chiral selector for determining enantiomeric compositior of phenylalanie by UV-vis spectroscopy and chemometric, Chin. Chem. Lett., 2012, 23, 1055–1058 CrossRef CAS.
  14. Q. Q. Li, Y. Huang, J. Duan, L. J. Wu, G. Tang, Y. W. Zhu and S. G. Min, Sucrose as chiral selector for determining enantiomeric composition of metalaxyl by UV–vis spectroscopy and PLS regression [J]. Molecular and biomolecular spectroscopy, Spectrochim. Acta, Part A, 2013, 101, 349–355 CrossRef CAS PubMed.
  15. S. O. Fakayode, M. A. Bush and K. W. Busch, Determination of enantiomeric composition of samples by multicariate regression modeling of spectral data obtained with cyclodextrin guest-host complexes-effect of an achiral surfactant and use of mixed cyclodextrins, Talanta, 2006, 68, 1574–1583 CrossRef CAS PubMed.
  16. Q. Q. Li, L. J. Wu, L. Wei, J. L. Cao, J. Duan, Y. Huang and S. G. Min, UV Spectroscopy coupled with partial least squares to determine the enantiomeric composition in chiral drugs, Spectrosc. Spectral Anal., 2012, 32, 500–504 CAS.
  17. K. W. Busch, I. M. Swamidoss, S. O. Fakayode and M. A. Busch, Determination of the enantiomeric composition of some molecules of pharmaceutical interest by chemometric analysis of the UV spectra of cyclodextrin guest-host complexes, Anal. Chim. Acta, 2004, 525, 53–62 CrossRef CAS.
  18. S. O. Fakayode, I. M. Swamidoss, M. A. Busch and K. M. Busch, Determination of the enantiomeric composition of some molecules of pharmaceutical interest by chemometric analysis of the UV spectra of guest-host complexes formed with modified cyclodextrins, Talanta, 2005, 65, 838–845 CrossRef CAS PubMed.
  19. J. R. Ingle, K. W. Busch and M. A. Busch, Chiral analysis by multivariate regression modeling of spectral data using cyclodextrin guest-host complexes-methods for determining enantiomeric composition with varying chiral analyte concentration, Talanta, 2008, 75, 572–584 CrossRef CAS PubMed.
  20. W. Li, J. W. Xie, Y. Q. Zhai, Y. Z. Ping and R. J. Xiu, Simultaneous flurescence determination of D, L-tryptophan enantiomer by chiral recognition of beta-cyclodextrin, Bull. Acad. Mil. Med. Sci., 2002, 26, 99–101 CAS.
  21. C. D. Tran and D. Oliveira, Fluorescence determination of enantiomeric composition of pharmaceuticals via use of ionic liquid that serves as both solvent and chiral selector, Anal. Biochem., 2006, 356, 51–58 CrossRef CAS PubMed.
  22. S. O. Fakayode, M. A. Busch, D. J. Bellert and K. W. Busch, Determination of the enantiomeric composition of phenylalanine samples by chemometric analysis of the fluorescence spectra of cyclodextrin guest–host complexes, Analyst, 2005, 130, 233–241 RSC.
  23. J. D. Yang, Simultaneous determination of D-&L-Tryptophan chiral enantiomer complexed with β-cyclodextrin by using Resonance Rayleigh Scattering spectrum and "Measurement analysis of two lines with one same point", Fenxi Kexue Xuebao, 2006, 22, 454–457 CAS.
  24. C. D. Tran, V. I. Grishko and D. Oliveira, Determination of enantiomeric compositions of amino acids by near-infrared spectrometry through complexation with carbohydrate, Anal. Chem., 2003, 75, 6455–6462 CrossRef CAS PubMed.
  25. S. A. Kustrin and R. Alany, Application of diffuse reflectance infrared Fourier transform spectroscopy combined with artificial neural networks in analysing enantiomeric purity of terbutaline sulphate bulk drug, Anal. Chim. Acta, 2001, 449, 157–165 CrossRef.
  26. S. A. Kustrin, R. Beresford and M. Razzak, Determination of enantiomeric composition of ibuprofen in solid state mixtures of the two by DRIFT spectroscopy, Anal. Chim. Acta, 2000, 417, 31–39 CrossRef.
  27. M. Yamaguchi, F. Miyamaru, K. Yamamoto, M. Tani and M. Hangyo, Terahertz absorption spectra of L-, D-, and DL-alanine and their application to determination of enantiometric composition, Appl. Phys. Lett., 2005, 86, 053903 CrossRef.
  28. J. Te, H. W. Zhao, Z. Y. Zhang, M. Ge, W. F. Wang, X. H. Yu and H. J. Xu, Terahertz time domain spectroscopy of D-, L-, and DL-penicillamines, Acta Phys.-Chim. Sin., 2006, 22, 1159–1162 Search PubMed.
  29. H. Xu, X. H. Yu, Z. Y. Zhang, J. G. Han, Q. N. Li, Z. Y. Zhu and W. X. Li, Terahertz time domain spectroscopy of amino acids in solid phase, J. Grad. Sch. Chin. Acad. Sci., 2005, 22, 90–93 Search PubMed.
  30. X. T. Gao and I. E. Wachs, Investigation of Surface Structures of Supported Vanadium Oxide Catalysts by UV-vis-NIR Diffuse Reflectance Spectroscopy, J. Phys. Chem. B, 2000, 104, 1261–1268 CrossRef CAS.
  31. R. A. Viscarra Rossel, R. N. McGlynn and A. B. McBratney, Determining the composition of mineral-organic mixes using UV-vis-NIR diffuse reflectance spectroscopy, Geoderma, 2006, 137, 70–82 CrossRef CAS.
  32. H. Filik, M. Hayvalı, E. Kılıç, R. Apak, D. Aksu, Z. Yanaz and T. Çengel, Development of an optical fibre reflectance sensor for p-aminophenol detection based on immobilised bis-8-hydroxyquinoline, Talanta, 2008, 77, 103–109 CrossRef CAS PubMed.
  33. Y. Y. Feng, X. L. Li, K. L. Xu, H. Y. Zou, H. Li and B. Liang, Qualitative and simultaneous quantitative analysis of cimetidine polymorphs by ultraviolet-visible and shortwave near-infrared diffuse reflectance spectroscopy and multivariate calibration models, J. Pharm. Biomed. Anal., 2015, 104, 112–121 CrossRef CAS PubMed.
  34. M. C. Sarathjith, B. S. Das, H. B. Vasava, B. Mohanty and A. S. Sahadevan, Diffuse reflectance spectroscopic approach for the characterization of soil aggregate size distribution, Soil Sci. Soc. Am. J., 2014, 78, 369–376 CrossRef.
  35. C. W. Chang, D. Laird, M. J. Mausbach and C. R. Hurburgh Jr, Near-Infrared reflectance spectroscopy-principal components regression analyses of soil properties, Soil Sci. Soc. Am. J., 2001, 65, 480–490 CrossRef CAS.
  36. M. Otsuka, Comparative particle size determination of phenacetin bulk powder by using Kubelka-Munk theory and principal component regression analysis based on near-infrared spectroscopy, Powder Technol., 2004, 141, 244–250 CrossRef CAS.
  37. W. Luo, J. Wu, X. K. Wang, X. Lin and H. Li, Near infrared spectroscopy combination with PLS to monitor the parameters of naproxen tablet preparation process, Anal. Methods, 2013, 5, 1337–1345 RSC.
  38. S. Datta and D. J. W. Grant, Crystal structures of drugs: advances in determination, prediction and engineering, Nat. Rev. Drug Discovery, 2004, 3, 42–57 CrossRef CAS PubMed.

This journal is © The Royal Society of Chemistry 2016