
Large-scale growth of sharp gold nano-cones for single-molecule SERS detection†
Ling Zhang‡
ab,
Hongwen Liu‡b,
Luyang Chenb,
Pengfei Guanb,
Bin Chenc,
Takeshi Fujitab,
Yoshinori Yamaguchide,
Hiroshi Iwasakide,
Qi-Kun Xuebf and
Mingwei Chen*bcg
aSchool of Optical-Electrical and Computer Engineering, University of Shanghai for Science and Technology, Shanghai 200093, P. R. China
bWPI-Advanced Institute for Materials Research, Tohoku University, Sendai 980-8577, Japan. E-mail: mwchen@wpi-aimr.tohoku.ac.jp
cSchool of Materials Science and Engineering, Shanghai Jiao Tong University, Shanghai 200030, China
dPARC, Graduate School of Engineering, Osaka University, Osaka 565-0871, Japan
eDepartment of Applied Physics, Graduate School of Engineering, Osaka University, Osaka 565-0871, Japan
fDepartment of Physics, Tsinghua University, Beijing 100084, China
gCREST, Japan Science and Technology Agency (JST), Saitama 332-0012, Japan
First published on 3rd December 2015
Abstract
We report a novel approach for large-scale gold nano-cone growth by utilizing the open nanopore channels of nanoporous gold films as both the template for nano-cone growth and the delivery channel of the reduction gas through the nano-pipes. Quasi-periodic nano-cone arrays uniformly sprout on the centimeter-sized free-standing nanoporous gold films. The sharp nano-cones give rise to ultrahigh surface enhanced Raman scattering for single molecule detection from the focused electromagnetic fields at the cone apexes. The large-scale nano-cone decorated nanoporous gold films may serve as high-performance SERS substrates for wide-ranging applications in ultrasensitive instrumentation and molecule diagnostics.
Introduction
Surface-enhanced Raman scattering (SERS) is a powerful analytical technique for probing and identifying organic and biological molecules.1–3 Ultra-high SERS enhancement from nano-sized “hot spots” opens up the exciting capability to pursue the analytical limit of spectroscopic methods for single molecule detection. Numerous experimental studies have focused on synthesizing high-performance, reproducible plasmonic nanostructures by optimizing the various contributions to SERS enhancement.4–11 Enhancement factors larger than 107 have been achieved from closely spaced interacting particles7,8 and nanostructures with sharp tips, corners or edges4,9,10 where local electromagnetic fields are dramatically augmented because of the resonant excitation of localized surface plasmons and the lightning rod effect of highly curved metal surfaces.12 Various configurations for amplifying local electromagnetic fields have been reported recently, such as two-dimensional ordered arrays of nanoparticles from nanospherical lithography,13 nanodiamond/nanostar structures14 and bowtie antenna from electron beam lithography.15 Particularly, aligned metallic nano-tips as plasmonic nanoantennas are expected to be capable of single molecule SERS detection. Several methods have been developed to fabricate nano-tip based SERS substrates, for example, gold-shell nanopyramids fabricated using colloidal silica as a template,16 gold-covered silicon nano-tip arrays fabricated using chemical etching,17 and gold needle arrays made using Ar+ ion irradiation.18 However, those substrates are limited either by complicated and expensive fabrication processes or by poor reproducibility. Moreover, all of them have been reported to not realize sufficient SERS enhancements for single molecule detection.19 In this study, we report a novel and facile approach for the large-scale synthesis of aligned gold nano-cones (NC) by utilizing nanoporous gold (NPG) as both the template for nano-cone growth and the nano-pipe for the delivery of reduction gas. The sharp nano-cones with an apex smaller than 5 nm, uniformly distributed on centimeter-sized NPG substrates, are capable of single molecule SERS detection.Free-standing nanoporous gold films prepared by dealloying have bicontinuous nanoporosity in which open pore channels and gold ligaments are interconnected through the entire film.20–22 Although NPG is an outstanding plasmonic substrate for surface enhanced spectroscopy and smaller nanopores yield higher SERS enhancement,20 the lack of sharp edges and corners, along with inadequate electromagnetic coupling between the gold ligaments, leads to a technical difficulty in directly exploiting NPG as a substrate for single molecule detection.23 In this study, we employed NPG as the template for sharp nano-cone (NC) growth. The NPG used in this work was prepared by selective dissolution of silver from 100 nm thick white gold leaves.20,21 The fabrication process of the NC@NPG films is schematically depicted in Fig. 1. First, the hydrophobic NPG film is floated on the plating aquatic solution that contains 1 mM Au3+ and 2 mg mL−1 sodium dodecyl sulfate (SDS). Then, the NPG film, along with the solution container, is placed in an airtight box filled with hydrazine gas.5,24 The hydrazine gas diffuses into the interface between the underside of the NPG film and the plating solution through the open nanopores, which do not fill with the solution due to the very small nanopore size and the hydrophobic nature of NPG. The reduction reaction between hydrazine and aqueous chloroaurate ions mainly takes place in the vicinity of each nanopore channel, which results in the formation of single-crystal gold nano-cones that epitaxially grow from the underside of the NPG into the solution. This growth manner is highly analogous to that of stalactites in nature, which proceeds by interface reactions between solid and liquid and is controlled by the slow diffusion of the reduction gas.
 | ||
| Fig. 1 (a) Schematic diagram of the nano-cone formation at the interface between the NPG film and plating solution. (b) SEM micrographs of the as-prepared NPG. (c) SEM image of the nano-cone decorated NPG. The inset shows a selected area electron diffraction pattern from the NC@NPG, demonstrating the single-crystal nature of the sample and the epitaxial growth of NCs on the NPG substrate. | ||
Experimental
Materials and instrumentations
All chemicals used in this study, including tetrachloroauric acid (HAuCl4), sodium dodecyl sulfate (SDS), polyvinyl pyrrolidone (PVP), lysine, and rhodamine 6G (R6G) were purchased from Sigma-Aldrich. Microstructure characterization was performed using atomic force microscopy (AFM, Veeco CP-50-OL) and scanning electron microscopy (SEM, JIB-4600F). Chemical composition was analyzed using an energy-dispersive X-ray spectroscope (EDS) equipped in a transmission electron microscope (TEM, JEM-ARM200F). A micro-Raman spectrometer (Renishaw InVia RM 1000) was used for regular SERS measurements. The Raman mappings for the single molecule detection were recorded using a Nanophoton laser Raman microscope (RAMAN-11) (100×, NA = 0.9). The RAMAN-11 features a single-transverse-mode laser to realize spatial resolution greater than 500 nm. The ultrafast and stable Raman imaging in line optical scanning mode enables the catching of “hot spots” in probed regions, which are highly sensitive and easily missed. The dispersion of the electromagnetic field around the NCs was calculated using a discrete dipole approximation (DDA).Fabrication of NPG
NPG films were prepared by the selective dissolution of silver from 100 nm thick white gold leaves (Ag![[thin space (1/6-em)]](https://www.rsc.org/images/entities/char_2009.gif) :Au = 65:35 at%) in 71% nitric acid for 6 hours at room temperature. The as-dealloyed NPG films with an average pore size of 30–40 nm were carefully washed with distilled water (18.2 MΩ cm) to remove residual chemicals.
:Au = 65:35 at%) in 71% nitric acid for 6 hours at room temperature. The as-dealloyed NPG films with an average pore size of 30–40 nm were carefully washed with distilled water (18.2 MΩ cm) to remove residual chemicals.
SERS measurements
SERS spectra were collected using a Renishaw inVia micro-Raman spectrometer with 633 nm (wet samples) and 514 nm (dry samples) excitations, and the laser power was set at a low value to avoid possible damage to the probe molecule. SERS mapping images were measured using a Nanophoton laser Raman microscope with 532 nm excitation. The laser power was set at as low as ∼0.1 mW to avoid possible damage from laser irritation. In order to calculate the EF, the substrates were sealed up in a capillary tube together with a 10−6 M R6G methanol solution. For the incident angle dependent SERS measurements, the NC@NPG substrate was immersed in 10−6 M R6G methanol solution for about 30 minutes and then taken out and washed with ethanol. After drying in air, the substrate was fixed on a rotatable sample stage for SERS measurements. The excitation wavelength was 633 nm. The laser power was set at a low value to avoid possible damage to the probe molecule. The accumulation time for the SERS measurement was 50 seconds. All the spectra are the average of the spectra obtained at 10 different sites on the substrates.Results and discussion
We systematically investigated the effects of the reactants on the NC growth and found that the surfactant, sodium dodecyl sulfate (SDS), and the concentration of Au3+ are the key factors controlling the formation of NC. As shown in Fig. 2a, with high concentrations of 5 mM Au3+ and 2 mg mL−1 SDS, the growth rate of the NCs is very fast and large NCs with a random orientation and low areal density are formed on the NPG film in a short deposition time of 30 minutes. When we reduced the Au3+ concentration to 1 mM, uniform NCs with an orientation perpendicular to the NPG film can be formed with a controllable growth rate (Fig. 2b). It was also found that the addition of SDS plays a crucial role in the formation of the gold NCs. Without SDS, the gold plating leads to the homogeneous growth of gold ligaments of NPG and NCs cannot be formed on the NPG substrates.5 We also tried other additions, such as lysine (Fig. 2c) and polyvinyl pyrrolidone (Fig. 2d). However, they result in the formation of gold nanoparticles on the NPG film, but not NCs. SDS is a common anionic surfactant with one hydrophilic end and one hydrophobic end. Below a critical micellar concentration (∼2.4 mg mL−1), the surfactant molecule adsorption is governed by monomer adsorption.25–27 SDS molecules may selectively adsorb on specific surfaces of gold ligaments, such as terraces, edges and corners that have high chemical activity,28 and lead to the nucleation and growth of plated gold along a preferential direction for the formation of NCs by suppressing the uniform growth of gold ligaments. In this study, the optimal plating solution for controlled NC growth is found to be composed of 1 mM Au3+ and 2 mg mL−1 SDS. | ||
| Fig. 2 SEM images of gold-plated NPG prepared under different conditions. (a) The plating solution contains 5 mM Au3+ and 2 mg mL−1 SDS; (b) the solution contains 1 mM Au3+ and 2 mg mL−1 SDS; (c) the solution contains 1 mM Au3+ and 2 mg mL−1 lysine; (d) the solution contains 1 mM Au3+ and 2 mg mL−1 PVP; (e) the as-dealloyed NPG film is used as the substrate; and (f) the annealed NPG film is used as the substrate. The insets shown in (e) and (f) represent the SEM micrographs of the NPG films before gold plating. | ||
With the optimal plating solution, we investigated the influence of the nanopore size in the NPG on the NC growth by annealing the NPG at high temperatures. For the as-dealloyed NPG substrate, a high density of NCs can be observed after 30 minutes of plating (Fig. 2e). After annealing the NPG film at 200 °C for 120 minutes, the nanopore size increases from ∼30–40 nm to ∼90 nm. Under the same plating conditions, it can be seen that heterogeneous gold nanoparticles appear on the ligament surface, instead of a high density of NCs. Since the terraces, edges and corners of the gold ligaments act as the preferential nucleation sites for the plated gold, the small gold ligaments of the as-prepared NPG have more nucleation sites than those in the annealed NPG, in which the ligaments become large and the surface becomes smooth because of the surface diffusion and relaxation.28 Fewer nucleation sites as well as fast diffusion of the reduction gas through the large pore channels may be the reason for the formation of heterogeneous nanoparticles on the annealed NPG substrate. Since smaller ligament sizes can provide more nucleation sites for a higher density of NCs, we also investigated NPG with a small pore size of ∼10–15 nm. Although small ligaments of the fine NPG film can improve the density of NCs, the small pore channels are quickly sealed by the plating gold, which prevents NC growth. Thus, in this study, the optimal substrate for NC growth is the as-dealloyed NPG with 30–40 nm ligament and nanopore sizes.
Fig. 3a and b are the scanning electron microscope (SEM) and atomic force microscope (AFM) images of the as-dealloyed NPG film. Both ligaments and nanopore channels have a nearly identical diameter of ∼30–40 nm with a quasi-periodic distribution. Facets and nano-scale embossments can be observed on the gold ligament surfaces, and may act as the preferential sites for NC nucleation and growth. Fig. 3c and d show stereoscopic images of NCs with a plating time of 90 minutes and 180 minutes, respectively. For both samples, NCs are uniformly distributed on the surfaces of the NPG substrates. With 90 minutes of plating, the NCs (NC1@NPG) have an average length of ∼40 nm with an apex of ∼10–20 nm (Fig. 3c). The density of the NCs is measured to be 40–46 μm−2, which is higher than or at least comparable to that of the nano-patterns fabricated by lithography and focus ion beam.4 After increasing the plating time further to 180 minutes, the average length of the NCs (NC2@NPG) grows to ∼80 nm but the tip apex remains ∼10–20 nm (Fig. 3d). Although the individual NCs in each sample look slightly different in size, they are very similar to each other in shape and have a nearly constant length to width ratio and a sharp tip apex (see Fig. S1 in the ESI†). Separate TEM characterization reveals that the NCs have a face-centered cubic (f.c.c.) structure, whereas obvious interfaces between the NCs and the NPG substrates cannot be found, further confirming the epitaxial growth mechanisms of the NCs (Fig. 1c). Moreover, chemical analysis indicates that the composition of the NCs is pure gold (see Fig. S2 in the ESI†). The density and size of the NCs can be well controlled by the deposition time (see Fig. S3 in the ESI†) and, in general, a shorter deposition time gives rise to a higher density of NCs with shorter lengths.
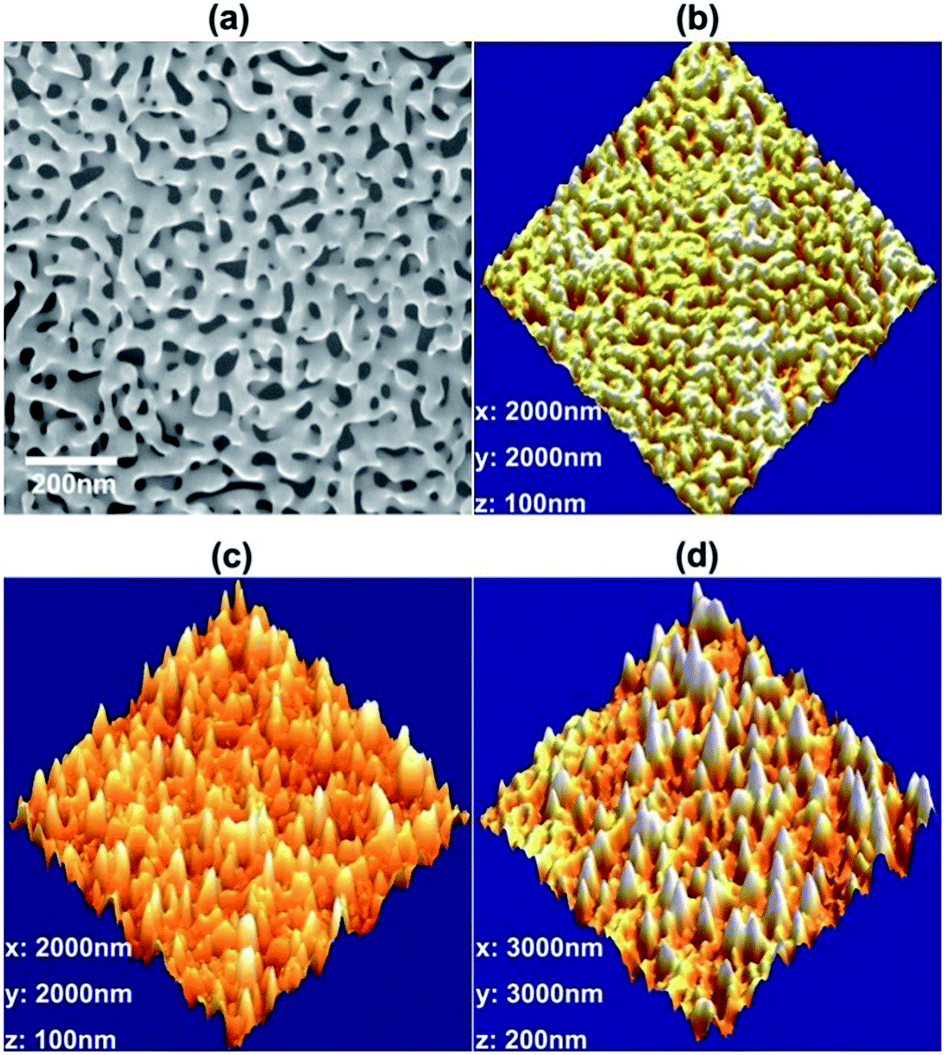 | ||
| Fig. 3 Microstructure of as-dealloyed NPG and NC@NPG. (a) SEM micrograph of the as-prepared NPG; (b) AFM image of as-prepared NPG with a ligament size of 30–40 nm; (c) stereoscopic AFM image of nano-cones on the NPG surface after a plating time of 90 minutes; and (d) AFM image of nano-cones on the NPG surface after a plating time of 180 minutes. | ||
The distribution of electric fields around the apex of a NC is verified by a near-field discrete-dipole approximation (DDA) calculation29 in which a simplified nanostructure with a conical profile representing the key structural feature of individual NCs is introduced to qualitatively simulate the optical properties (Fig. 4a). The nanostructure used in the simulation has the same length to width ratio as determined by experimental measurements and a spherical apex with a diameter of 10 nm. Under a plane wave with a wavelength of 633 nm propagating along the direction that intersects with the perpendicular bisector of the cone by θ = 45°, the near-field (|E|2) distributions are presented in Fig. 4b. A large enhancement of the electric field at the apex of the NC can be observed and the local electromagnetic enhancement factor is approximately 105 from comparing the local maximum intensity with that of the incident light. Also, the coupling effect between adjacent NCs and neighboring ligaments,23 which hasn’t been taken into account in the simulation, might further enhance the electric field intensity. Moreover, the apexes of the NCs bear highly curved features, and these regions have more coordinatively unsaturated atoms that can affect their chemical reactivity and surface bonding properties, acting as preferred binding sites for analyte molecules. Thus, the curved region at the apex is expected to provide an improved chemical effect of an additional two or three orders of magnitude enhancement.30
 | ||
| Fig. 4 Electric field distribution of a nano-cone and SERS performance of NC@NPG. (a) A simplified model of a gold nano-cone for the simulation of the interaction between nano-cone and incident light, d = 80 nm, h = 40 nm, r = 10 nm and θ = 45°; (b) focused electric field at the apex of the nano-cone; (c) SERS spectra of 10−6 M R6G methanol solution from NPG and NC2@NPG with 633 nm excitation at the laser power of 3 mW; and (d) SERS spectra of R6G on NC2@NPG with different incident angles (633 nm excitation, and the laser power of at the sample is about 0.06 mW). The intensity of the electric field is normalized with the energy of incident light (E0), i.e. |E/E0|2. | ||
The dye molecule rhodamine 6G (R6G) in methanol is used to characterize the SERS enhancement of NC@NPG (the details of the SERS experiment are introduced in the experimental methods section). The SERS spectra of R6G are shown in Fig. 4c, in which the strongest band at 613 cm−1 is assigned as an in-plane bending of the xanthene ring.31 High-frequency bands at 1312, 1363, and 1511 cm−1 with large scattering cross-sections are assigned to the stretching modes of aromatic benzene rings. It is worth noting that the NC@NPG substrate shows a dramatically improved SERS enhancement compared to the as-prepared NPG. The Raman intensity of the 1539 cm−1 band is over 20-fold for NC2@NPG and over 10-fold for NC1@NPG higher than for the as-prepared NPG. The differential Raman cross-section of R6G excited at 633 nm (σR6G,SERS) compared to that of methanol (σmeth) can be estimated by the follow equation:32,33
| σR6G,SERS/σmeth = [IR6G/CR6G]/[Imeth/Cmeth], | (1) |
| EF = σR6G,SERS/σR6G,NR | (2) |
The average EF of NC2@NPG is ∼107. Since the SERS intensity is dominantly from a small fraction of molecules adsorbing at the electromagnetic “hot spots”35–38 and the effective area fraction of nano-cones in the detected region is smaller than 1%, the EF of the individual nano-cones is estimated to be ∼108 to 1010. Moreover, consistent with the DDA simulation, the SERS enhancement of NC@NPG strongly depends on the incident angle of the laser beam. When the sample is tilted to 40–50° with respect to the laser beam, the enhancement can be further improved to four times stronger than that obtained with a 90° angle, as shown in Fig. 4d.
The high EF of the NC@NPG film implies possible single molecule detection by the NCs with a sharp apex. Fig. 5 shows the Raman mappings of the specimens with different coverages of R6G molecules. The average surface density of the probe molecules is ∼25 μm−2 of the geometric area of the surface for the 1 × 10⁻¹⁰ M solutions (Fig. 5a and b). The molecule coverage decreases to ∼0.25 μm−2 (Fig. 5c and d) when a 1.0 × 10⁻¹² M solution is used.38 The “hot spots” with strong SERS signals are originating from the apex of the NCs, which are determined by Raman fingerprints from individual bright dots in the Raman mappings. The number density of the “hot spots” is ∼1.6 μm−2 for 10−10 M R6G. Fig. 5b shows examples of the Raman spectra from the “hot spots”. All the Raman bands of R6G can be observed, showing the ensemble of spectral characteristics from multiple molecules. Moreover, the detectable spectral variation in the band intensity and width indicates that the recorded Raman signals from the individual “hot spots” originate from a small number of molecules. When the molecule coverage is further decreased to less than 1 molecule μm−2 using the 1.0 × 10⁻¹² M solution (Fig. 5c), the density of the “hot spots” decreases to 0.01 μm−2. It can be seen that the spectral difference becomes apparent due to the loss of the ensemble average, and indicates that the SERS detection of the individual NCs reaches the single molecule regime. Strong spot-to-spot variation can be observed for all band parameters, including Raman shift, bandwidth, band shape, and absolute and relative intensities (Fig. 5d), which are associated with the dynamics and unique environment of the single molecule as well as the electromagnetic field variation at each “hot spot”. Moreover, the adsorption status of each molecule at the “hot spots” depends on several experimental variables including molecular orientation, surface charge and adsorption kinetics, which also gives rise to unique single-molecule Raman spectra.
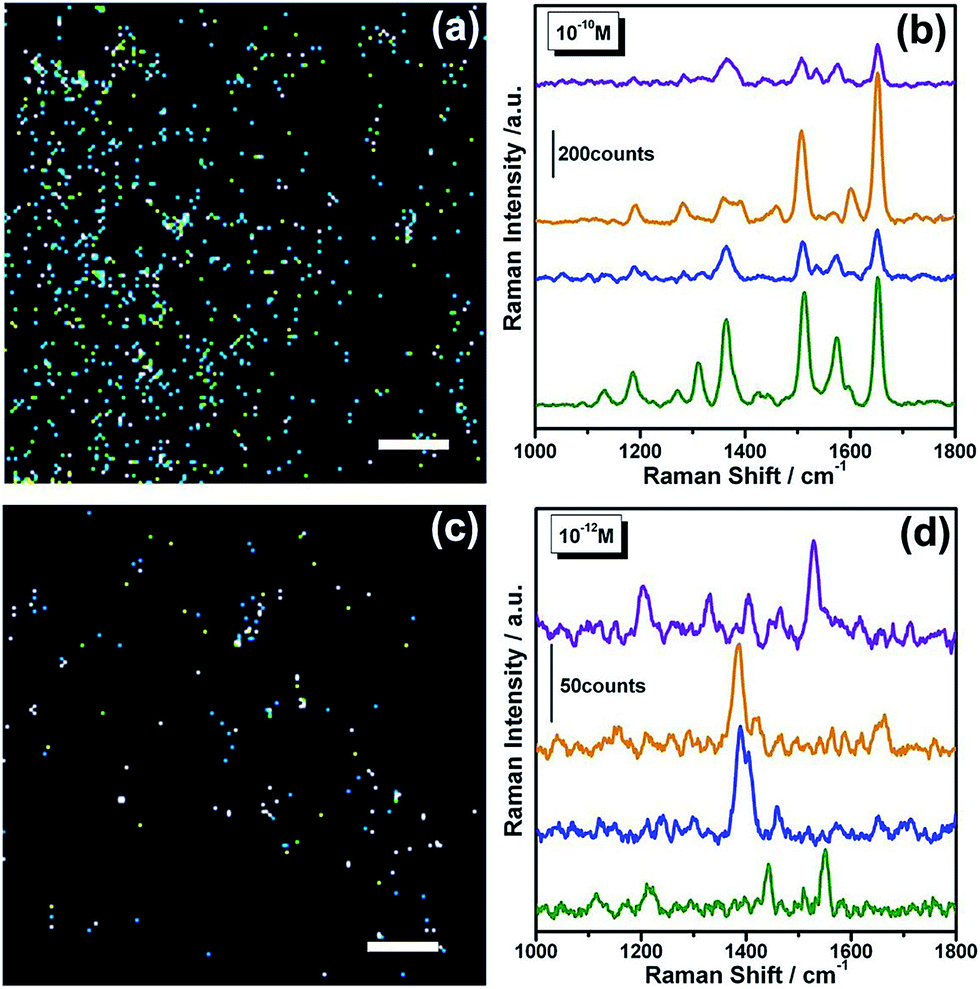 | ||
| Fig. 5 SERS intensity mappings and spectra of R6G on NC2@NPG showing single molecule detection. (a) SERS mapping of 10−10 M R6G; and (b) four selective SERS spectra recorded from different “hot spots”. (c) SERS mapping of 10−12 M R6G; and (d) four selective SERS spectra recorded from different “hot spots”. Mappings are based on the characteristic band of R6G ranging from 600 cm−1 to 1800 cm−1. The scale bars in the maps are 5 μm. | ||
To further confirm the suitability of NC@NPG for single molecule SERS detection, we investigated an optically non-resonant bio-molecule (e.g. adenine) with point laser excitation (Renishaw InVia RM 1000, 633 nm). Fig. 6 shows the SERS spectra of adenine in 10−12 M aqueous solution. The assignments of the characteristic peaks are listed in the ESI (Table S1†). Considering the detective volume as a cylinder with a 15 μm2 bottom area and 110 μm height, the number of estimated detective molecules is less than one. Moreover, spot-to-spot variation can also be observed for all band parameters, which further evidences single adenine molecule detection in aqueous solution.
 | ||
| Fig. 6 Single molecule detection in aqueous solution with NC2@NPG. The left section shows four selective SERS spectra recorded from different “hot spots” on NC2@NPG in 10−12 M adenine aqueous solution, and the right section shows a photo of the experimental set-up for the SERS measurements. | ||
Conclusion
We have developed a facile method to fabricate high density and large scale NCs by utilizing the open nanopore channels of free-standing NPG films. High SERS enhancement can be achieved at the apexes of the NCs for single molecule detection. The biocompatible and free-standing NC@NPG films, with a high density of electromagnetic “hot spots”, hold unique promise for application in ultrasensitive instrumentation for molecular diagnostics and single-molecule analysis.Acknowledgements
This research was sponsored by JST-CREST “Phase Interface Science for Highly Efficient Energy Utilization”; and “World Premier International Research Center (WPI) Initiative” MEXT, Japan.Notes and references
- K. Hering, D. Cialla, K. Ackermann, T. Dörfer, R. Möller, H. Schneidwind, R. Mattheis, W. Fritzsche, P. Rösch and J. Popp, Anal. Bioanal. Chem., 2008, 390, 113–124 CrossRef CAS PubMed.
- N. P. W. Pieczonka and R. F. Aroca, Chem. Soc. Rev., 2008, 37, 946–954 RSC.
- J. M. Banholzer, E. J. Millstone, L. Qin and A. C. Mirkin, Chem. Soc. Rev., 2008, 37, 885–897 RSC.
- D. E. Diebold, P. Peng and E. Mazur, J. Am. Chem. Soc., 2009, 131, 16356–16357 CrossRef PubMed.
- X. Y. Lang, L. Y. Chen, P. F. Guan, T. Fujita and M. W. Chen, Appl. Phys. Lett., 2009, 94, 213109 CrossRef.
- S. J. Biteen, D. Pacifici, S. N. Lewis and H. A. Atwater, Nano Lett., 2005, 5, 1768–1773 CrossRef PubMed.
- D. Graham, G. D. Thompson, E. W. Smith and K. Faulds, Nat. Nanotechnol., 2008, 3, 548–551 CrossRef CAS PubMed.
- D.-K. Lim, K.-S. Jeon, M. H. Kim, J.-M. Nam and D. Y. Suh, Nat. Mater., 2010, 9, 60–67 CrossRef CAS PubMed.
- L. Zhang, X. Y. Lang, A. Hirata and M. W. Chen, ACS Nano, 2011, 5, 4407–4413 CrossRef CAS.
- J. M. Banholzer, D. K. Osberg, S. Li, F. B. Mangelson, C. G. Schatz and A. C. Mirkin, ACS Nano, 2010, 4, 5446–5452 CrossRef PubMed.
- J. Xie, Q. Zhang, Y. J. Lee and I. C. D. Wang, ACS Nano, 2008, 2, 2473–2480 CrossRef CAS PubMed.
- P. F. Liao and A. Wokaun, J. Chem. Phys., 1982, 76, 751–752 CrossRef CAS.
- J. C. Hulteen and R. P. van Duyne, J. Vac. Sci. Technol., A, 1995, 13(3), 1553–1558 Search PubMed.
- D. Cialla, U. Hubner, H. Schneidewind, R. Moller and J. Popp, ChemPhysChem, 2008, 9, 758–762 CrossRef CAS PubMed.
- P. J. Schuck, D. P. Fromm, A. Sundaramurthy, G. S. Kino and W. E. Moerner, Phys. Rev. Lett., 2005, 94, 017402 CrossRef CAS PubMed.
- N. C. Linn, C. H. Sun, A. Arya, B. Jiang and P. Jiang, Nanotechnology, 2009, 20, 225303 CrossRef PubMed.
- V. Guieu, D. Talaga, L. Servant, N. Sojic and F. Lagugné-Labarthet, J. Phys. Chem. C, 2009, 113, 874–881 CAS.
- Y. Yang, M. Tanemura, Z. Huang, D. Jiang, Z. Li, Y. Huang, G. Kawamura, K. Yamaguchi and M. Nogami, Nanotechnology, 2010, 21, 325701 CrossRef PubMed.
- Y. Sawai, B. Takimoto, H. Nabika, K. Ajito and K. Murakoshi, J. Am. Chem. Soc., 2007, 129, 1658–1662 CrossRef CAS PubMed.
- L. H. Qian, X. Q. Yan, T. Fujita, A. Inoue and M. W. Chen, Appl. Phys. Lett., 2007, 90, 153120 CrossRef.
- Y. Ding, Y. Kim and J. Erlebacher, Adv. Mater., 2004, 16, 1897–1900 CrossRef CAS.
- T. Fujita, L. H. Qian, K. Inoke, J. Erlebacher and M. W. Chen, Appl. Phys. Lett., 2008, 92, 251902 CrossRef.
- X. Y. Lang, P. F. Guan, L. Zhang, T. Fujita and M. W. Chen, J. Phys. Chem. C, 2009, 113, 10956–10961 CAS.
- Y. Ding and J. Erlebacher, J. Am. Chem. Soc., 2003, 125, 7772–7773 CrossRef CAS PubMed.
- J. P. Deng, C. Wu, C. H. Yang and C. Y. Mou, Langmuir, 2005, 21, 8947–8951 CrossRef CAS PubMed.
- A. A. Levchenko, B. P. Argo, R. Vidu and R. V. Talroze, Langmuir, 2002, 18, 8464–8471 CrossRef CAS.
- C. H. Kuo, T. F. Chiang, L. J. Chen and M. H. Huang, Langmuir, 2004, 20, 7820–7824 CrossRef CAS PubMed.
- T. Fujita, P. Guan, K. McKeena, X. Y. Lang, A. Hirata, L. Zhang, T. Tokunaga, S. Arai, Y. Yamamoto, N. Tanaka, Y. Ishikawa, N. Asao, Y. Yamamoto, J. Erlebacher and M. W. Chen, Nat. Mater., 2012, 11, 775–780 CrossRef CAS PubMed.
- T. B. Draine and J. P. Flatau, J. Opt. Soc. Am. A, 1994, 11, 1491–1499 CrossRef.
- M. Moskovits, Rev. Mod. Phys., 1985, 57, 783–826 CrossRef CAS.
- H. Watanabe, N. Hayazawa, Y. Inouye and S. Kawata, J. Phys. Chem. B, 2005, 109, 5012–5020 CrossRef CAS PubMed.
- S. H. Ciou, Y. W. Cao, H. C. Huang, D. Y. Su and C. L. Huang, J. Phys. Chem. C, 2009, 113, 9520–9525 CAS.
- A. Kudelski, Chem. Phys. Lett., 2005, 414, 271–275 CrossRef CAS.
- S. Shim, M. C. Stuart and A. R. Mathies, ChemPhysChem, 2008, 9, 697–699 CrossRef CAS PubMed.
- Y. Fang, N.-H. Seong and D. D. Dlott, Science, 2008, 321, 388–392 CrossRef CAS PubMed.
- M. S. Wells, D. S. Retterer, M. J. Oran and J. M. Sepaniak, ACS Nano, 2009, 3, 2845–2853 CrossRef PubMed.
- M. Hu, S. F. Ou, W. Wu, I. Naumov, X. Li, M. A. Bratkovsky, R. S. Williams and Z. Li, J. Am. Chem. Soc., 2010, 132, 12820–12822 CrossRef CAS PubMed.
- H. W. Liu, L. Zhang, X. Y. Lang, Y. Yamaguchi, H. Iwasaki, Y. Inouye, Q. K. Xue and M. W. Chen, Sci. Rep., 2011, 1, 112–116 Search PubMed.
Footnotes |
| † Electronic supplementary information (ESI) available: Size, shape and chemical analysis of the nanocones are shown in ESI. See DOI: 10.1039/c5ra22321k |
| ‡ These authors contributed equally to this work. |
| This journal is © The Royal Society of Chemistry 2016 |