DOI:
10.1039/C5RA22274E
(Paper)
RSC Adv., 2016,
6, 5408-5418
Intercalation of the daphnetin–Cu(II) complex with calf thymus DNA
Received
24th October 2015
, Accepted 3rd January 2016
First published on 7th January 2016
Abstract
Daphnetin is an important and naturally occurring coumarin compound with potent biological activities. Herein, the coordination between daphnetin and Cu2+ and the in vitro interaction of the daphnetin–Cu(II) complex with calf thymus DNA (ctDNA) were investigated by multivariate curve resolution-alternating least squares chemometrics combined with multiple spectroscopy, ctDNA thermal denaturation and viscosity studies, and visualized by molecular modeling. The results showed that the daphnetin–Cu(II) complex with a stoichiometry of 1![[thin space (1/6-em)]](https://www.rsc.org/images/entities/char_2009.gif) :1 was formed and its fluorescence was quenched by ctDNA. The intercalation mode of the daphnetin–Cu(II) complex to ctDNA was demonstrated by the increases in DNA viscosity and melting temperature, and competitive binding between the daphnetin–Cu(II) complex and the fluorescence probe ethidium bromide with ctDNA. The analysis of Fourier transformed infrared spectra showed that the A–T bases region of ctDNA was the main binding site for the daphnetin–Cu(II) complex, and the interaction induced the reduction of helicity and base stacking, but the B-form of ctDNA was not changed. Moreover, a DNA cleavage assay suggested that the daphnetin–Cu(II) complex caused cleavage of plasmid DNA due to its strong binding to DNA. This study is expected to offer useful information for understanding the interaction mechanism of the daphnetin–Cu(II) complex with ctDNA, and may provide novel insights into the synergistic effect between daphnetin and Cu2+ in exerting their pharmacological function.
:1 was formed and its fluorescence was quenched by ctDNA. The intercalation mode of the daphnetin–Cu(II) complex to ctDNA was demonstrated by the increases in DNA viscosity and melting temperature, and competitive binding between the daphnetin–Cu(II) complex and the fluorescence probe ethidium bromide with ctDNA. The analysis of Fourier transformed infrared spectra showed that the A–T bases region of ctDNA was the main binding site for the daphnetin–Cu(II) complex, and the interaction induced the reduction of helicity and base stacking, but the B-form of ctDNA was not changed. Moreover, a DNA cleavage assay suggested that the daphnetin–Cu(II) complex caused cleavage of plasmid DNA due to its strong binding to DNA. This study is expected to offer useful information for understanding the interaction mechanism of the daphnetin–Cu(II) complex with ctDNA, and may provide novel insights into the synergistic effect between daphnetin and Cu2+ in exerting their pharmacological function.
1. Introduction
DNA is the primary carrier of all genetic information and its core role is storage and replication of genes. During the processes of transcription, translation and the construction of each protein required by individual cells, DNA provides the “master genetic blueprint”. Small molecules and/or proteins that bind to nucleic acids in site-specific ways could initiate, regulate and terminate these processes. Consequently, compounds that interact with nucleic acids have been found with a variety of uses as biophysical and therapeutic agents.1
In many ways, coordination complexes are ideal templates for the design of DNA-interactive systems and the investigation of the interaction of these structural complexes with DNA. Transition metals, Cu or Fe, can be complexed with the dihydroxyl group of the polyphenols. Such complexation has the ability to bind to and cleave DNA, and thus interfere with the essential cellular processes of transcription and translation, which means that these systems could also be developed as potential therapeutics.2 Further it was reported that binding to metal ions could prominently enhance the biological activity of some coumarin derivatives. Also, it was found that in some cases the metal complexes showed higher biological activities than their ligands.3
Daphnetin (C9H6O4) is an important and naturally occurring coumarin compound isolated from Daphne koreane Nakai with potent biological activities, such as anti-inflammatory, antimicrobial, antioxidant, anticancer and immunomodulating activities.4,5 Due to the selective permeability of cancer cell membranes to copper compounds, it makes copper to accumulate in tumours. Thus, many copper complexes have been screened for anti-cancer activity, and some of them were found active both in vivo and in vitro.6
Our previous studies have found that daphnetin could bind to the A–T rich region of DNA via groove binding mode, lead to the conformational change of ctDNA from B-form to A-form.7 The present study was aimed at extending our previous work and to provide useful information on the interaction mechanism of daphnetin–Cu(II) complex with DNA. The UV-vis absorption spectroscopy combining with multivariate curve resolution-alternating least squares (MCR-ALS) approach was used to characterize the coordination of daphnetin with Cu2+. A variety of different spectroscopic techniques including fluorescence, UV-vis absorption, circular dichroism (CD) and Fourier-transform infrared (FT-IR) spectroscopy along with DNA thermal denaturation, viscosity, cleavage studies and molecular modeling were used to investigate the binding ability and properties of daphnetin–Cu(II) complex to ctDNA.
2. Materials and methods
2.1. Materials
Daphnetin (analytical grade) was purchased from National Institute for the Control of Pharmaceutical and Biological Products (Beijing, China), and its stock solution (2.25 × 10⁻³ mol L−1) was prepared in absolute ethanol. The stock solution of ctDNA (Sigma Chemical Co., USA) was prepared by dissolving an appropriate amount of ctDNA in 0.1 mol L−1 NaCl solution, and the concentration was determined to be 2.56 × 10⁻³ mol L−1 by UV-vis absorption at 260 nm using a molar absorption coefficient ε260 = 6600 L mol−1 cm−1.8 The DNA solution was sufficiently free from protein because the ratio of the absorbance at 260/280 nm (A260/A280) was greater than 1.8.9 Supercoiled pUC18 plasmid DNA was obtained from Beijing Solarbio Science and Technology Ltd (Beijing, China). Daphnetin–Cu(II) complex solution (2.25 × 10⁻³ mol L−1) was prepared by mixing daphnetin with Cu(II), which contained the same amount of daphnetin and Cu(II). Ethidium bromide (EB, Sigma Chemical Co., USA) stock solution was prepared in pure water. All the experiments were carried out in 0.05 mol L−1 Tris–HCl buffer, pH 7.4. All other reagents used were of analytical purity or higher reagent grade. The deionized water was produced by a Millipore Ultrapure Water Purification System (Millipore, Molsheim, France). All stock solutions were kept in a refrigerator at 0–4 °C.
2.2. Experimental procedures
2.2.1. Absorption spectrophotometry. The UV-vis absorption spectra were recorded at room temperature on a Shimadzu UV-2450 spectrophotometer (Shimadzu, Japan) over a wavelength range of 225–500 nm with 1 nm interval.The formation of daphnetin–Cu(II) complex was determined by analyzing absorption data obtained from the two experiments with the help of MCR-ALS method. The daphnetin solution at a constant concentration was titrated with increasing amounts of Cu2+ (0 to 1.03 × 10⁻⁴ mol L−1 at an interval of 3.33 × 10⁻⁶ mol L−1, total 33 solutions) for the fist experiment, and in turn different concentrations of daphnetin (0 to 1.20 × 10⁻⁴ mol L−1 at an interval of 3.75 × 10⁻⁶ mol L−1, total 33 solutions) were added into the Cu2+ solution with a fixed concentration for the second experiment. Thus, two matrices, Ddaphnetin (33 × 276) and DCu2+ (33 × 276) composed of UV-vis absorption spectral data were obtained from the two titration methods above, respectively, and were combined to construct a column-wise expanded data matrix [Ddaphnetin, DCu2+].
The ratio of daphnetin to Cu2+ was determined via mole ratio method, and the solution of daphnetin–Cu(II) complex was prepared by adjusting the mole ratio of [daphnetin]/[Cu2+] to be 1:1 at a given concentration with Tris–HCl buffer. The interaction of daphnetin–Cu(II) complex with ctDNA was detected according to the changes in absorption spectra of daphnetin–Cu(II) after adding various aliquots of ctDNA.
2.2.2. Viscosity measurements. Viscosity titrations were made on an Ubbelohde viscometer (φ 0.7–0.8 mm, Shanghai Qianfeng Rubber and Glass Co., Shanghai, China), immersed in a thermostated water-bath maintained at a constant temperature at 25 ± 0.1 °C. Flow time was measured with a digital stop watch after titrating increasing amounts of daphnetin–Cu(II) into ctDNA solution with a constant concentration, and the mean values of five replicated measurements were used to evaluate the viscosity of free ctDNA and its mixtures with different molar ratios of daphnetin–Cu(II) or EB to ctDNA ([M]/[ctDNA]). The data are presented as (η/η0)1/3 versus r (r = [M]/[ctDNA]), where η represents the viscosity of ctDNA in the presence of daphnetin–Cu(II) or EB, and η0 is the viscosity of ctDNA alone in buffer solution. The equation of η = (t − t0)/t0 was used to calculate viscosity values by correcting the flow time of buffer (t0) from that of ctDNA containing solutions (t).10
2.2.3. Thermal denaturation studies. DNA thermal denaturation studies were carried out in the absence and presence of the daphnetin–Cu(II) complex by measuring UV absorbance at 260 nm in the temperature range from 20 to 100 °C with temperature increments of 4 °C. The melting temperature (Tm) of DNA was obtained as the mid point of the curves plotted fss = (A − A0)/(Af − A0) versus temperature (T), where A0, Af and A represent the initial absorbance, the final absorbance and the observed absorbance corresponding to its temperature, respectively.11
2.2.4. Fluorescence measurements. Fluorescence spectra were scanned on a Hitachi spectrofluorometer model F-7000 (Hitachi, Japan) equipped with a 1.0 cm path-length quartz cell and a circulating water bath. Both the excitation and emission bandwidths were set at 2.5 nm for all the measurements.The competitive interaction between daphnetin–Cu(II) and EB with ctDNA was carried out by two steps. Firstly, increasing amounts of daphnetin–Cu(II) (total of 11 samples) were added into the ctDNA–EB complex with a constant concentration (total of 11 samples). Secondly, the mixture of ctDNA with different amounts of daphnetin–Cu(II) was successively titrated by EB. The fluorescence spectra were recorded over the wavelength range of 550–750 nm with the excitation wavelength of 525 nm at 298 K.
Fluorescence titration of daphnetin–Cu(II) complex was conducted upon increasing amounts of ctDNA with a final concentration of 4.27 × 10⁻⁵ mol L−1. The fluorescence spectra were measured at four temperatures (292, 298, 304 and 310 K) in the wavelength range of 280–420 nm by exciting at 250 nm. The fluorescence data were corrected for absorption of excitation light and emitted light to eliminate the re-absorption and inner filter effect caused by UV-vis absorption according to the relationship:12
where
Fc and
Fm represent the corrected and measured fluorescence, respectively.
A1 and
A2 are the absorbance of the ctDNA solutions at excitation and emission wavelengths, respectively.
2.2.5. CD spectroscopy. CD spectra of ctDNA in the absence and presence of different amounts of the daphnetin–Cu(II) complex were measured at room temperature under constant nitrogen flush on a Bio-Logic MOS 450 CD spectrometer (Bio-Logic, Claix, France) using a 1.0 mm path length quartz curette. The spectra were recorded in the range of 220–320 nm. All observed CD spectra were corrected for the Tris–HCl buffer signal.
2.2.6. FT-IR spectroscopy. A FT-IR spectrometer (Thermo Nicolet-5700, USA) equipped with a germanium attenuated total reflection (ATR) accessory, a DTGS (deuterated triglycine sulphate) KBr detector and a KBr beam splitter was applied to record infrared spectra. The spectra of the sample solutions at different daphnetin–Cu(II)/ctDNA molar ratios were measured at room temperature based on the collected background spectrum as interferogram. The infrared difference spectra [(ctDNA solution + daphnetin–Cu(II) solution) − daphnetin–Cu(II) solution] were obtained by subtracting the spectrum of free daphnetin–Cu(II) from the spectrum of mixture at different daphnetin–Cu(II)/ctDNA molar ratios over the spectral range of 1800–800 cm−1 and analyzed using OMNIC software. The relative intensities (R) of several peaks of DNA in-plane vibrations related to base pairs and phosphate stretching vibrations were obtained by peak normalization using:| |
 | (2) |
here Ii is the intensity of absorption peak at i cm−1 for pure ctDNA and ctDNA in the complex at different concentrations of daphnetin–Cu(II), and I968 is the intensity of the 968 cm−1 peak (internal reference band).13
2.2.7. Molecular docking. A binding model between daphnetin–Cu(II) and ctDNA was generated by Autodock (Version 4.2) software. The structure of B-DNA with identifier of 453D was downloaded from the Protein Data Bank. With the help of the MMFF94 force field, the 3D structure of daphnetin–Cu(II) was energy-minimized in Sybyl X 1.1 (Tripos Inc., St. Louis, USA), and converted to the PDB format. Before running the docking, the water molecules were removed and essential polar hydrogen atoms and Gasteiger charges were added to the PDB file. The space enclosed DNA was defined to be 0.375 Å, and the docking was carried out using Lamarckian Genetic Algorithm (LGA).
2.2.8. DNA cleavage assay. The cleavage of DNA in the absence and presence of daphnetin–Cu(II) was detected by using agarose gel electrophoresis. Supercoiled pUC18 plasmid DNA was treated with different concentrations of daphnetin–Cu(II) and diluted with Tris–HCl (pH 7.4). After being incubated for 24 h at 37 °C, the samples of DNA and daphnetin–Cu(II)–DNA complex were mixed with a loading buffer containing of 0.03% bromophenol blue, 0.03% xylene cyanol and 30% glycerol, and migrated in 1.0% agarose gels which was then stained with GoldView. The electrophoresis was performed at 100 V for 0.5 h in 1× Tris–acetate–EDTA (TAE) buffer, and photographed by a UV illumination.
2.2.9. The method of chemometrics: multivariate curve resolution-alternating least-squares (MCR-ALS) algorithm. MCR is based on a linear model that assumes the response additivity of all absorption components in the samples measured. MCR-ALS is an effective and efficient multivariate self modeling curve resolution method which can be used to analyze an augmented data matrix containing data recorded over several experiments.14 The experimental data matrix is mathematically decomposed into two factor matrix with the use of the following algebraic mode:where D (n, m) is the data matrix made up n row and m columns, each n is made up of a spectrum and each m gives the wavelengths. C (n, q) is the concentration matrix describing the evolution of the q chemical components in the samples. Matrix ST (q, m) is the spectroscopic matrix consisting of the pure emission spectra. E (n, m) is the residual matrix with data variation not explained by the proposed contributions.15Before the alternating least squares iterative process begins, the number of compounds was estimated by singular value decomposition (SVD) analysis.16 Only larger principal components sufficiently explain the experimental data based on the assumption that the variance explained by chemical compounds is larger than that of noise. Then, the initial estimates of concentration profiles are obtained by evolving factor analysis (EFA).17 Once the pure variables have been determined, the corresponding pure species spectra and their concentration evolutions can be achieved by the MCR-ALS analysis.
3. Results and discussion
3.1 Absorption spectra studies on the formation of daphnetin–Cu(II) complex
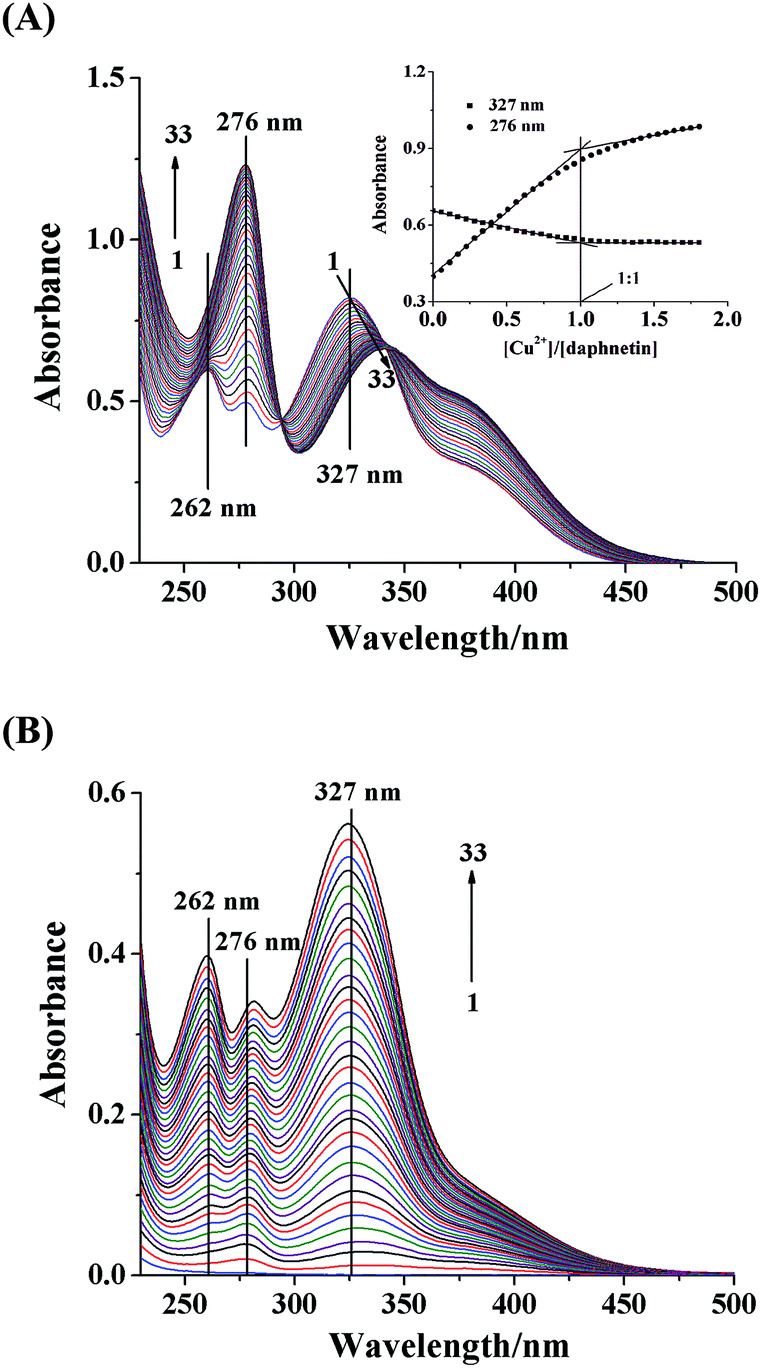
The absorption bands of daphnetin are located at 262 nm, 276 nm and 327 nm, respectively. The absorbance at 276 nm showed an evident hyperchromic effect, while that at 327 nm decreased with the addition of Cu2+, and there were two isoabsorptive points at 294 nm and 341 nm, indicating the formation of daphnetin–Cu(II) complex.18 The band at 327 nm red shifted significantly by 11 nm, which may be due to the extension of the conjugated system with complexation. Therefore, it seemed that Cu2+ coordinated with two adjacent hydroxyl groups of daphnetin to form five-membered ring complexes.19 The curves of absorbance versus [Cu2+]/[daphnetin] molar ratio plotted at 276 and 327 nm were used to determine a stoichiometry of 1:1 for the complex (inset of Fig. 1A). As shown in Fig. 1B, there is no absorption peak of Cu2+ in the absence of daphnetin, however, the similar spectra to that of daphnetin were observed with the addition of daphnetin. For the sake of extracting useful information and dynamic changes of the daphnetin–Cu(II) coordination, the expanded spectral data matrix [Ddaphnetin, DCu2+], was resolved by MCR-ALS method. Non-negativity constraint was used for both the concentration and spectral profiles and the known concentrations of daphnetin and/or Cu2+ were included as a closure constraint for the concentration profiles.
 |
| | Fig. 1 Spectra obtained from two different experiments. (A) Experiment 1: absorption data matrix Ddaphnetin (33 × 276), the concentration of daphnetin was 5.85 × 10⁻⁵ mol L−1, and Cu2+ was added to a final concentration of 1.03 × 10⁻⁴ mol L−1 in increment of 3.33 × 10⁻⁶ mol L−1 for curves 1–33, respectively; inset was the plot of changes in absorbance at 276 and 327 nm with the increasing ratios of [Cu2+]/[daphnetin]. (B) Experiment 2: absorption data matrix DCu2+ (33 × 276), the concentration of Cu2+ was kept at 6.00 × 10⁻⁵ mol L−1 and daphnetin was titrated into the solution in increment of 3.75 × 10⁻⁶ mol L−1 with a final concentration of 1.20 × 10⁻⁴ mol L−1 for curves 1–33, respectively. | |
3.2. Interpretation by MCR-ALS
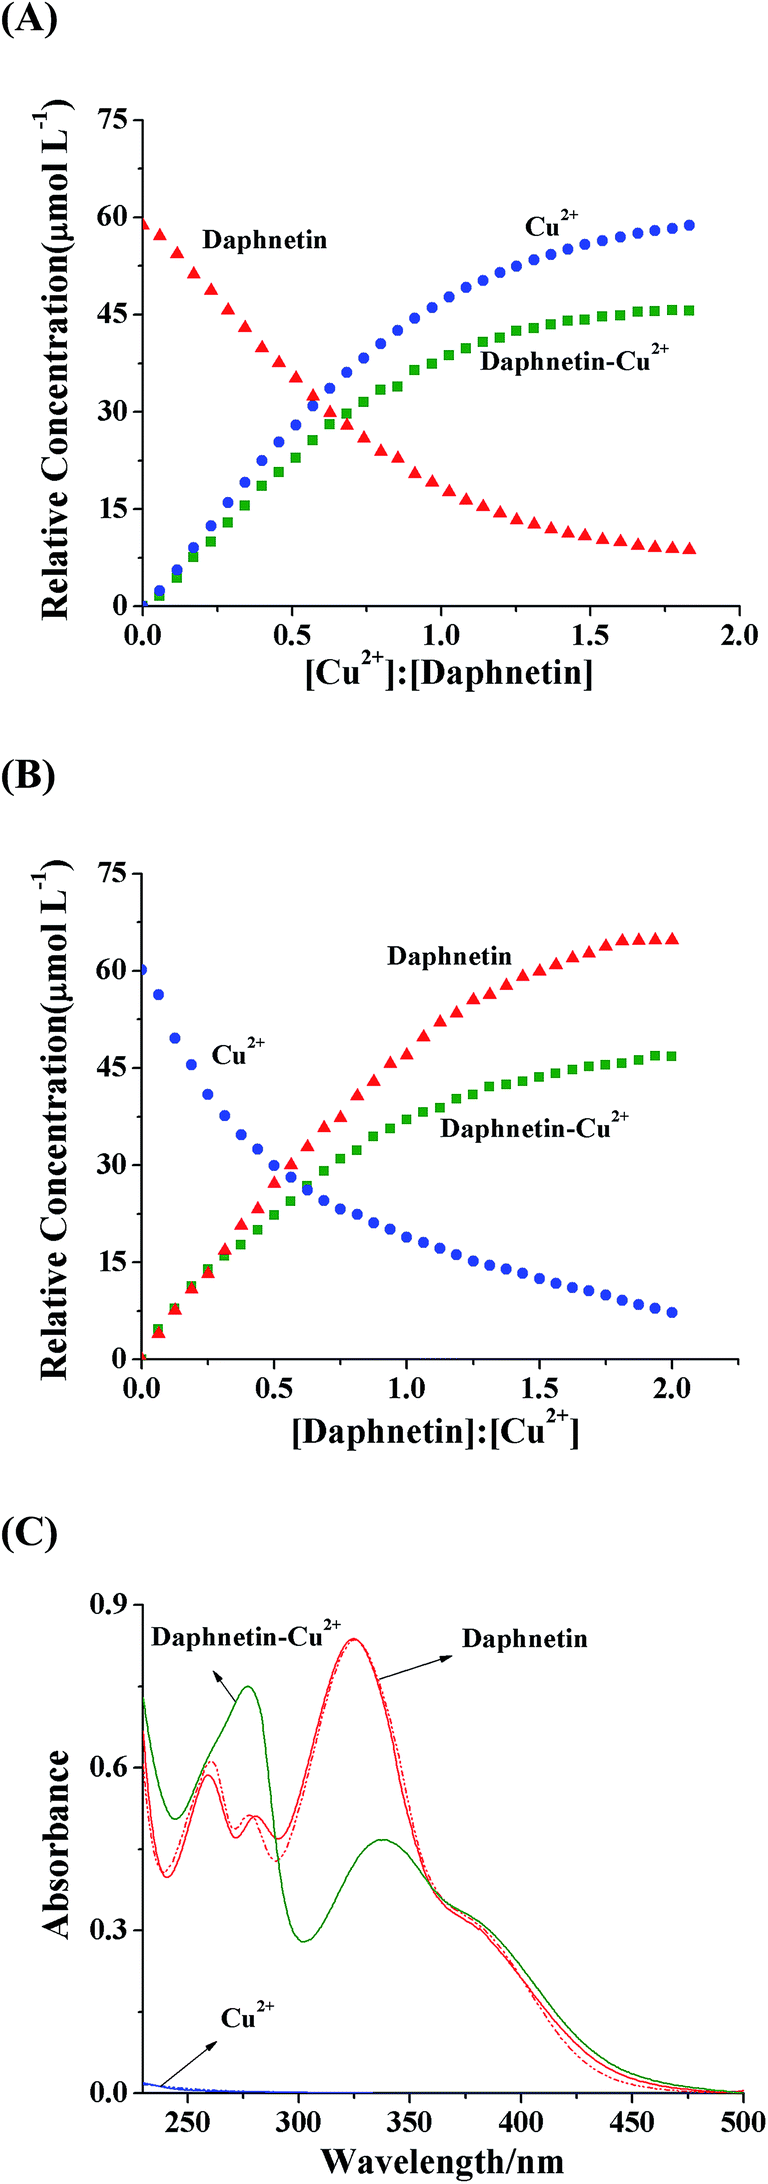
With the use of SVD method, three significant factors (daphnetin, Cu2+ and daphnetin–Cu(II) complex) existing in the system were determined because the first three eigenvalues (453.00, 410.68 and 400.87) were much larger than the fourth one (36.43). The initial indication of the changes to the concentration profiles of the components in the mixture was provided by using the EFA method.20 The concentration of daphnetin showed a decreasing tendency, meanwhile the concentration of the daphnetin–Cu(II) complex increased with the addition of increasing amounts of Cu2+ (Fig. 2A). In contrast, with the addition of daphnetin, the concentration of Cu2+ decreased, accompanied by an increase in the daphnetin–Cu(II) complex concentration (Fig. 2B). Moreover, the extracted spectra (solid line, Fig. 2C) of Cu2+ and daphnetin exhibited a good consistency with their measured spectra (dashed line, Fig. 2C), suggesting that the concentration profiles were accurately resolved. It is worth mentioning that the UV-vis absorption spectrum for daphnetin–Cu(II) complex was extracted by the MCR-ALS algorithm, which was difficult to obtain by conventional absorption spectrophotometry. All these results proved the formation of the daphnetin–Cu(II) complex and provided an indirect and quantitative estimate of interaction processes between daphnetin and Cu2+.
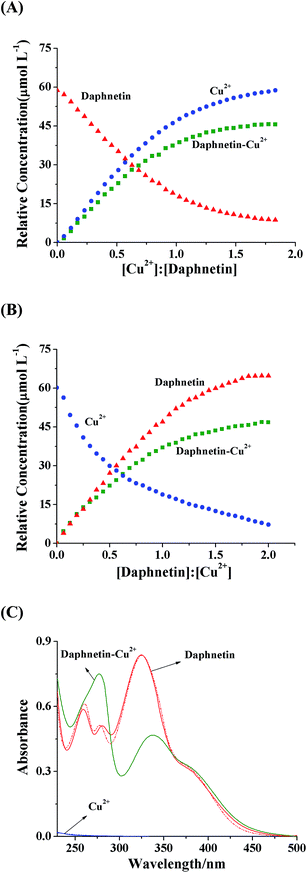 |
| | Fig. 2 Equilibrium concentration profiles for the titration of daphnetin with Cu2+ (A) and the titration of Cu2+ with daphnetin (B). (C) Recovered UV-vis absorption spectra for daphnetin, Cu2+ and daphnetin–Cu(II) complex; solid line: resolved spectra from MCR-ALS; dashed line: measured spectra in the experiments. | |
3.3. UV-vis spectra of interaction between daphnetin–Cu(II) complex and ctDNA
Two absorption peaks of the daphnetin–Cu(II) complex at 278 nm and 338 nm were observed (Fig. 3A). After adding increasing amounts of ctDNA, the peak at 278 nm showed significant hyperchromic effect and the peak position blue shifted to 274 nm. This phenomenon may be caused by the spectral superposition of ctDNA due to the peak at 260 nm resulting from strong absorption of purine and pyrimidine bases. At the same time, the absorption intensity at 338 nm decreased (hypochromic effect) accompanied by blue shift toward 336 nm and there was an isosbestic point at 308 nm, which provided an evidence for the occurrence of the interaction between daphnetin–Cu(II) complex and ctDNA.21 Hypochromic effect in UV-vis spectra upon ligand binding to DNA is a typical characteristic of an intercalating mode,22,23 which suggested that the mode of daphnetin–Cu(II) complex binding to ctDNA may be due to an intercalation.
 |
| | Fig. 3 (A) UV-vis absorption spectra of daphnetin–Cu(II) complex in the absence and presence of increasing amounts of ctDNA at pH 7.4. c(daphnetin–Cu(II)) = 5.85 × 10⁻⁵ mol L−1, and c(ctDNA) = 0, 0.85, 1.71, 2.56, 3.41, 4.27, 5.12, 5.97, 6.83, 7.68, 8.53 × 10⁻⁵ mol L−1 for 1 → 11. (B) Effect of increasing amount of daphnetin–Cu(II) complex on the relative viscosity of ctDNA at pH 7.4. c(ctDNA) = 1.71 × 10⁻⁵ mol L−1. (C) Thermal denaturation plots of ctDNA in the absence and presence of daphnetin–Cu(II) complex at pH 7.4. c(daphnetin–Cu(II)) = 5.85 × 10⁻⁵ mol L−1, and c(ctDNA) = 1.71 × 10⁻⁵ mol L−1. | |
3.4. Viscosity
DNA viscosity measurement upon addition of a compound is an useful and the least ambiguous means of determining the mode of interaction between a compound and DNA due to its sensitivity to length change of DNA.24 Classical intercalative molecules usually led to an increase of DNA viscosity by separating base pairs to accommodate and lengthen DNA helix, while partial intercalators decreased DNA viscosity by bending through wedging, minor groove and electrostatic binders causing little change in viscosity.25,26 As shown in Fig. 3B, the ctDNA viscosity gradually increased with the addition of daphnetin–Cu(II) complex, and the changes were similar to that caused by EB, a typical intercalator, in the same range of [M]/[ctDNA] ratios. This result suggested that daphnetin–Cu(II) complex might be an intercalator with the same binding mode to ctDNA as EB.
3.5. Thermal denaturation
The double-helical structure of DNA is stable since it contains hydrogen bonding and base stacking interaction. Because of damages to these chemical forces caused by heat, the double-helix dissociates to single strands upon the increase in temperature. The temperature at which a half of a DNA sample is dissociated into single strands is defined as melting temperature (Tm), and is strongly related to the stability of the double-helical structure.27 As interaction of complexes with DNA may change Tm, the study of DNA thermal denaturation provides a means of detecting DNA-binding mode and assessing relative binding strength. Typically, intercalation could give rise to a significant increase in Tm of DNA (ΔTm 5–8 °C) due to the enhancement of stabilization of the duplex structure, whereas groove binding or electrostatic binding caused little effect on Tm.28 The Tm values for the free ctDNA and ctDNA in the presence of daphnetin–Cu(II) complex were 84.5 °C and 89.5 °C (obtained from Fig. 3C), respectively. The change in Tm indicated that the binding mode of daphnetin–Cu(II) complex to ctDNA was an intercalation and the stability of ctDNA was strengthened.
3.6. Competitive studies with EB
EB is a typical probe of intercalation, which can emit intense fluorescence in the presence of ctDNA on account of intercalation of the planar phenanthridine ring between adjacent aromatic rings of base pairs.29 With the addition of another intercalator, the competitive binding of the intercalator to ctDNA should result in a displacement of the intercalating EB from ctDNA and a quenching of the ctDNA–EB emission intensity.30 Fig. 4A shows the emission spectra of ctDNA–EB complex in the absence and presence of daphnetin–Cu(II) complex. It is evident that fluorescence intensity of ctDNA–EB complex decreased gradually with successive addition of daphnetin–Cu(II) complex (quenching ratio was 50.1% when daphnetin–Cu(II) concentration reached 8.25 × 10⁻⁵ mol L−1), indicating that the EB was partially displaced from the ctDNA–EB complex by daphnetin–Cu(II) complex.
 |
| | Fig. 4 (A) Fluorescence spectra of the competitive binding between daphnetin–Cu(II) complex and EB with ctDNA (λex = 525 nm, λem = 595 nm). c(ctDNA) = 6.8 × 10⁻⁵ mol L−1, c(EB) = 4.0 × 10⁻⁵ mol L−1, and c(daphnetin–Cu(II)) = 0, 0.75, 1.50, 2.25, 3.00, 3.75, 4.50, 5.25, 6.00, 6.75, 7.50, 8.25 × 10⁻⁵ mol L−1 corresponding to the curves from 1 to 12, respectively. (B) Scatchard plots for the binding of EB with ctDNA in the absence and presence of increasing the concentration of daphnetin–Cu(II) complex. c(ctDNA) = 2.56 × 10⁻⁵ mol L−1, and c(EB) = 0, 0.33, 0.67, 1.00, 1.33, 1.67, 2.00, 2.33, 2.67, 3.00, 3.33 × 10⁻⁶ mol L−1. | |
To further determine the intercalation of daphnetin–Cu(II) to ctDNA and impact of daphnetin–Cu(II) on EB intercalating into ctDNA, the fluorescence titration of EB with ctDNA in the presence of various amounts of daphnetin–Cu(II) complex was performed. Scatchard equation was used to analyze the fluorescence data as follows:
where
Cf and
Cb are the molar concentration of free EB and bound EB.
KEB and
n denote the binding constant of EB with ctDNA and the number of binding sites per nucleotide, respectively.
31 The values of
KEB and
n obtained from the linear regression of
r/
Cf versus r in the Scatchard plots (
Fig. 4B) are listed in
Table 1. The values of
KEB and
n decreased with increasing molar ratios of daphnetin–Cu(
II) complex to ctDNA, suggesting that the binding ability of EB to ctDNA was weakened and EB was not easy to intercalate into ctDNA in the presence of daphnetin–Cu(
II) complex.
32 Above experimental results further confirmed an intercalative binding mode of daphnetin–Cu(
II) complex with ctDNA. According to our previous study, the binding mode of daphnetin to ctDNA was groove binding. Therefore, the presence of Cu
2+ led to a switch of DNA-binding mode from an external type to a stronger and internal type.
Table 1 Binding parameters of EB to ctDNA in the presence of various amount of daphnetin–Cu(II) complex
| [ctDNA]/[daphnetin–Cu(II)] |
KEB (L mol−1) |
n |
| 1:0 |
1.71 × 10⁵ |
0.093 |
| 1:0.5 |
1.13 × 10⁵ |
0.084 |
| 1:1 |
0.75 × 10⁵ |
0.080 |
| 1:2 |
0.42 × 10⁵ |
0.065 |
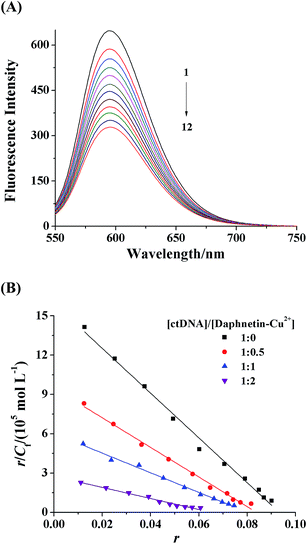
3.7. Steady-state fluorescence quenching of daphnetin–Cu(II) complex by ctDNA and binding parameters
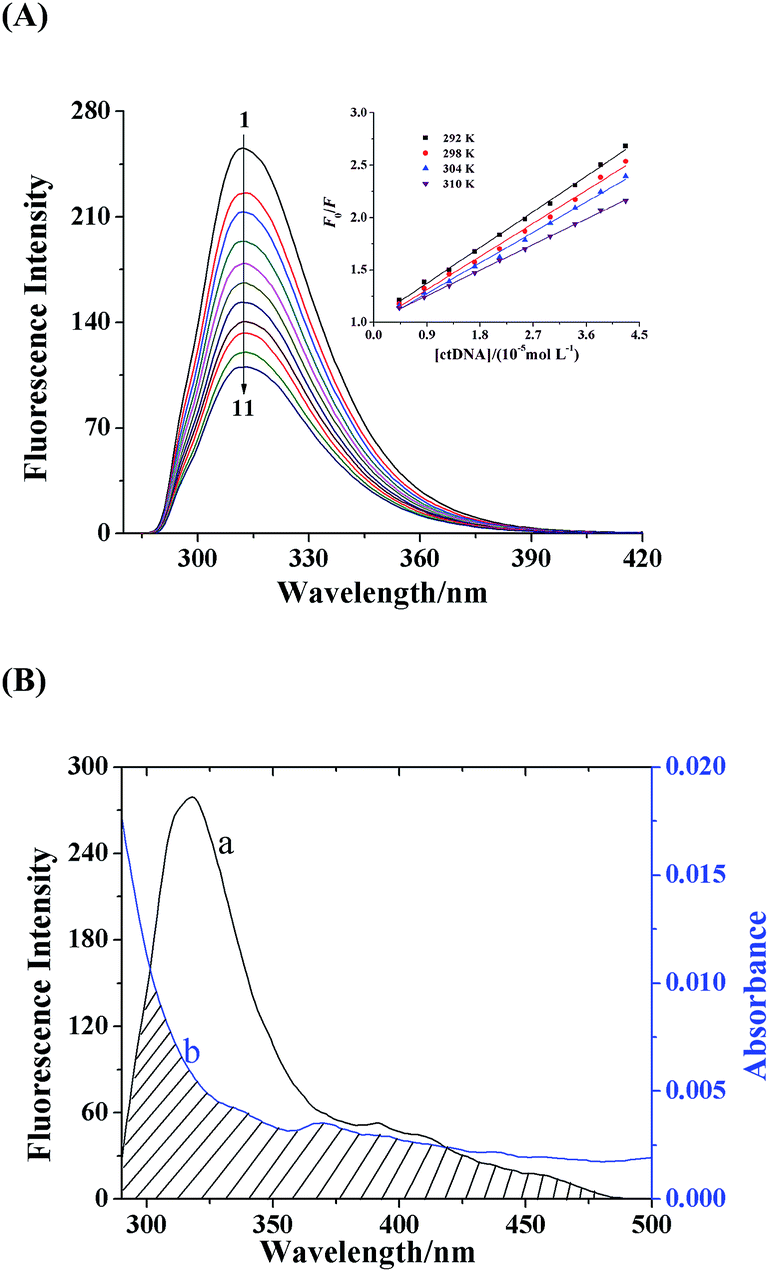
The fluorescence technique is a sensitive and efficient method to investigate the interaction of DNA with ligand. The properties of binding between daphnetin–Cu(II) complex and ctDNA were determined by fluorescence quenching experiments. As shown in Fig. 5A, the daphnetin–Cu(II) complex displayed a strong fluorescence emission peak at 312 nm with exciting wavelength at 250 nm. Upon increasing concentration of ctDNA, the fluorescence intensity of daphnetin–Cu(II) complex decreased remarkably, indicating an interaction of daphnetin–Cu(II) with ctDNA.
 |
| | Fig. 5 (A) Fluorescence spectra of daphnetin–Cu(II) complex in the absence and presence of ctDNA (pH 7.4, T = 298 K, λex = 250 nm, λem = 312 nm). c(daphnetin–Cu(II)) = 5.85 × 10⁻⁵ mol L−1, and c(ctDNA) = 0, 0.43, 0.85, 1.28, 1.71, 2.13, 2.56, 2.99, 3.41, 3.84 and 4.27 × 10⁻⁵ mol L−1 corresponding to the curves from 1 to 11, respectively. Stern–Volmer plots for the fluorescence quenching of daphnetin–Cu(II) complex by ctDNA at four different temperatures were shown in the inset. (B) Overlapping of the fluorescence spectrum (a) of daphnetin–Cu(II) complex with the absorption spectrum (b) of ctDNA. c(daphnetin–Cu(II)) = c(ctDNA) = 5.85 × 10⁻⁶ mol L−1. | |
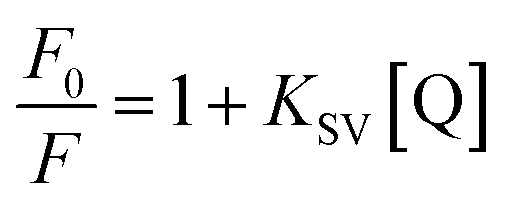
In general, fluorescence quenching is attributed to a variety of molecular interactions including excited-state reactions, energy transfer, ground-state complex formation and collisional quenching, which can be classified as either dynamic quenching or static quenching and differentiated through their temperature dependence.33,34 Then the fluorescence quenching obtained at four different temperatures (292, 298, 304 and 310 K) were analyzed by Stern–Volmer equation to determine the fluorescence quenching mechanism:35
| |
 | (6) |
where
F0 and
F are the steady-state fluorescence intensities of daphnetin–Cu(
II) in the absence and presence of ctDNA, respectively.
KSV is the Stern–Volmer dynamic quenching constant which can be determined by linear regression of a plot of
F0/
F against [Q], and [Q] represents the concentration of ctDNA.
The Stern–Volmer plots (inset in Fig. 5A) at 292, 298, 304 and 310 K showed good linear relationship, suggesting that a single quenching procedure occurred. Moreover, the data of KSV tended to decrease with increasing temperature (Table 2), indicating that the fluorescence quenching mechanism of daphnetin–Cu(II) by ctDNA was initiated by a complex formation via static process.36
Table 2 The quenching constants (KSV), association constants (Ka), and relative thermodynamic parameters for the interaction of daphnetin–Cu(II) complex with ctDNA at different temperaturesa
| T (K) |
KSV (L mol−1) |
Ra |
Ka (L mol−1) |
Rb |
ΔH° (kJ mol−1) |
ΔS° (J mol−1 K−1) |
ΔG° (kJ mol−1) |
| Ra is the correlation coefficient for the KSV values. Rb is the correlation coefficient for the Ka values. |
| 292 |
3.78 × 10⁴ |
0.9976 |
6.31 × 10⁴ |
0.9932 |
|
|
−19.14 |
| 298 |
3.51 × 10⁴ |
0.9938 |
5.16 × 10⁴ |
0.9954 |
−18.72 |
27.63 |
−19.15 |
| 304 |
3.23 × 10⁴ |
0.9955 |
4.56 × 10⁴ |
0.9931 |
|
|
−19.16 |
| 310 |
2.71 × 10⁴ |
0.9993 |
4.00 × 10⁴ |
0.9938 |
|
|
−19.17 |
For a static quenching procedure, the fluorescence data were further used to study the interaction between daphnetin–Cu(II) and ctDNA based on the modified Stern–Volmer equation:37
| |
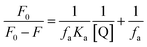 | (7) |
where
Ka represents the effective quenching constant for the accessible fluorophores, which is similar to association constant for the quencher–acceptor system, and
fa is the fraction of accessible fluorescence. The values of
Ka at four different temperatures were calculated to be in the range of 4.00 × 10
4 to 6.31 × 10
4 L mol
−1 by linear regression of
F0/(
F0 −
F)
versus 1/[Q] (
Table 2), which were smaller than that of typical DNA intercalator ethidium bromide, but corresponded to that of some intercalative ligands, for example [Zn(flmq)
2(bipy)] and [Cu(nap)
2(bipy)].
24,38,39 Besides, the values of
Ka for the daphnetin–Cu(
II) complex were higher than those of daphnetin at 292, 298, 304 and 310 K, indicating that the coordination of daphnetin to Cu
2+ enhanced the ability to bind to ctDNA.
40
Thermodynamic analysis is usually used to determine the essence of a biomolecule–ligand interaction. To characterize the binding force involved in the binding between daphnetin–Cu(II) and ctDNA, thermodynamic parameters, such as enthalpy change (ΔH°), entropy change (ΔS°) and free energy change (ΔG°) of the interaction were determined using the following equations:41
| |
 | (8) |
where
R is the gas constant and the temperatures are the same as quenching mechanism studies. The values of Δ
H° and Δ
S° were −18.72 kJ mol
−1 and 27.63 J mol
−1 K
−1, respectively, which suggested that the main binding forces of daphnetin–Cu(
II) to ctDNA were hydrogen bonds and hydrophobic interactions according to the rules summarized by Ross and Subramanian,
42 and the binding process was spontaneous due to the negative values of Δ
G°.
3.8. Binding distance and energy transfer between daphnetin–Cu(II) complex and ctDNA
The studies suggested the occurrence of daphnetin–Cu(II) complex intercalating into ctDNA, thus, the distance concerning daphnetin–Cu(II) (donor) and DNA base pairs (acceptor) can be determined according to Föster non-radiation energy transfer theory. However, up to now, the quantum yield of daphnetin–Cu(II) is unknown. Thus, the quantum yield of daphnetin–Cu(II) was determined to be 6.26 × 10⁻³ by comparing fluorescence intensity of the sample (daphnetin–Cu(II)) with that of the standard (HSA with known quantum yield of 0.13 (ref. 43)) under the same conditions as follows:| |
 | (10) |
where subscripts x and st denote sample and standard. φx and φst are the fluorescence quantum yield. Fx and Fst are the integral of the fluorescence intensity. Ax and Ast represent the absorption of sample and standard at the excitation wavelength of standard.44
There was a spectral overlap between the fluorescence emission spectrum of daphnetin–Cu(II) complex and UV-vis absorption spectrum of ctDNA (Fig. 5B). Thus the energy transfer efficiency E and the critical energy transfer distance R0 from fluorescent donor to acceptor is given by:
| |
 | (11) |
where
r is the distance between the donor and acceptor chromophores.
R0 is a critical distance, at which the efficiency of energy transfer is 50%. It can be calculated by the following relationship:
| | |
R06 = 8.79 × 10⁻²⁵K2N−4φJ
| (12) |
| |
 | (13) |
In these equations, K2 is the spatial orientation factor of the dipole for random orientations as in a fluid solution, K2 = 2/3. N is the refractive index of the medium, N = 1.336. φ is 6.26 × 10⁻³ calculated as above and J is the overlap integral between the fluorescence emission spectrum of the donor and the absorption spectrum of the acceptor. F(λ) is the fluorescence intensity of the donor at wavelength λ, ε(λ) is the molar absorption coefficient of the acceptor at wavelength λ.45
Based on the equations, the values of the parameters were calculated to be J = 4.14 × 10⁻¹⁵ cm3 L mol−1, R0 = 2.04 nm, E = 0.699 and r = 1.77 nm. The value of r was less than the 8 nm, and 0.5R0 < r < 1.5R0, which suggested that the non-radiative energy transfer may occur between daphnetin–Cu(II) complex and ctDNA.46
3.9. CD spectra
CD spectroscopy is a powerful technique particularly suited to detect sensitive conformational changes of DNA caused by ligands. The CD spectra of DNA has a negative peak at 245 nm ascribed to the right-handed helicity and a positive peak at 274 nm due to the stacking of base pairs of DNA.47 Conformational transition of DNA could be traced by changes in the position and intensity of the bands in CD spectra.48 As shown in Fig. 6A, the daphnetin–Cu(II) complex does not exhibit any CD bands in the range of 210–320 nm (dotted line), while the intensity of both the positive and negative peaks decreased significantly (shifting to zero level) accompanied by red shifts with increasing amounts of daphnetin–Cu(II). These changes in the CD spectra of DNA were owing to the reduction in the helicity and π–π stacking of bases caused by strong interaction of daphnetin–Cu(II) complex with base pairs.49
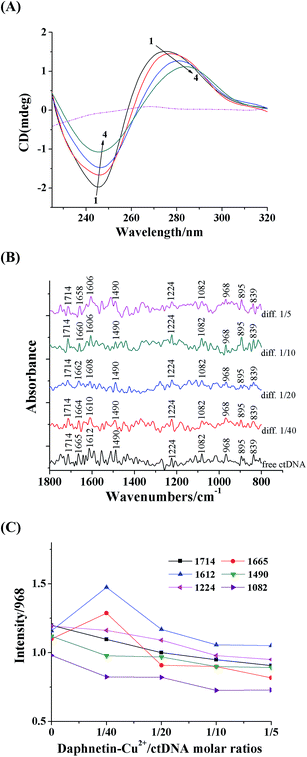 |
| | Fig. 6 (A) CD spectra of ctDNA in the presence of increasing amounts of daphnetin–Cu(II) complex at pH 7.4 and room temperature. c(ctDNA) = 2.56 × 10⁻⁴ mol L−1. The molar ratios of daphnetin–Cu(II)/ctDNA were (1) 0, (2) 1/12, (3) 1/6 and (4) 1/3. (B) FT-IR spectra and difference spectra [(ctDNA solution + daphnetin–Cu(II) solution) − daphnetin–Cu(II) solution] of the free ctDNA and daphnetin–Cu(II)–ctDNA complex at different molar ratios in the region of 1800–800 cm−1 in aqueous solution. (C) Intensity ratio variations for several DNA in-plane vibrations as a function of daphnetin–Cu(II) concentration. | |
3.10. FT-IR spectra
The FT-IR spectra of free ctDNA and daphnetin–Cu(II)–ctDNA complex at different molar ratios are shown in Fig. 6B. Infrared vibrations appearing at 1714 cm−1, 1665 cm−1, 1612 cm−1 and 1490 cm−1 are assigned to the in-plane vibration of DNA bases, guanine, thymine, adenine and cytosine, respectively. The bands located at 1224 and 1082 cm−1 are assigned mainly to the asymmetric and symmetric stretching vibrations of the backbone PO2 groups, respectively. In addition, the bands at 895 cm−1 and 839 cm−1 are infrared marker bands of DNA in B-conformation, attributed to deoxyribose vibration and phosphodiester mode.50,51
The changes in the intensity and position of these peaks (Fig. 6B and C) can provide evidence for the binding of daphnetin–Cu(II) to the nitrogenous bases of ctDNA. Upon addition of daphnetin–Cu(II), major shiftings for the thymine band from 1665 to 1658 cm−1 and adenine band from 1612 to 1606 cm−1 were observed, while other vibration bands showed no shifting. Moreover, the intensity of the thymine and adenine bands significantly increased, whereas that of other bands declined at low daphnetin–Cu(II) concentration (r = 1/40). These changes may be due to strong interaction of daphnetin–Cu(II) with thymine and adenine bases.52 With the increase in daphnetin–Cu(II) concentration increased (r = 1/20, 1/10, 1/5), a decrease tendency in intensity was observed for the four base bands and PO2 vibrations, suggesting DNA aggregation in the presence of high daphnetin–Cu(II) concentrations.53 Moreover, conformational transition for B-DNA did not appear, based on no change in the positions of marker bands for B-form DNA at 895 cm−1 and 839 cm−1.51
3.11. Sequence specificity verification
The sequence specificity of the binding of small molecules with DNA can be confirmed by molecular modeling, which was often performed to interpret the characteristics of binding between small molecules and DNA, such as binding sites or binding energy.54 The geometry of the complex corresponding to the lowest free energy of binding could be exposed by molecular docking. The best possible binding pose of the daphnetin–Cu(II)–DNA complex was determined by docking programs after running 100 binding sites (Fig. 8A). It clearly indicated that the planar structure of daphnetin–Cu(II) inserted into two adjacent base pairs (DT20–DA5 and DT19–DA6) of ctDNA by parallel way via forming two hydrogen bonds (Fig. 8A, white lines). The first hydrogen bond was formed between the keto oxygen of daphnetin–Cu(II) complex and hydrogen atoms of H3 associated with N3 of DT19 on chain B, and the second one was formed between the oxygen atoms of the six-membered heterocycle and H62 related to N6 of DA5 on chain A (dashed lines in Fig. 8B). These results were consistent with the result of FT-IR studies, demonstrating that daphnetin–Cu(II) complex bound to thymine and adenine bases of ctDNA.
3.12. DNA cleavage
DNA cleavage is controlled by relaxation of supercoiled circular form plasmid DNA to nicked circular and/or linear conformation, which can be monitored by agarose gel electrophoresis. When circular plasmid DNA is conducted by electrophoresis, the supercoiled conformation (form I) migrates the fastest, and the nicked conformation form (form II) moves slower due to the relaxation of supercoils. A linear conformation (form III) lead to a migration with the speed between form I and form II if both strands of DNA are cleaved.55 The DNA cleavage ability of daphnetin–Cu(II) complex was determined using supercoiled pUC18 plasmid DNA. The results (Fig. 7) showed that the complex acted as chemical nucleases by cleaving the DNA form I into form II. The increasing concentration of daphnetin–Cu(II) complex led to a gradual diminishing in the band intensity of form I and progressive increase in that of form II. The content of form I decreased from 100% to 36%, while the proportion of form II increased to 64%. These findings suggested that the daphnetin–Cu(II) complex exhibited significant DNA cleavage ability.56 However, our previous study found that daphnetin did not show any activity in cleaving plasmid DNA under the same conditions, indicating that daphnetin–Cu(II) complex may have a stronger ability in damaging DNA of cancer cells than daphnetin.7
 |
| | Fig. 7 Gel electrophoresis of plasmid pUC18 supercoiled DNA in the presence of increasing amounts of daphnetin–Cu(II) complex. Lane 1: supercoiled plasmid DNA (120 μg mL−1); lane 2–7: daphnetin–Cu(II) + plasmid DNA, and c(daphnetin–Cu(II)) = 0.23, 0.45, 0.68, 0.90, 1.13 and 1.35 × 10⁻³ mol L−1, respectively. | |
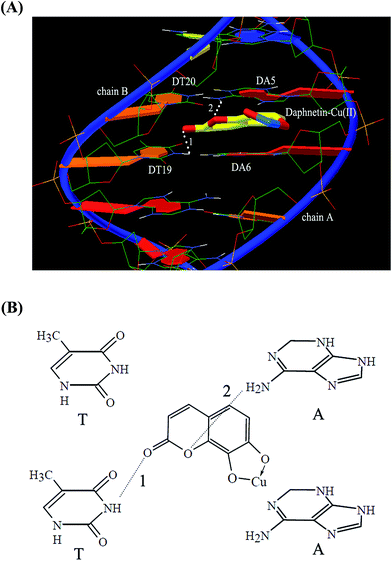 |
| | Fig. 8 (A) The most probable binding pose of daphnetin–Cu(II) complex interaction with DNA (white dashed line). (B) Possible hydrogen bonds (dashed line) between daphnetin–Cu(II) complex and bases. | |
4. Conclusions
Daphnetin coordinating with Cu2+ was explored by UV-vis absorption spectroscopy and analyzed by MCR-ALS method, quantitatively demonstrating the formation of daphnetin–Cu(II) complex with a molar ratio of 1:1. The binding interaction of the daphnetin–Cu(II) complex with ctDNA was investigated in physiological buffer (pH 7.4). It was found that the binding of daphnetin–Cu(II) complex to ctDNA caused the hypochromicity in the UV-vis absorption spectra of daphnetin–Cu(II) complex, led to an evident increase in relative viscosity and melting temperature of ctDNA, and weakened the binding ability of EB to ctDNA. All these results provided sufficient evidences for confirming the intercalative mode of the complex interacting with DNA. The fluorescence of daphnetin–Cu(II) was quenched by ctDNA through a static quenching mechanism. The negative enthalpy change (ΔH°) value and positive entropy change (ΔS°) value indicated that the binding process of daphnetin–Cu(II) to ctDNA was mainly driven by hydrophobic interaction and hydrogen bond. The binding distance r was 1.77 nm based on Föster theory, suggesting that the energy transfer from daphnetin–Cu(II) complex to ctDNA occurred with high possibility. The CD and cleavage studies indicated that interaction of daphnetin–Cu(II) complex with DNA decreased the helicity and base stacking of ctDNA and effectively cleaved plasmid DNA. Furthermore, the FT-IR analysis found that thymine and adenine were the specific binding sites, which was confirmed by molecular simulation.
This study has characterized the mechanism of binding of daphnetin–Cu(II) complex with ctDNA. It was found that the existence of Cu2+ enhanced the DNA-binding ability of daphnetin and led to the change in binding mode to an internal type. The study may provide novel insights into the synergistic effect between daphnetin and Cu2+ in exerting their pharmacological function.
Acknowledgements
We sincerely acknowledge financial support provided by the National Natural Science Foundation of China (No. 21167013, 31460422 and 31060210), the Natural Science Foundation of Jiangxi Province (20142BAB204001 and 20143ACB20006), the Joint Specialized Research Fund for the Doctoral Program of Higher Education (20123601110005), the Program of Jiangxi Provincial Department of Science and Technology (20141BBG70092), and the Research Program of State Key Laboratory of Food Science and Technology of Nanchang University (SKLF-ZZA-201302 and SKLF-ZZB-201305).
References
- M. R. Gill and J. A. Thomas, Chem. Soc. Rev., 2012, 41, 3179–3192 RSC.
- M. A. Husain, S. U. Rehman, H. M. Ishqi, T. Sarwar and M. Tabish, RSC Adv., 2015, 5(79), 64335–64345 RSC.
- S. A. Patil, S. N. Unki and P. S. Badami, Med. Chem. Res., 2012, 21, 4017–4027 CrossRef CAS.
- A. Witaicenis, L. N. Seito, A. S. Chagas, L. D. A. Junior, A. C. Luchini, P. Rodrigues-Orsi, S. H. Cestrari and L. C. D. Stasi, Phytomedicine, 2014, 21, 240–246 CrossRef CAS PubMed.
- Y. Z. Yang, A. Ranz, H. Z. Pan, Z. N. Zhang, X. B. Lin and S. R. Meshnick, Am. J. Trop. Med. Hyg., 1992, 46, 15–20 Search PubMed.
- D. Jayaraju and A. K. Kondapi, Curr. Sci., 2001, 81, 787–792 CAS.
- X. Y. Zhou, G. W. Zhang and J. H. Pan, Int. J. Biol. Macromol., 2015, 74, 185–194 CrossRef PubMed.
- H. Joshi, A. Sengupta, K. Gavvala and P. Hazra, RSC Adv., 2014, 4, 1015–1024 RSC.
- C. V. Uliana, G. S. Garbellini and H. Yamanaka, Sens. Actuators, B, 2013, 178, 627–635 CrossRef.
- L. H. Abdel-Rahman, R. M. El-Khatib, L. A. E. Nassr and A. M. Abu-Dief, Arabian J. Chem., 2013 DOI:10.1016/j.arabjc.2013.07.010.
- L. Xu, Y. Y. Xie, N. J. Zhong, Z. H. Liang, J. He, H. L. Huang and Y. J. Liu, Transition Met. Chem., 2012, 37, 197–205 CrossRef CAS.
- J. W. Longworth, R. F. Steiner and I. Weinryb, Excited states of proteins and nucleic acids, MacMillan, London, 2012 Search PubMed.
- E. Froehlich, J. S. Mandeville, C. M. Weinert, L. Kreplak and H. A. Tajmir-Riahi, Biomacromolecules, 2010, 12, 511–517 CrossRef PubMed.
- M. Bosco, M. P. Callao and M. S. Larrechi, Talanta, 2007, 72, 800–807 CrossRef CAS PubMed.
- Y. le Dréau, N. Dupuy, J. Artaud, D. Ollivier and J. Kister, Talanta, 2009, 77, 1748–1756 CrossRef PubMed.
- M. Maeder, Anal. Chem., 1987, 59, 527–530 CrossRef CAS.
- M. Vives, R. Gargallo and R. Tauler, Anal. Chim. Acta, 2000, 424, 105–114 CrossRef CAS.
- B. S. Liu, C. L. Xue, J. Wang, C. Yang, F. L. Zhao and Y. K. Lv, J. Lumin., 2010, 130, 1999–2003 CrossRef CAS.
- S. Y. Shi, Y. P. Zhang, X. Q. Chen and M. J. Peng, J. Agric. Food Chem., 2011, 59, 10761–10769 CrossRef CAS PubMed.
- G. W. Zhang, L. H. Wang, X. Y. Zhou, Y. Li and D. M. Gong, J. Agric. Food Chem., 2014, 62, 991–1000 CrossRef CAS PubMed.
- E. Jabeen, N. K. Janjua and S. Hameed, Spectrochim. Acta, Part A, 2014, 128, 191–196 CrossRef CAS PubMed.
- Y. Lu, J. Lv, G. S. Zhang, G. K. Wang and Q. F. Liu, Spectrochim. Acta, Part A, 2010, 75, 1511–1515 CrossRef PubMed.
- C. Rajarajeswari, M. Ganeshpandian, M. Palaniandavar, A. Riyasdeen and M. A. Akbarsha, J. Inorg. Biochem., 2014, 140, 255–268 CrossRef CAS PubMed.
- A. Tarushi, J. Kljun, I. Turel, A. A. Pantazaki, G. Psomas and D. P. Kessissoglou, New J. Chem., 2013, 37, 342–355 RSC.
- Y. N. Ni, Y. X. Wang and S. Kokot, Sens. Actuators, B, 2011, 156, 290–297 CrossRef CAS.
- S. MoradpourHafshejani, J. H. Hedley, A. O. Haigh, A. R. Pike and E. M. Tuite, RSC Adv., 2013, 3, 18164–18172 RSC.
- U. Chaveerach, A. Meenongwa, Y. Trongpanich, C. Soikum and P. Chaveerach, Polyhedron, 2010, 29, 731–738 CrossRef CAS.
- Y. Zhang, J. H. Pan, G. W. Zhang and X. Y. Zhou, Sens. Actuators, B, 2015, 206, 630–639 CrossRef CAS.
- S. A. Yasrebi, H. Mobasheri, I. Sheikhshoaie and M. Rahban, Inorg. Chim. Acta, 2013, 400, 222–227 CrossRef CAS.
- X. W. Liu, Z. G. Chen, L. Li, Y. D. Chen, J. L. Lu and D. S. Zhang, Spectrochim. Acta, Part A, 2013, 102, 142–149 CrossRef CAS PubMed.
- W. Chen, N. J. Turro and D. A. Tomalia, Langmuir, 2000, 16, 15–19 CrossRef CAS.
- X. Y. Zhou, G. W. Zhang and L. H. Wang, Int. J. Biol. Macromol., 2014, 67, 228–237 CrossRef CAS PubMed.
- N. Shahabadi, M. Maghsudi, Z. Kiani and M. Pourfoulad, Food Chem., 2011, 124, 1063–1068 CrossRef CAS.
- J. B. Chen, X. F. Zhou, Y. L. Zhang and H. P. Gao, Sci. Total Environ., 2012, 432, 269–274 CrossRef CAS PubMed.
- M. A. Husain, S. U. Rehman, H. M. Ishqi, T. Sarwar and M. Tabish, RSC Adv., 2015, 5, 64335–64345 RSC.
- Y. Lu, G. K. Wang, X. M. Lu, J. Lv, M. H. Xu and W. W. Zhang, Spectrochim. Acta, Part A, 2010, 75, 261–266 CrossRef PubMed.
- S. Lehrer, Biochemistry, 1971, 10, 3254–3263 CrossRef CAS PubMed.
- J. B. LePecq and C. Paoletti, J. Mol. Biol., 1967, 27, 87–106 CrossRef CAS PubMed.
- F. Dimiza, F. Perdih, V. Tangoulis, I. Turel, D. P. Kessissoglou and G. Psomas, J. Inorg. Biochem., 2011, 105, 476–489 CrossRef CAS PubMed.
- H. Muslu and A. Gölcü, J. Mol. Struct., 2015, 1092, 22–33 CrossRef CAS.
- J. B. Chen, X. F. Zhou, Y. L. Zhang, Y. J. Qian and H. P. Gao, Amino Acids, 2012, 43, 1419–1429 CrossRef CAS PubMed.
- P. D. Ross and S. Subramanian, Biochemistry, 1981, 20, 3096–3102 CrossRef CAS PubMed.
- M. Suzukida, H. P. le, F. Shahid, R. A. McPherson, E. R. Birnbaum and D. W. Darnall, Biochemistry, 1983, 22, 2415–2420 CrossRef CAS PubMed.
- S. Y. Bi, L. L. Yan, Y. Wang, B. Pang and T. J. Wang, J. Lumin., 2012, 132, 2355–2360 CrossRef CAS.
- Y. J. Hu, Y. Ou-Yang, C. M. Dai, Y. Liu and X. H. Xiao, Biomacromolecules, 2009, 11, 106–112 CrossRef PubMed.
- C. Q. Jiang, M. X. Gao and X. Z. Meng, Spectrochim. Acta, Part A, 2003, 59, 1605–1610 CrossRef.
- A. Subastri, C. H. Ramamurthy, A. Suyavaran, R. Mareeswaran, P. L. Rao, M. Harikrishna, M. S. Kumar, V. Sujatha and C. Thirunavukkarasu, Int. J. Biol. Macromol., 2015, 78, 122–129 CrossRef CAS PubMed.
- D. K. Jangir, S. K. Dey, S. Kundu and R. Mehrotra, J. Photochem. Photobiol., B, 2012, 114, 38–43 CrossRef CAS PubMed.
- G. W. Zhang, P. Fu, L. Wang and M. M. Hu, J. Agric. Food Chem., 2011, 59, 8944–8952 CrossRef CAS PubMed.
- G. Tyagi, S. Pradhan, T. Srivastava and R. Mehrotra, Biochim. Biophys. Acta, Gen. Subj., 2014, 1840, 350–356 CrossRef CAS PubMed.
- D. K. Jangir, S. Charak, R. Mehrotra and S. Kundu, J. Photochem. Photobiol., B, 2011, 105, 143–148 CrossRef CAS PubMed.
- J. S. Mandeville, C. N. N'soukpoé-Kossi, J. F. Neault and H. A. Tajmir-Riahi, Biochem. Cell Biol., 2010, 88, 469–477 CrossRef CAS PubMed.
- R. Marty, C. N. N'soukpoé-Kossi, D. Charbonneau, C. M. Weinert, L. Kreplak and H. A. Tajmir-Riahi, Nucleic Acids Res., 2009, 37, 849–857 CrossRef CAS PubMed.
- J. Chai, J. Y. Wang, Q. F. Xu, F. Hao and R. T. Liu, Mol. BioSyst., 2012, 8, 1902–1907 RSC.
- Shamsuzzaman, A. M. Dar, S. Tabassum, M. Zaki, Y. Khan, A. Sohail and M. A. Gatoo, C. R. Chim., 2014, 17, 359–369 CrossRef CAS.
- R. B. Dixit, T. S. Patel, S. F. Vanparia, A. P. Kunjadiya, H. R. Keharia and B. C. Dixit, Sci. Pharm., 2011, 79, 293 CrossRef CAS PubMed.
Footnote |
| † These authors contributed equally to this work. |
|
| This journal is © The Royal Society of Chemistry 2016 |
Click here to see how this site uses Cookies. View our privacy policy here.