DOI:
10.1039/C5RA21954J
(Paper)
RSC Adv., 2016,
6, 2241-2251
Synthesis of porous Al doped ZnO nanosheets with high adsorption and photodecolorizative activity and the key role of Al doping for methyl orange removal
Received
20th October 2015
, Accepted 22nd December 2015
First published on 23rd December 2015
Abstract
Porous Al doped ZnO (AZO) nanosheets have been prepared as an efficient multifunctional water treatment material. Their fundamental properties were characterized by various spectroscopic testing methods. The AZO nanosheets displayed very rapid adsorption rate and high adsorption capacity for methyl orange (MO) dye. The kinetics and equilibrium of adsorption process were found to follow the pseudo-second-order kinetic and Langmuir isotherm models, respectively. Furthermore, the AZO nanosheets exhibited superior photodecolorizative activity compared with the commercial P25 TiO2 nanoparticles. It was found that Al doping increased the zeta potential of AZO nanosheets and then significantly enhanced the adsorption capacity for MO dye and, at the same time, retarded the recombination of photoexcited electron–hole pairs, and prolonged the lifetime of the photo-generated carriers, and then improved the semiconductor photocatalytic activity. In addition, the visible-light-driven dye photosensitized degradation was also an important reason for enhanced photodecolorizative activity. Therefore, AZO nanosheets are a potential multifunctional water treatment material combining highly efficient adsorption and photocatalytic degradation.
1. Introduction
Water pollution has become a serious global environmental issue and received significant attention.1–3 The wastewater effluent from the textile, paper, plastics, leather, plastic and printing industries contains high concentrations of synthetic dyes. Many of the dyes are harmful to human beings and toxic to microorganisms. Therefore, they must be removed before being discharged into the natural environment.4 Various techniques have been exploited to remove dyes from aqueous solutions, such as adsorption, photocatalytic degradation, membrane filtration, chemical oxidation, flocculation and electrooxidation.5–7 Among these methods, adsorption is one of the most effective approaches for the treatment of organic dyes due to its effectiveness, operational simplicity, low cost and low energy requirements.6,8,9 However, it is not competent in the situation when thorough removal is required for trace amount of toxic contaminants.10–12 Photocatalytic degradation is regarded as another versatile and effective water treatment method. Nevertheless, due to the low quantum efficiency of normal photocatalysts, it is not efficient in dealing with a large amount or high concentration of pollutants.10 So, it is very interesting and important to develop multifunctional water treatment materials combining highly efficient adsorption and photocatalytic degradation applying to different dye concentration range.
It is well known that doping is a very important method to improve performance of catalysts/adsorbents.13 Jimmy C. Yu et al. prepared F-doped TiO2 photocatalyst which exhibited stronger absorption in the UV-visible range with a red shift in the band gap transition. The photocatalytic activity of F-doped TiO2 powders exceeded that of Degussa P25.14 M. Sathish et al. reported nitrogen-doped TiO2 nanocatalyst showing higher activity than the P25 TiO2 photocatalyst in the visible region.15 Zhao et al. synthesized gadolinium doped cobalt ferrite nanoparticles and demonstrated the enhanced adsorption capability for Congo red.16 Nan et al. reported a solvothermal synthetic route used to prepare Ce3+ doped ZnFe2O4 and presented the adsorption capacity of ZnFe2O4 for Cr(VI) increase by adulterating a small quantity of Ce3+ ions into it.17 However, the reports about the doping simultaneously improving the adsorption and photocatalytic performance are scarce.16
Zinc oxide (ZnO), one kind of versatile semiconductor nanomaterial with a wide variety of morphology, has been extensively studied for potential applications in electronics,18,19 photoelectronics,20,21 optical devices and ecology.13,22–25 Herein, we prepared the porous Al-doped ZnO nanosheets and investigated their adsorption and photocatalysis performance for the removal of MO dye. The AZO nanosheets showed very rapid adsorption rate and high adsorption capacity for MO dye. About 95.7% of the MO dye was removed during the first 3 minutes of adsorption and the adsorption capacity of AZO nanosheets was almost 9 times higher than that of pure ZnO nanosheets. Furthermore, the AZO nanosheets exhibited superior photodecolorizative activity. The decolorizative rate reached 97.7% within 15 min for the MO dye, which was much higher that of ZnO nanosheets (18.5%) and even P25 TiO2 nanoparticles (72.7%) under UV light irradiation for 60 min. It was found that Al doping increased the zeta potential of AZO nanosheets and then significantly enhanced the adsorption capacity for MO dye. As an effective electron donor, Al doping increased the electrical conductivity of AZO nanosheets, retarded the recombination of photoexcited electron–hole pairs, and prolonged the lifetime of the photo-generated carriers, and then improved the semiconductor photocatalytic activity. In addition, the visible-light-driven dye photosensitized degradation was also an important reason for enhanced photodecolorizative activity. Therefore, AZO nanosheets became a very promising multifunctional water treatment material combining highly efficient adsorption and photocatalytic degradation applying to different environmental conditions.
2. Experimental procedure
2.1 Chemicals
Zinc nitrate hexahydrate (Zn(NO)3·6H2O), hexamethylenetramine (HMTA), poly(ethylene glycol) and ethanol were purchased from Aladdin Chemistry Co, Ltd. Aluminium nitrate hydrate was purchased from the Zhenxin reagent factory, Shanghai. All chemicals were used as received without further purification.
2.2 Preparation of porous AZO nanosheets
The porous AZO nanosheets were prepared by a precursor-based route. Firstly, Zn(NO)3·6H2O (4 mmol, 1.1927 g) and HMTA (4 mmol, 0.5619 g) were dissolved in 40 mL of deionized water. Under the stirring, Al(NO)3·9H2O (0.01 mmol, 0.045 g) was added into the above solution. After vigorously stirred for about 30 min, the solution was poured into a Teflon-lined autoclave, which was sealed and placed in an oven for hydrothermal treatment at 180 °C for 15 h. After completion of the reaction, the autoclave cooled to room temperature and the white precursor was obtained by centrifugation and further rinsed with the deionized water and absolute ethyl alcohol. And then, the precursor was calcined at 400 °C for 1 h in the muffle furnace. The porous AZO nanosheets were obtained. Some porous ZnO nanosheets were prepared as the same hydrothermal reaction without addition of the Al(NO)3·9H2O.
2.3 Characterizations
The crystal structure of sample was analyzed by X-ray diffraction (XRD, Ultima IV, Rigaku) under Cu Kα radiation (λ = 1.54056 Å) operated at 40 kV, 40 mA with the scanning angle (2θ) ranging from 10° to 80° and a sweep speed of 4° min−1. The morphologies and energy dispersive spectrometer (EDS) of samples were examined by field-emission scanning electron microscope (SEM, JSM-7500F). The specific surface areas and pore size distributions (V-Sorb 2800) of the samples were tested by Brunauer–Emmett–Teller (BET) and Barrett–Joyner–Halenda (BJH) methods, respectively. The surface charge of the sample was analyzed using a Zeta-potential analyzer (Malvern, Nano ZS 90). Thermogravimetric and differential scanning calorimetry (TG-DSC) were carried out on thermal analysis instrument (Netzsch, STA 449C). The concentration of MO was analyzed by using UV-visible spectrophotometer (UV-2550). UV-visible diffuse reflectance spectra were recorded on the UV-visible spectrophotometer with an integrating sphere attachment.
2.4 Adsorption experiments
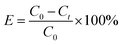
The adsorption of MO in aqueous solution on prepared samples was performed in a batch which carried out in the dark at room temperature. In a typical adsorption, 75 mg of sample was placed into 100 mL of MO solution with the concentrate ranging from 10–80 mg L−1 under vigorous stirring. After adsorption process for certain period, the residual solution with adsorbent was separated through centrifugation. The concentration of residual solution was determined by UV-vis spectrophotometer at 464 nm. The effect of pH on adsorption also was studied. The pH of solution was adjusted by adding a few drops of dilute NaOH or HCl aqueous solution. The amount of MO adsorbed and removal efficiency at time t was calculated according to the formula:| |
 | (1) |
| |
 | (2) |
where qt (mg g−1) and E were adsorption capacity and removal efficiency, respectively; C0 and Ct (mg L−1) were the liquid phase concentrations of MO at initial and any time t, respectively. V was the volume of the solution (L) and W (g) was the mass of adsorbent used.
When the adsorption was equal to the desorption, the amount of MO adsorbed at equilibrium was calculated from the following equation:
| |
 | (3) |
where
C0 and
Ce (mg L
−1) were the liquid phase concentrations of MO at initial and equilibrium, respectively.
V was the volume of the solution (L) and
W was the mass of adsorbent used (g).
2.5 Photocatalytic measurements
The photocatalytic experiments of ZnO, AZO, P25 for the degradation of MO solution were carried out under UV light. Also, the photocatalytic capacity of AZO toward the MO under the visible light irradiation was studied. The reaction suspension was prepared by adding the sample (75 mg) into 100 mL MO solution under stirring. At given irradiation time, 2 mL of the suspension was collected and centrifuged to remove the particles. The dye concentration was analyzed with UV-vis spectrophotometer.
2.6 Photoelectrochemical measurements
Photoelectrochemical measurements were conducted on a CHI 660D electrochemical workstation (Shanghai Chenhua, China) with conventional three-electrode method. The counter and reference electrodes were Pt plate and Ag/AgCl electrode and 0.2 M Na2SO4 served as electrolyte. The working electrodes were prepared by doctor-blade method as following: 0.6 g different samples and 0.9 g poly(ethylene glycol) (PEG, MW ∼ 20![[thin space (1/6-em)]](https://www.rsc.org/images/entities/char_2009.gif) 000) were suspended in 10 mL deionized water, and stirred overnight. Then the paste was coated onto the fluorine-tin oxide (FTO) conducting glass electrode. The films were then allowed to dry at 60 °C for 12 h, and finally subjected to heat treatment at 400 °C for 1 h at a heating rate of 2 °C min−1. The transient photocurrent responses of samples were carried out on a switch-on and switch-off model. A 300 W xenon lamp was used to provide simulated sunlight source. Electrochemical impedance spectroscopy (EIS) was carried out under open-circuit potential condition and 100 mW cm−2 bias illumination. The frequency range was 0.1–100 kHz and the magnitude of modulation signal was 0.01 V.
000) were suspended in 10 mL deionized water, and stirred overnight. Then the paste was coated onto the fluorine-tin oxide (FTO) conducting glass electrode. The films were then allowed to dry at 60 °C for 12 h, and finally subjected to heat treatment at 400 °C for 1 h at a heating rate of 2 °C min−1. The transient photocurrent responses of samples were carried out on a switch-on and switch-off model. A 300 W xenon lamp was used to provide simulated sunlight source. Electrochemical impedance spectroscopy (EIS) was carried out under open-circuit potential condition and 100 mW cm−2 bias illumination. The frequency range was 0.1–100 kHz and the magnitude of modulation signal was 0.01 V.
3. Results and discussion
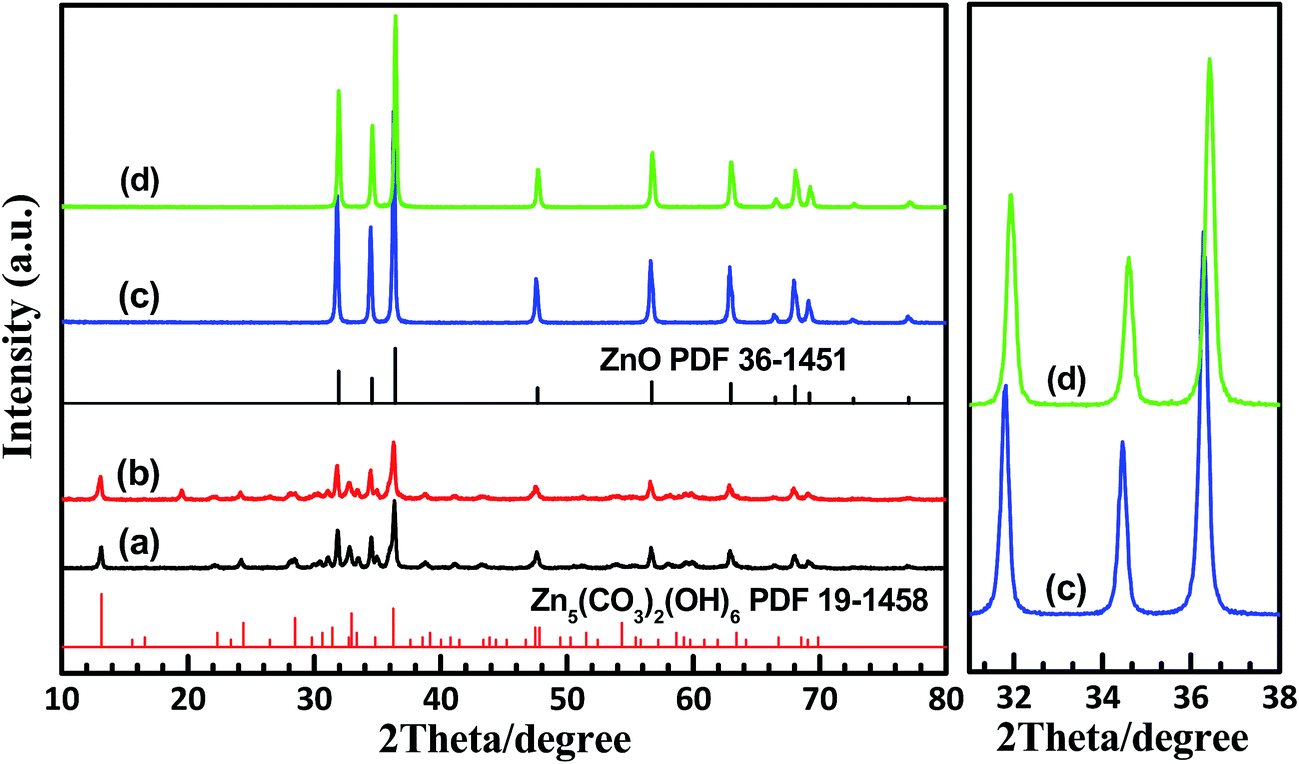
The phase structure and purity of the as-synthesized samples were characterized with XRD. Fig. 1a and b represent the XRD patterns of the obtained intermediates in the solvothermal reaction. All diffraction peaks of un-doped intermediate can be indexed as the monoclinic hydrozincite Zn5(CO3)2(OH)6 (JCPDS card no. 19-1458) and hexagonal ZnO phase (JCPDS card no. 36-1451). The phase structure of Al-doped intermediate is similar with that of un-doped intermediate, expect for an un-known phase identified by a small diffraction peak at 19° in the XRD pattern. The results indicate that a hydrozincite precursor has been produced in the solvothermal reaction. After calcinated at 400 °C for 1 h, the precursor has completely transformed into hexagonal ZnO phase as shown in Fig. 1c and d. The sharp reflection peaks of the XRD patterns suggest that the final ZnO products are highly crystalline. There is no other diffraction peaks detected, which indicates that no impurity exists in the final product. Compared with pure ZnO product, the diffraction peaks of Al doped ZnO sample shifted towards low angle (as shown in the right magnifying figure), which implied that the Al dopants have entered the unit-cell maintaining the hexagonal structure of ZnO. Because the difference in ionic radii between zinc and aluminum is not large, the right amount of Al can substitutionally dope the crystalline ZnO lattice to produce Al:ZnO (AZO).26,27 The change in the peak position should be ascribed to the substitution of Zn2+ by Al3+ ions. The ionic radius of Al3+ (0.54 Å) is smaller than that of Zn2+ (0.74 Å), which leads to reduction of the crystal cells.
 |
| | Fig. 1 XRD patterns of (a) un-doped and (b) Al doped intermediates produced in solvothermal reaction and (c) un-doped and (d) Al doped samples calcinated at 400 °C for 1 h. | |
EDS measurement was carried out to further confirm the presence of elements and purity in the AZO nanosheets. As shown in Fig. 2, the EDS spectrum of the AZO nanosheets shows the presence of Al, Zn and O elements in AZO nanosheets without other peaks beside the peaks of C element (introduced by testing). Combining with the results of the XRD analysis, it indicates that Al dopants have entered the lattice of crystalline ZnO.
 |
| | Fig. 2 The EDS spectrum of Al-doped ZnO nanosheets. | |
Thermogravimetric (TG) and differential scanning calorimetric (DSC) curves of the obtained two intermediates are displayed in Fig. 3. For the TG and DSC curves of un-doped intermediate, there is only a significant weight loss step among whole testing temperature in TG curve. Associated with XRD analysis, this weight loss should be due to the decomposition of Zn5(CO3)2(OH)6 to ZnO, CO2, and H2O. The theoretical weight loss for the decomposition of hydrozincite is about 25.84%, however, only the weight loss of 18.01% in the TG curve was observed. It was deduced that the intermediate contained not only Zn5(CO3)2(OH)6 but also ZnO and their quality percentage were 69.66% and 30.34%, respectively. At the same time, the corresponding DSC curve shows an endothermic peak at 264.3 °C, which illustrates that the decomposition of the intermediate is an endothermic process. For Al-doped intermediate, its thermal analysis figures present a similar tendency to that of un-doped intermediate. However, there are two endothermic peaks at 256.8 and 283.8 °C in DSC curve, respectively. And a 0.42% weight loss more than that of un-doped intermediate in the TG curve, which may be related to the un-known phase in the XRD pattern (as shown in the Fig. 1b).
 |
| | Fig. 3 TG and DSC curves of un-doped and Al-doped intermediates produced in the solvothermal reaction. | |
The morphologies of the un-doped and Al doped intermediates and the corresponding calcinated samples were characterized by FESEM. Fig. 4a and b show that the undoped and Al doped intermediates are 2D nanosheets with a thickness of about tens of nanometers. After calcinated, as shown in Fig. 4c and d, there are plenty of voids in the nanosheets, which makes the nanosheet look like a network. The porous structure on the surfaces of ZnO and Al-doped ZnO (AZO) nanosheets should be resulted from the decomposition of hydrozincite Zn5(CO3)2(OH)6 and the subsequent release of H2O and CO2. Such network structure can largely increase the accessible surface area of the materials and are favourable for the applications as catalytic and sensing materials.19,28
 |
| | Fig. 4 SEM images of (a) un-doped and (c) Al doped intermediates and the corresponding (b and d) calcinated samples. | |
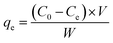
The surface area and porosity of the porous ZnO and AZO nanosheets were further characterized by BET N2 adsorption–desorption analysis, as shown in Fig. 5. ZnO and AZO nanosheets all show type IV isotherms with type H3 hysteresis loops. The slight hysteresis loop (0.8 < P/P0 < 1) indicates the presence of meso and macro pores.4,18,29,30 Furthermore, the capillary condensation step of the hysteresis loop for AZO nanosheets is slightly shifted to lower relative pressures, indicating smaller mesopores. The BET surface area of the porous AZO nanosheets, estimated from the adsorption data, is 34.3 m2 g−1, which is larger than that of porous ZnO nanosheets (12.5 m2 g−1) and is also in the same order of magnitude as 3D ZnO nanoplates (31.05 m2 g−1).23 The difference is due to the morphological variation or small crystal size.18,19 In addition, the as-synthesized samples also show two types of pore size distribution in the mesoporous and macroporous regions, as shown in the inset of Fig. 4. One had a relative narrow pore size distribution in the range of 17–66 nm for AZO and 17–26 nm for ZnO; the other had a broad size distribution centered at 187 nm for AZO and at 315 nm for ZnO, respectively. Considering the SEM results, the macropores should be related to the interspace between nanosheets.
 |
| | Fig. 5 Nitrogen adsorption–desorption isotherms and the corresponding pore size distribution plots (inset) of ZnO and AZO nanosheets. | |
The ZnO and AZO nanosheets are used as adsorbents in wastewater treatment. To study the adsorption rate, 75 mg of adsorbent was added to 100 mL of MO solution with an initial concentration of 10 mg L−1. Fig. 6 shows the adsorption rate of MO solutions treated by the ZnO or AZO nanosheets at different periods of time, respectively. It can be seen that the AZO nanosheets are able to absorb approximately 93% of the MO in 1 min, and almost all (99.32%) of MO has been removed in 10 min without any additives at room temperature. However, the ZnO nanosheets only remove approximately 21.8% of the MO in 15 min, and after that, the adsorption of the MO is very slow and nearly reaches the adsorption equilibrium. It is obvious that AZO nanosheets significantly improve the adsorption of MO. Enhanced dye removal ability may be attributed to both the enlarged surface area (as shown in Fig. 5) and the electrostatic attraction between the AZO and MO (discussed in Fig. 7).
 |
| | Fig. 6 The adsorption rate of MO solutions treated by the ZnO or AZO nanosheets (0.75 g L−1) at different periods of time, respectively. The initial concentration of MO is 10 mg L−1; the inset shows the picture of the absorption of MO at different periods of time. | |
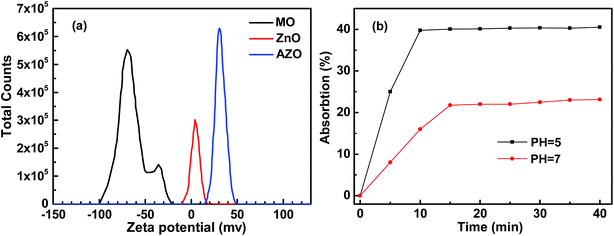 |
| | Fig. 7 (a) The zeta-potential of MO, ZnO and AZO dispersed in water at pH = 7.0 and (b) the adsorption of MO onto ZnO sheets dispersed in water at pH = 7.0 and 5.0. | |
 |
| | Fig. 8 Adsorptive progress at different initial MO concentrations. | |
The surface charge of a sample is generally an important parameter to assess adsorption behavior. The zeta potential of MO, ZnO and AZO was recorded at pH = 7 (in neutral water environment). As shown in Fig. 7a, the zeta potential main peak of MO, ZnO and AZO is located at −69.4 mV, 4.2 mV and 30.4 mV, respectively. It can be seen that the zeta potential of ZnO and AZO nanosheets are positive in solution. Comparing with the zeta potential of ZnO, that of AZO nanosheets increases obviously in the positive direction. Because the zeta potential reflects the types and quantity of material surface charge, if the types and quantity of material surface charge vary, the zeta potential of material should also change. When Al substitutionally dopes the crystalline ZnO lattice to produce AZO, Al3+ enters the site of Zn2+ in ZnO lattice. The charge quantity of ion on the corresponding site increases from +2 to +3. When a lot of substitutional ions are exposed on the surface of AZO nanosheets, the quantity of material surface charge inevitably increase. It also can be seen that the zeta potential of MO is negative charged in solution. So, both ZnO and AZO nanosheets all can absorb MO for electrostatic interaction. Furthermore, the AZO nanosheets will interact more strongly with MO and show a better absorption performance for its higher zeta potential.
The protonic acidity is usually favorable for some organic molecules adsorption.31–33 To evaluate the effect of protonation on the adsorption of MO onto ZnO sheets, we conducted the adsorption rate experiments in two kinds of solutions with the same initial concentrations of MO and ZnO and just pH values adjusted from 7.0 to 5.0. As shown in Fig. 7b, the adsorption capacities of MO onto ZnO nanosheets obviously increases for its more positively charged surface in acidic solutions (pH = 5.0), which is similar with the effect of Al dopant on the adsorption of MO onto AZO nanosheets. It indicates that the Al doping ZnO plays a similar role with protonation.
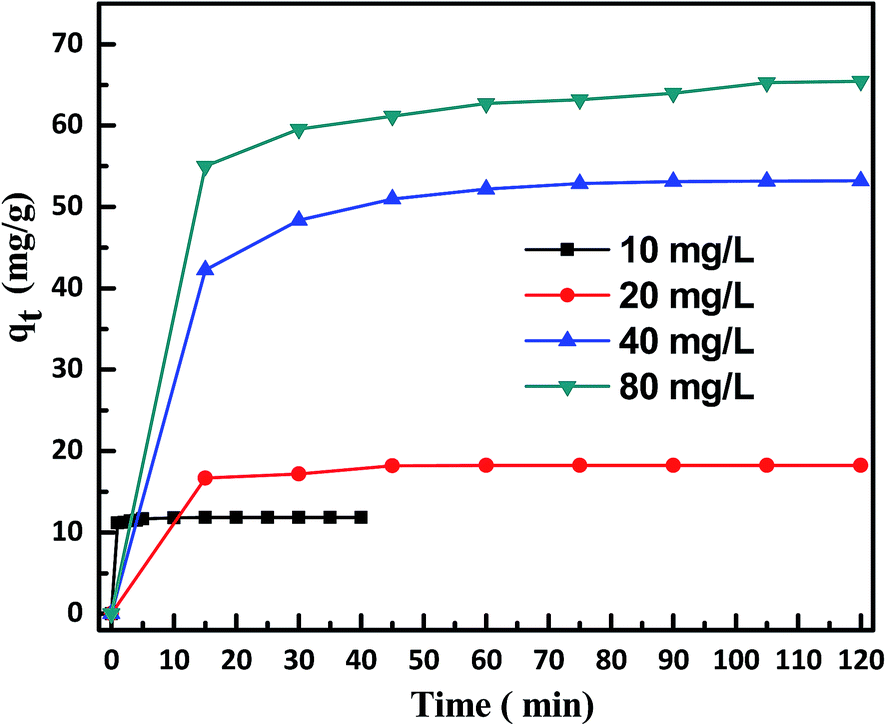
The time profile of MO removal by the AZO nanosheets was investigated, as shown in Fig. 9, where 75 mg of the sample was added to 100 mL of MO solution with initial concentration of 10, 20, 40 and 80 mg L−1, respectively, at pH = 7.0 and room temperature. It can be seen that the adsorption rates within the first 15 min are very fast under all the concentrations, and after that, the adsorption process gradually reaches adsorption equilibrium. The fast sorption represents an advantage for water treatment system applications. The adsorption capacities of the AZO nanosheets are 11.85, 18.25, 53.21, and 65.44 mg g−1 for the initial MO concentration of 10, 20, 40 and 80 mg L−1, respectively. The adsorption capacity of our synthesized AZO nanosheets for MO is higher than that of echinoid-like BiOI microspheres.11
 |
| | Fig. 9 (a) Freundlich and (b) Langmuir adsorption isotherms for MO onto AZO nanosheets. The inset shows the corresponding adsorption isotherm parameters of the AZO nanosheets. | |
Adsorption isotherms provide qualitative information on the capacity of the adsorbent as well as the nature of the solute surface interaction. In this study, our experimental data were analyzed with Freundlich isotherm and Langmuir isotherm. Freundlich isotherm is expressed as the following:22,34,35
| | |
lnqe = lnkf + 1/nlnCe
| (4) |
where
qe (mg g
−1) is the amount of MO adsorbed at the equilibrium,
Ce (mg g
−1) is the equilibrium concentration of MO in the solution,
kf is the Freundlich constant, and
n is a constant depicting the adsorption capacity.
Fig. 8a shows the value of ln
qe against ln
Ce according to the experimental isotherm data. The low correlation coefficient 0.692 indicated the poor agreement with the Freundlich isotherm model.
Langmuir isotherm assumes monolayer coverage and all sites on solid surface have equal affinity for adsorbate molecules, which can be expressed as following:7,34,36
| | |
Ce/qe = 1/kqm + Ce/qm
| (5) |
where
qm (mg g
−1) is the maximum adsorption capacity corresponding to complete monolayer coverage and
k is the equilibrium constant (L mg
−1).
Ce (mg L
−1) and
qe (mg g
−1) are the concentration of MO in the solution and the adsorption capacity at the equilibrium, respectively.
k and
qm were obtained by the slopes and intercepts of the straight lines of the plot of
Ce/
qe versus Ce, as shown in
Fig. 8. The correlation coefficient (
R2) for Langmuir isotherm is 0.951, which is larger than that 0.692 for Freundlich isotherm. This result indicates that Langmuir isotherm is more suitable for the adsorption process, implying that the adsorbed layer is monolayer coverage.
37 The maximum adsorption capacity is estimated to be 74.571 mg g
−1 and
k = 1.136 L mg
−1.
In order to understand the characteristics of the adsorption process, the adsorption kinetics of MO onto AZO nanosheets was investigated by using two well-known pseudo-first-order and pseudo-second-order kinetic models. They are presented as following:38,39
| |
 | (6) |
| |
 | (7) |
where
qe and
qt are the amounts of MO adsorbed onto AZO nanosheets at equilibrium and at various time
t, respectively;
k1 and
k2 are the rate constant of the pseudo-first-order and the pseudo second-order adsorption model, respectively. These parameters and correlation coefficients obtained by linearization as shown in
Fig. 10a and b are listed in
Table 1. It can be seen that the values of
R2 for pseudo-second-order are all above 0.999, and larger than that for the pseudo-first-order kinetic model, respectively. Furthermore, the
qe values calculated from the second-order mode were very consistent with the experimental
qe values. Thus, the pseudo-second-order kinetic model can be used to describe the adsorption processes and the chemical adsorption would be the rate-determining step controlling the adsorption process of MO dye on AZO nanosheets. The
qe,cal increased with increasing the initial concentration, attributed to the relatively strong driving force of the concentration gradient at high initial concentrations.
40 Additionally, the values of pseudo second-order rate constants (
k2) decreased from 1.149 to 0.006 g (mg
−1 min
−1), which can be ascribed to the lower competition for the surface active sites at lower concentration.
41,42
 |
| | Fig. 10 Fitting plots based on (a) pseudo-second-order and (b) pseudo-first-order kinetic model for the adsorption of MO onto AZO nanosheets. | |
Table 1 Kinetic parameters for the adsorption of MO onto AZO nanosheets based on the pseudo-first-order and pseudo-second-order kinetic models
| Initial concentration (mg L−1) |
qe,exp (mg g−1) |
Pseudo-first-order kinetic models |
Pseudo-second-order kinetic models |
| k1 (min−1) |
qe,cal (mg g−1) |
R2 |
k2 (g (mg−1 min−1)) |
qe,cal (mg g−1) |
R2 |
| 10 |
11.847 |
0.467 |
0.706 |
0.791 |
1.149 |
11.875 |
0.999 |
| 20 |
18.253 |
0.063 |
5.853 |
0.792 |
0.059 |
18.416 |
0.999 |
| 40 |
35.874 |
0.106 |
168.225 |
0.721 |
0.007 |
54.318 |
0.999 |
| 80 |
65.441 |
0.044 |
35.629 |
0.859 |
0.006 |
66.181 |
0.999 |
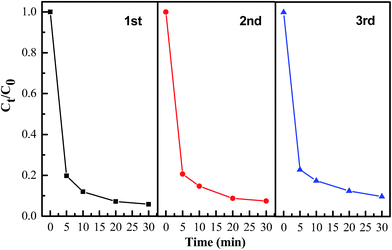
In addition, the reusability of the synthesized adsorbent is quite a crucial factor, since better repeated availability can effectively reduce the overall cost of the adsorbent. In order to investigate the reusability of the AZO nanosheets, cyclic adsorption–regeneration tests were carried out for MO (concentration: 20 mg L−1). After adsorption process, the collected samples were heated at 500 °C in air for 2 h for regeneration. The regenerated samples were further used for adsorption–desorption of MO test. From Fig. 11, it can be noticed that the AZO nanosheets could remove 90.3% MO dye from the aqueous solution after 3 cycles and the adsorption capacity has no substantial decrease.
 |
| | Fig. 11 Three cycles of the adsorption of MO treated with AZO nanosheets. | |
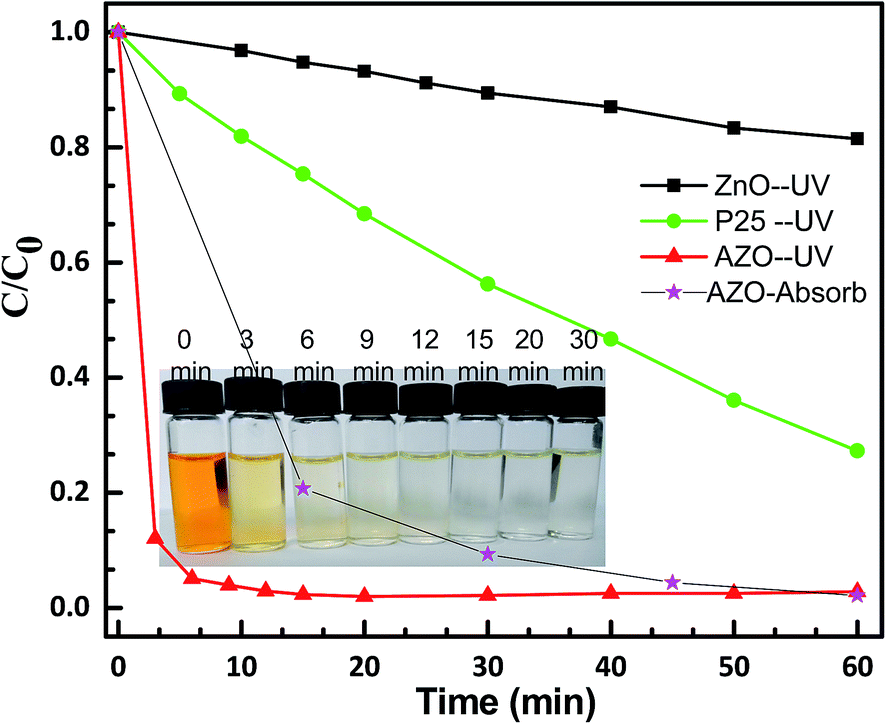
Photocatalytic activities of the porous ZnO and AZO nanosheets as well as commercially available Degussa P25 titania (as a reference photocatalyst) were evaluated by decolorization of the organic dye MO due to their potential applications in environmental remediation. Fig. 12 shows the photodecolorization behaviour of the MO (initial concentration: 40 mM) with 75 mg of photocatalysts after exposure to ultraviolet light (UV) for different durations. Where C is the concentration of MO after different light irradiation times and C0 is the initial concentration of the MO. Obviously, the photodecolorization of MO is the cooperative result of photocatalysis combined with adsorption of photocatalysts. It can be seen that the AZO nanosheets appear to be much higher decolorizative rate than ZnO nanosheets and even much better than P25 TiO2 nanoparticles. After UV light irradiation for 60 min, the decolorizative rates of MO using ZnO nanosheets and P25 TiO2 nanoparticles are about 18.5 and 72.7%, respectively. However, the AZO nanosheets exhibits superior decolorizative activity and the decolorizative rate reaches 98% within 30 min. We know that the higher adsorption and photocatalysis, the more remarkable photodecolorization. Furthermore, better adsorption can effectively promote the photocatalytic efficiency of photocatalysts. Compare to the adsorption rate of MO onto AZO nanosheets at 15 min, the decolorizative rate of MO treated by AZO nanosheets is almost higher 18%. The value is still much higher the decolorizative rate (5.2%) of MO treated by ZnO nanosheets, which implies the AZO nanosheets show much better photocatalytic performance than ZnO nanosheets.
 |
| | Fig. 12 Photocatalytic decolorization of MO under UV irradiation using different samples (commercial P25 nanoparticles, ZnO and AZO nanosheets) and the adsorption of MO treated with AZO nanosheets in the dark (AZO-absorb). The inset shows the picture of the decolorization process of MO treated by AZO nanosheets under UV irradiation. | |
Except for larger specific surface area and higher adsorption than that of ZnO, the enhanced photocatalytic efficiency of the AZO nanosheets may also be related to higher charge-transfer property, lower recombination of photoexcited electron–hole pairs and additional dye photosensitized degradation.
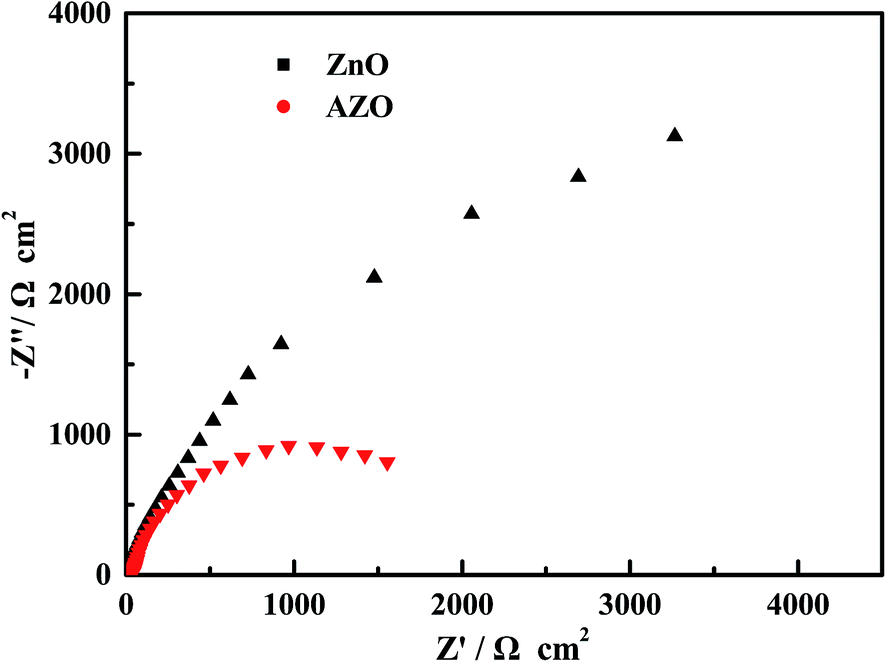
It is known that the charge-transfer property of catalysis has a great effect on the separation and recombination process of photogenerated electron–hole pairs and then on the lifetime of photogenerated carriers, which is a key factor determining the photocatalytic activity. To understand the effect of Al doping on the charge-transfer property of AZO nanosheets, we conducted EIS measurements for ZnO and AZO nanosheets. In the Nyquist diagram (Fig. 13), the radius of each arc is associated with the charge-transfer process at the corresponding electrode/electrolyte interface.43–45 A smaller radius correlates with a lower charge-transfer resistance. Significantly, the AZO nanosheets show a smaller arc radius than ZnO nanosheets under irradiation, suggesting that a faster interfacial charge transfer occurred on AZO electrode/electrolyte interface.46
 |
| | Fig. 13 EIS Nyquist plots of ZnO and AZO nanosheets in 0.2 M Na2SO4 aqueous solution without bias under the simulated sunlight irradiation. | |
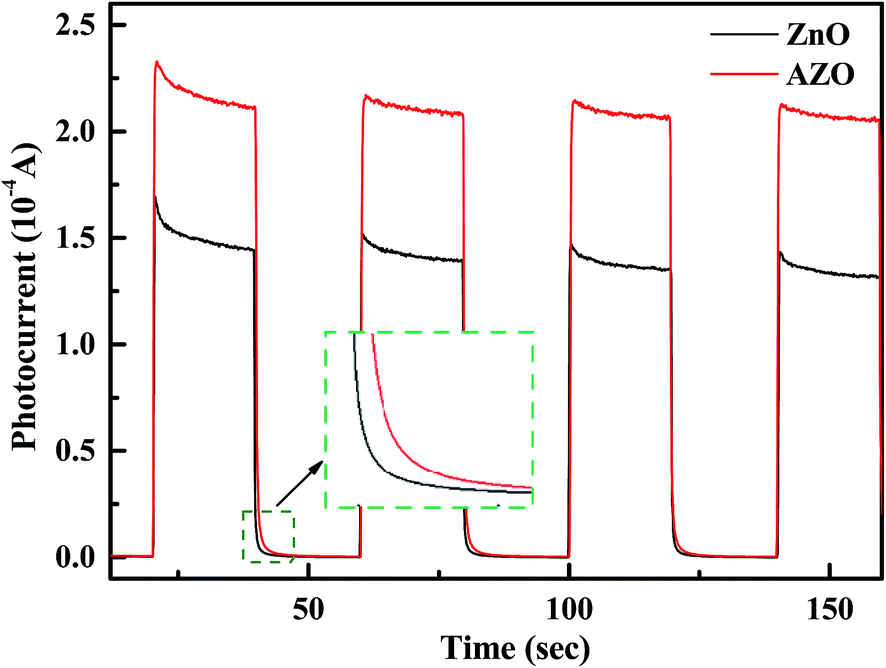
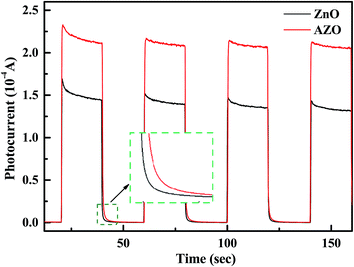
Transient photocurrent measurements are carried out to further investigate the effect of charge-transfer properties of ZnO and AZO nanosheets on the separation and recombination process of photogenerated electron–hole pairs. As shown in Fig. 14, with the light switched-on, the transient photocurrent response of AZO nanosheets is remarkably higher than that of ZnO nanosheets, which indicates a more efficient separation of the photoexcited electron–hole pairs.47,48 With the light switched-off, compared with ZnO nanosheets, the transient photocurrent response of AZO nanosheets moves towards the longer timescale. It means that AZO nanosheets retards the recombination and prolongs the lifetime of the photogenerated carriers.43,47 The substitutional incorporation of Al3+ at Zn2+ site make dopant Al act as an effective electron donor, which increases carrier concentration of ZnO and then increases its electrical conductivity. For semiconductor photocatalyst, enhanced electrical conductivity can retard the recombination of photoexcited electron–hole pairs. So, more holes are allowed to participate in the catalytic reaction and then the photocatalytic activity was improved.
 |
| | Fig. 14 Transient photocurrent responses of ZnO and AZO nanosheets in 0.2 M Na2SO4 aqueous solution without bias under the simulated sunlight irradiation. | |
Photocatalytic activity may be also related to the optical properties of catalysis. UV-vis diffuse reflectance spectra (DRS) are used to identify the optical properties of the samples. It is clearly observed from Fig. 15 that the ZnO nanosheets possess higher light absorption intensity compared with AZO nanosheets in the ultraviolet (UV) region and a nearly identical absorb edge. As shown in the inset, the band gap of the ZnO and AZO nanosheets is about 3.36 and 3.30 eV, respectively, which is very similar. It further indicates that the superior photocatalytic efficiency of the AZO nanosheets is not due to its ability of light absorption.
 |
| | Fig. 15 UV-vis diffuse reflectance spectra (DRS) of the ZnO and AZO nanosheets powder. The inset shows the plot of (αhv)2 versus energy Eg indicating the band gap of the ZnO and AZO nanosheets. | |
Dye photosensitized degradation is another efficient pathway for the degradation of dye pollutants. High dye adsorption capacity and charge-transfer property of AZO nanosheets play a good foundation for dye photosensitized degradation. Prior to dye sensitized photocatalytic testing, the solution was stirred in the dark for 80 min to reach the adsorption–desorption equilibrium of MO on the surface of ZnO and AZO nanosheets. The degradation of MO at various time intervals under visible light irradiation was determined, as shown in Fig. 16. It can be seen that the ZnO and AZO nanosheets absorb about 10% and 45% of the MO without light irradiation, respectively. Under the visible light irradiation, the degradation by AZO nanosheets (12.49%) is much higher than that of ZnO nanosheets (about 1.37%). According to the UV-vis diffuse reflectance spectra (as shown in Fig. 15), the ZnO and AZO nanosheets can only absorb UV-light with wavelength shorter than 400 nm in a photocatalytic process. However, AZO nanosheets can still obviously degrade MO dye under visible light irradiation (λ > 420 nm). It was due to happening a photosensitized degradation process. Al doping improves the dye adsorption capacity and charge-transfer property of AZO nanosheets, which makes dye photosensitized degradation process can be successfully proceeded on the surface of AZO nanosheets. This photosensitized degradation process expands the spectral response range of whole photo-excited degradation process for MO molecules themselves absorbing visible light. Compared with the semiconductor photo-excited degradation process, the dye photosensitized one requires a stronger interaction between dye molecules and the surface of catalysts, which is beneficial to the injection of photo-excited electrons from MO molecules into the CB band of AZO nanosheets.10 On the other hand, enhanced electrical conductivity of AZO nanosheets can promote the separation of electron–hole pairs, retard their recombination, and then improve the photosensitized catalytic activity. However, as poor interaction between MO and the surface of ZnO nanosheets and low adsorption capacity of MO on ZnO nanosheets, the amount of photo-excited electrons injecting from MO molecules into AZO nanosheets is far less than that of AZO nanosheets. Furthermore, due to the low electrical conductivity, the migration of photo-excited electrons on the surface of ZnO nanosheets is difficult and then the recombination of electron–hole pairs seriously happen. These reasons result in a nearly negligible dye photosensitized degradation process for ZnO nanosheets. However, the superior adsorption and electron-transfer ability of the AZO nanosheets promote an efficient dye photosensitized degradation process.
 |
| | Fig. 16 Normalized concentration changes of MO in the dark and then under visible light (l > 420 nm) irradiation in the presence of AZO nanosheets (0.75 g L−1) and ZnO nanosheets (0.75 g L−1). The initial concentration of MO is 100 mg L−1. | |
4. Conclusion
Porous AZO nanosheets were prepared through the calcination of hydroxide zinc carbonate precursor route. Various spectroscopic characterizations were performed for the AZO nanosheets. It revealed that Al doping enlarged the surface area of the porous AZO nanosheets and increased the zeta potential of AZO nanosheets, then significantly enhanced the adsorption rates and adsorption capacity for MO dye. The kinetics and equilibrium of adsorption process were found to follow the pseudo-second-order kinetic and Langmuir isotherm models, respectively. Furthermore, the AZO nanosheets exhibited superior photodecolorizative activity for recombination of photoexcited electron–hole pairs retarded by Al doping. In addition, the visible-light-driven dye photosensitized degradation was also an important reason for enhanced photodecolorizative activity. Therefore, AZO nanosheets became a potential multifunctional water treatment material.
Acknowledgements
This work was supported by the Natural Science Foundation of Hubei Province (Grant No. 2015CFB513), the Research Foundation of Yichang Science and Technology Bureau, China (Grant No. A15-302-a10) , Foundation of Key Laboratory of new building energy and building efficiency, Guangxi Province, China (Grant No. 15-J-22-2), and the Foundation of Key Laboratory for UV-Emitting Materials and Technology of Ministry of Education (Grant No. 130026504).
References
- W. Konicki, K. Cendrowski, X. Chen and E. Mijowska, Application of hollow mesoporous carbon nanospheres as an high effective adsorbent for the fast removal of acid dyes from aqueous solutions, Chem. Eng. J., 2013, 228, 824–833 CrossRef CAS.
- P. Tian, X. Y. Han, G. L. Ning, H. X. Fang, J. W. Ye, W. T. Gong and Y. Lin, Synthesis of porous hierarchical MgO and its superb adsorption properties, ACS Appl. Mater. Interfaces, 2013, 5, 12411–12418 CAS.
- W. Lei, D. Portehault, D. Liu, S. Qin and Y. Chen, Porous boron nitride nanosheets for effective water cleaning, Nat. Commun., 2013, 4, 1777 CrossRef PubMed.
- R. Chen, J. Yu and W. Xiao, Hierarchically porous MnO2 microspheres with enhanced adsorption performance, J. Mater. Chem. A, 2013, 1, 11682 CAS.
- L. Ai and Y. Zeng, Hierarchical porous NiO architectures as highly recyclable adsorbents for effective removal of organic dye from aqueous solution, Chem. Eng. J., 2013, 215–216, 269–278 CrossRef CAS.
- Y. X. Zhang, X. D. Hao, T. Wang, Y. X. Meng and X. Han, MnOx-modified ZnAl-LDOs as high-performance adsorbent for the removal of methyl orange, Dalton Trans., 2014, 43, 6667–6676 RSC.
- R. Chen, W. Wang, X. Zhao, Y. Zhang, S. Wu and F. Li, Rapid hydrothermal synthesis of magnetic CoxNi1−xFe2O4 nanoparticles and their application on removal of Congo red, Chem. Eng. J., 2014, 242, 226–233 CrossRef CAS.
- B. Liu, J. Wang, J. Wu, H. Li, Z. Li, M. Zhou and T. Zuo, Controlled fabrication of hierarchical WO3 hydrates with excellent adsorption performance, J. Mater. Chem. A, 2014, 2, 1947–1954 CAS.
- G. Lian, X. Zhang, H. Si, J. Wang, D. Cui and Q. Wang, Boron nitride ultrathin fibrous nanonets: one-step synthesis and applications for ultrafast adsorption for water treatment and selective filtration of nanoparticles, ACS Appl. Mater. Interfaces, 2013, 5, 12773–12778 CAS.
- R. Zhu, S. Cong, Y. Tian, H. Li, M. Chen, Y. Huang, Z. Zhao and Q. Li, A “three-in-one” water treatment material: nitrogen-doped tungstic acid, Chem. Commun., 2013, 49, 5787–5789 RSC.
- Y. Park, Y. Na, D. Pradhan, B.-K. Min and Y. Sohn, Adsorption and UV/visible photocatalytic performance of BiOI for methyl orange, rhodamine B and methylene blue: Ag and Ti-loading effects, CrystEngComm, 2014, 16, 3155 RSC.
- L. Ai, Y. Zeng and J. Jiang, Hierarchical porous BiOI architectures: facile microwave nonaqueous synthesis, characterization and application in the removal of Congo red from aqueous solution, Chem. Eng. J., 2014, 235, 331–339 CrossRef CAS.
- J. Lian, C. Zhang, Q. Li and D. H. Ng, Mesoporous (ZnO)x(MgO)1−x nanoplates: template-free solvothermal synthesis, optical properties, and their applications in water treatment, Nanoscale, 2013, 5, 11672–11678 RSC.
- J. C. Yu, Y. Ho and J. Zhang, Effects of F-Doping on the Photocatalytic Activity and Microstructures of Nanocrystalline TiO2 Powders, Chem. Mater., 2002, 14, 3808–3816 CrossRef CAS.
- M. Sathish, B. Viswanathan, R. P. Viswanath and C. S. Gopinath, Synthesis, Characterization, Electronic Structure, and Photocatalytic Activity of Nitrogen-Doped TiO2 Nanocatalyst, Chem. Mater., 2005, 17, 6349–6353 CrossRef CAS.
- X. Zhao, W. Wang, Y. Zhang, S. Wu, F. Li and J. P. Liu, Synthesis and characterization of gadolinium doped cobalt ferrite nanoparticles with enhanced adsorption capability for Congo red, Chem. Eng. J., 2014, 250, 164–174 CrossRef CAS.
- S. Kuai, Z. Zhang and Z. Nan, Synthesis of Ce3+ doped ZnFe2O4 self-assembled clusters and adsorption of chromium(VI), J. Hazard. Mater., 2013, 250–251, 229–237 CrossRef CAS PubMed.
- C. Wei, H. Pang, C. Cheng, J. Zhao, P. Li and Y. Zhang, Mesoporous 3D ZnO–NiO architectures for high-performance supercapacitor electrode materials, CrystEngComm, 2014, 16, 4169 RSC.
- Z. Lin, F. Guo, C. Wang, X. Wang, K. Wang and Y. Qu, Preparation and sensing properties of hierarchical 3D assembled porous ZnO from zinc hydroxide carbonate, RSC Adv., 2014, 4, 5122 RSC.
- L. Ren, T. Tian, Y. Li, J. Huang and X. Zhao, High-performance UV photodetection of unique ZnO nanowires from zinc carbonate hydroxide nanobelts, ACS Appl. Mater. Interfaces, 2013, 5, 5861–5867 CAS.
- J. Shi, P. Zhao and X. Wang, Piezoelectric-polarization-enhanced photovoltaic performance in depleted-heterojunction quantum-dot solar cells, Adv. Mater., 2013, 25, 916–921 CrossRef CAS PubMed.
- S. Kuai and Z. Nan, Formation of sandwich structured ZnCe0.03Fe1.97O4@nSiO2@SBA-15 and adsorptive removal of methylene blue from aqueous solution, Chem. Eng. J., 2014, 244, 273–281 CrossRef CAS.
- W. L. Ong, S. Natarajan, B. Kloostra and G. W. Ho, Metal nanoparticle-loaded hierarchically assembled ZnO nanoflakes for enhanced photocatalytic performance, Nanoscale, 2013, 5, 5568–5575 RSC.
- X. Wang, W. Cai, Y. Lin, G. Wang and C. Liang, Mass production of micro/nanostructured porous ZnO plates and their strong structurally enhanced and selective adsorption performance for environmental remediation, J. Mater. Chem., 2010, 20, 8582 RSC.
- X. Wang, W. Cai, S. Liu, G. Wang, Z. Wu and H. Zhao, ZnO hollow microspheres with exposed porous nanosheets surface: structurally enhanced adsorption towards heavy metal ions, Colloids Surf., A, 2013, 422, 199–205 CrossRef CAS.
- B. E. Sernelius, K. F. Berggren, Z. C. Jin, I. Hamberg and C. G. Granqvist, Band-gap tailoring of ZnO by means of heavy Al doping, Phys. Rev. B: Condens. Matter Mater. Phys., 1988, 37, 10244–10248 CrossRef CAS.
- L. K. Jagadamma, M. Al-Senani, A. El-Labban, I. Gereige, G. O. Ngongang Ndjawa, J. C. D. Faria, T. Kim, K. Zhao, F. Cruciani, D. H. Anjum, M. A. McLachlan, P. M. Beaujuge and A. Amassian, Polymer Solar Cells with Efficiency >10% Enabled via a Facile Solution-Processed Al-Doped ZnO Electron Transporting Layer, Adv. Energy Mater., 2015, 5, 1500204 Search PubMed.
- Z. Xing, B. Geng, X. Li, H. Jiang, C. Feng and T. Ge, Self-assembly fabrication of 3D porous quasi-flower-like ZnO nanostrip clusters for photodegradation of an organic dye with high performance, CrystEngComm, 2011, 13, 2137 RSC.
- X. Y. Yu, X. Z. Yao, T. Luo, Y. Jia, J. H. Liu and X. J. Huang, Facile synthesis of urchin-like NiCo2O4 hollow microspheres with enhanced electrochemical properties in energy and environmentally related applications, ACS Appl. Mater. Interfaces, 2014, 6, 3689–3695 CAS.
- P. Tian, J. Ye, G. Ning, W. Gong, N. Xu, Q. Zhang and Y. Lin, NiO hierarchical structure: template-engaged synthesis and adsorption property, RSC Adv., 2012, 2, 10217 RSC.
- Y. X. Zhang, X. D. Hao, F. Li, Z. P. Diao, Z. Y. Guo and J. Li, pH-Dependent Degradation of Methylene Blue via Rational-Designed MnO2 Nanosheet-Decorated Diatomites, Ind. Eng. Chem. Res., 2014, 53, 6966–6977 CrossRef CAS.
- Y. Wang, J. Ma and K. Chen, Adsorptive removal of Cr(VI) from wastewater by alpha-FeOOH hierarchical structure: kinetics, equilibrium and thermodynamics, Phys. Chem. Chem. Phys., 2013, 15, 19415–19421 RSC.
- S. Xie, B. Zheng, Q. Kuang, X. Wang, Z. Xie and L. Zheng, Synthesis of layered protonated titanate hierarchical microspheres with extremely large surface area for selective adsorption of organic dyes, CrystEngComm, 2012, 14, 7715 RSC.
- L. Wang, J. Li, Y. Wang, L. Zhao and Q. Jiang, Adsorption capability for Congo red on nanocrystalline MFe2O4 (M = Mn, Fe, Co, Ni) spinel ferrites, Chem. Eng. J., 2012, 181–182, 72–79 CrossRef CAS.
- X. Wang, C. Zhan, B. Kong, X. Zhu, J. Liu, W. Xu, W. Cai and H. Wang, Self-curled coral-like gamma-Al2O3 nanoplates for use as an adsorbent, J. Colloid Interface Sci., 2015, 453, 244–251 CrossRef CAS PubMed.
- S. Zhang, W. Xu, M. Zeng, J. Li, J. Li, J. Xu and X. Wang, Superior adsorption capacity of hierarchical iron oxide@magnesium silicate magnetic nanorods for fast removal of organic pollutants from aqueous solution, J. Mater. Chem. A, 2013, 1, 11691 CAS.
- T. Wang, L. Zhang, H. Wang, W. Yang, Y. Fu, W. Zhou, W. Yu, K. Xiang, Z. Su, S. Dai and L. Chai, Controllable synthesis of hierarchical porous Fe3O4 particles mediated by poly(diallyldimethylammonium chloride) and their application in arsenic removal, ACS Appl. Mater. Interfaces, 2013, 5, 12449–12459 CAS.
- S. Zeng, S. Duan, R. Tang, L. Li, C. Liu and D. Sun, Magnetically separable Ni0.6Fe2.4O4 nanoparticles as an effective adsorbent for dye removal: synthesis and study on the kinetic and thermodynamic behaviors for dye adsorption, Chem. Eng. J., 2014, 258, 218–228 CrossRef CAS.
- B. Chen, Z. Zhu, J. Ma, Y. Qiu and J. Chen, Surfactant assisted Ce–Fe mixed oxide decorated multiwalled carbon nanotubes and their arsenic adsorption performance, J. Mater. Chem. A, 2013, 1, 11355 CAS.
- L. Ai, H. Yue and J. Jiang, Sacrificial template-directed synthesis of mesoporous magnesium oxide architectures with superior performance for organic dye adsorption, Nanoscale, 2012, 4, 5401–5408 RSC.
- L. Ai, C. Zhang and L. Meng, Adsorption of Methyl Orange from Aqueous Solution on Hydrothermal Synthesized Mg–Al Layered Double Hydroxide, J. Chem. Eng. Data, 2011, 56, 4217–4225 CrossRef CAS.
- H. Chen, G. Dai, J. Zhao, A. Zhong, J. Wu and H. Yan, Removal of copper(II) ions by a biosorbent–Cinnamomum camphora leaves powder, J. Hazard. Mater., 2010, 177, 228–236 CrossRef CAS PubMed.
- Y. Hou, Z. Wen, S. Cui, X. Guo and J. Chen, Constructing 2D Porous Graphitic C N Nanosheets/Nitrogen-Doped Graphene/Layered MoS Ternary Nanojunction with Enhanced Photoelectrochemical Activity, Adv. Mater., 2013, 25, 6291–6297 CrossRef CAS PubMed.
- N. Zhang and Y.-J. Xu, Aggregation- and Leaching-Resistant, Reusable, and Multifunctional Pd@CeO2 as a Robust Nanocatalyst Achieved by a Hollow Core–Shell Strategy, Chem. Mater., 2013, 25, 1979–1988 CrossRef CAS.
- X. Pan, Y. Zhao, S. Liu, C. L. Korzeniewski, S. Wang and Z. Fan, Comparing graphene-TiO2 nanowire and graphene-TiO2 nanoparticle composite photocatalysts, ACS Appl. Mater. Interfaces, 2012, 4, 3944–3950 CAS.
- M. Q. Yang, N. Zhang and Y. J. Xu, Synthesis of fullerene-, carbon nanotube-, and graphene-TiO2 nanocomposite photocatalysts for selective oxidation: a comparative study, ACS Appl. Mater. Interfaces, 2013, 5, 1156–1164 CAS.
- J. Wang, P. Wang, Y. Cao, J. Chen, W. Li, Y. Shao, Y. Zheng and D. Li, A high efficient photocatalyst Ag3VO4/TiO2/graphene nanocomposite with wide spectral response, Appl. Catal., B, 2013, 136–137, 94–102 CrossRef CAS.
- Q.-P. Luo, X.-Y. Yu, B.-X. Lei, H.-Y. Chen, D.-B. Kuang and C.-Y. Su, Reduced Graphene Oxide-Hierarchical ZnO Hollow Sphere Composites with Enhanced Photocurrent and Photocatalytic Activity, J. Phys. Chem. C, 2012, 116, 8111–8117 CAS.
|
| This journal is © The Royal Society of Chemistry 2016 |
Click here to see how this site uses Cookies. View our privacy policy here.