
Synthesis of porous ZnO based materials using an agarose gel template for H2S desulfurization
Dat T. Tran
U.S. Army Research Laboratory, RDRL-SED-E, Adelphi, Maryland 20783-1138, USA. E-mail: dat.t.tran4.civ@mail.mil; Fax: +1 301 394 0273; Tel: +1 301 394 0293
First published on 18th December 2015
Abstract
This work describes the synthesis and characterization of pure ZnO and Ni-doped ZnO materials using agarose gel as a template for H2S desulfurization. H2S gas is not only harmful to the environment, but also corrosive to metals and poisonous to fuel reformer and fuel cell catalysts. Removal of H2S is an important step in fuel processing technology. This synthetic approach resulted in highly porous network ZnO based sorbent materials. The phase structure and morphology of these two materials were characterized by X-ray diffraction (XRD), scanning electron microscopy (SEM), transmission electron microscopy (TEM), Brunauer, Emmett and Teller (BET) surface area measurements, and mercury porosimetry. The H2S desulfurization performance of the as-synthesized ZnO and Ni-doped ZnO materials versus commercial ZnO was studied in a simulated fuel processing operation at 400 °C with an initial H2S concentration of 400 ppmv. It is shown that the sulfur adsorption capacity is greatly affected by the size and morphology of the particles. Desulfurization analysis revealed that commercial ZnO exhibits a low saturation capacity of 245 mg S per g while as-synthesized ZnO has a capacity of 457 mg S per g. Notably, when ZnO was doped with 4 wt% Ni, the sorbent capacity increased still further to 730 mg S per g.
1. Introduction
Agarose gel has been widely used as a template for the preparation of mesoporous or macroporous metal oxide structures. Caruso and co-workers have used this approach to fabricate various macroporous metal oxide materials including SiO2, TiO2, ZrO2, SnO2, Nb2O5, Al2O3, and mixed metal oxides such as ZrO2–TiO2 and Al2O3–TiO2.1–5 SEM images have shown that agarose gel as a template has a highly uniform and large pore size measuring several hundreds of nanometers.1,2 Fan et al. have also used the agarose gel approach to fabricate free-standing porous metal oxide monoliths such as TiO2 and SiO2 for photocatalysis.6 The use of an agarose gel template for pore generation has proven to be an excellent method due to its versatility, thermosensitivity, macroporous structure, natural polysaccharide polymer, and relatively low cost.3Hydrogen sulfide (H2S) is commonly found in natural gas, synthetic gas and coal/biomass-derived syngas. This toxic gas is not only harmful to the environment, but also corrosive to metals and poisonous to fuel reformer and fuel cell catalysts. Therefore H2S needs to be removed. Among sorbents for H2S removal, zinc oxide (ZnO) and Zn-based sorbents have been widely used and remain the preferred choices due to their efficiency and reliability.7,8 In many studies, ZnO is incorporated as part of a composite where it is dispersed on different support materials such as sepiolite,9 carbon nanofiber webs,10 graphite oxide,11,12 Al2O3,13 mesoporous silica MSU-1,14 and SBA-15.15,16 Elyassi and co-workers reported H2S removal performance for sorbents comprised of copper–zinc oxides supported on mesoporous silica, yielding an adsorption capacity of 80 mg S per g sorbent.17 Wang et al. have shown the preparation of ZnO nanoparticles dispersed on mesoporous aluminum silicate materials to give an H2S adsorption capacity of 103.2 mg S per g.18
Li and King have used commercial ZnO as a sorbent to remove H2S from small fuel processor steam reformate streams with an initial concentration of 25 ppm over the temperature range 150–250 °C. The focus of their study was to determine the efficiency of ZnO for lowering the H2S concentrations to 100 ppbv.19 Habibi et al. assert that nano-ZnO morphology influences the adsorption capacity of H2S removal from natural gas. In their study, they found that a rod-like nano ZnO morphology was better than a spherical morphology and achieved a capacity of 240 mg S per g ZnO at an optimized condition with H2S feed concentration of 1 mol%.20 In general, desulfurization of H2S over ZnO sorbent takes place through a well-known reaction: ZnO(s) + H2S(g) → ZnS(s) + H2O(g). Recently, a review by Jung et al. focused on a study of Zn-based sorbent materials for H2S removal in the Integrated Gasification Combined Cycle (IGCC) at a wide range of temperatures from 400–700 °C.21 Some of important findings outlined in this review include: (a) adsorption capacities of sorbents for H2S removal depend on physical properties such as surface area, pore volume and particle size; (b) various preparation approaches such as co-precipitation and physical mixing method affect the physical properties of sorbent materials differently; and (c) adding promoters such as Fe, Co, Ni and Ce to the sorbents may improve the regeneration properties of the sorbents. Babe et al. have additionally investigated the crystallite size effect on the sulfidation of ZnO by H2S. They found that sulfidation of large crystallites was more challenging and appeared to be kinetically limited because the system did not exhibit a clear thermodynamic limitation.22
Researchers have also explored other materials, for example, lanthanum oxide-based H2S sorbents for high temperature fuel cell applications including molten carbonate fuel cell (MCFC) and solid oxide fuel cell (SOFC) systems.23,24 Pahalagedara et al. have reported the synthesis of mesoporous cobalt oxide sorbent material using P123 surfactant as a template for desulfurization of H2S at low temperatures (25–250 °C). This group showed that the presence of surface exposed particles and interconnected intraparticle voids could increase the H2S diffusion rates and thereby adsorption capacity.25 Another study has involved removal of H2S using three-dimensionally ordered macroporous iron oxide at 300–350 °C,26 while other research efforts have focused on removal of H2S from biogas.27–30
Recently, there were lots of ZnO structures synthesized using polymer templates or organic templates via co-precipitate, sol–gel/hydrothermal methods to produce many different morphologies such as flower-like, flake-like, sphere-like, rod-like, belt-like and wire-like, just to name a few.31–34 In this study, we expand our work with porous materials formed with agarose gel templates to include various metal oxides. Specifically, we report the first use of agarose gel as a template to prepare porous network ZnO based sorbents for removal of H2S. Also, the preparation of Ni-doped ZnO containing nano-NiO particles and its preliminary performance of H2S removal were studied.
2. Experimental
2.1 Materials
All chemicals were used as received without further purification. Zinc nitrate hexahydrate (reagent grade, 98%) and agarose (type II-A, medium EEO) were obtained from Sigma-Aldrich. Commercial ZnO (99%) was purchased from Alfa Aesar. Deionized water was used in all syntheses.2.2 Synthesis of porous ZnO-based sorbents
Pure ZnO and Ni (4 wt%)-doped ZnO were synthesized using agarose gel as a template. In a typical synthesis of pure ZnO, a solution of 4.0 g Zn(NO3)2·6H2O and 0.70 g agarose gel was prepared by dissolving zinc nitrate in 30 mL deionized water followed by addition of agarose gel. The solution was slowly heated to a boil. After the solution became clear, it was transferred to a Petri dish and allowed to cool down to become a gel at room temperature overnight. The solid gel was cut into many small cubes and placed in a clean crucible for calcination. The gel was heated to 600 °C at a ramp rate of 0.4 °C min−1 and held at 600 °C for 5 h in the presence of air. In the case of Ni-doped ZnO, a solution of 4.0 g Zn(NO3)2·6H2O, 0.20 g Ni(NO3)2·6H2O and 0.7 g agarose gel was prepared by dissolving zinc nitrate and nickel nitrate in 30.0 mL deionized water followed by addition of agarose gel. This reaction was carried out the same procedure as above to obtain Ni-doped ZnO sorbent material.2.3 Desulfurization of H2S gas
Sorbent sulfidation tests were carried out at 400 °C in a down flow packed-bed quartz-tube reactor (inner diameter of 1.0 cm) with a total amount of 0.10 g sorbent under atmospheric pressure. Analytic grade gases from Airgas were used to simulate fuel processing conditions. The incoming gas mixture stream composed of 51% H2, 30% He, 10% water, 8% CO2, and 8% H2S containing gas cylinder (a mixture of 0.5% H2S balanced with 99.5% He) at a rate of 100 mL min−1. The H2S levels exiting the sorbent column were continuously recorded by a sulfur analyzer in real time. Water was removed from the gas stream by a condenser before the analyzer.2.4 Materials characterization
Phase(s) of samples determined by powder X-ray diffraction (PXRD) were obtained from a Rigaku Ultima III instrument with CuKα radiation (λ = 1.5418 Å). Crystallite size was evaluated by collecting diffraction data in a Bragg–Brentano configuration and correcting for instrumental broadening by using LaB6 (NIST; 660A). The measurements were conducted with a scan rate of 1.0 degree (2θ) per minute and each diffraction data point was collected at the interval of 0.02 degree (2θ) for the total spectrum range of 20 to 80 degree (2θ). The morphology of the sorbent materials was examined using a FEI QUANTA 200 F scanning electron microscope (SEM). The Brunauer, Emmett and Teller (BET) surface areas of the sorbent samples were measured with a Micromeritics TriStar II (TriStar II 3020 V1.03) Analyzer using N2 gas as the adsorbate at 77.3 K. Adsorption/desorption isotherm measurements were collected in the relative pressure range P/P0 from 0.05 to 1.0. The samples were de-gassed at 200 °C for several hours prior to the adsorption analysis. Macroporous structures of samples were additionally analyzed using mercury intrusion analyzer PM 60 in a pressure range from 0.2–60![[thin space (1/6-em)]](https://www.rsc.org/images/entities/char_2009.gif) 000 psi (Quantachrome Company, Boynton Beach, Florida). Samples were de-gassed under vacuum at 200 °C for 6 hours before analysis. Transmission electron microscopy (TEM) and scanning transmission electron microscopy (STEM) were conducted with a JEOL 2100 F scope operating at 200 kV. The samples were prepared by sonication in ethanol for 3 minutes prior to drop-casting on a TEM grid covered with holey carbon film. Bright Field (BF) STEM image was acquired using a JEOL BF detector. The energy dispersive spectroscopy (EDS) mapping of the particles was collected on a BF image using a Gatan system.
000 psi (Quantachrome Company, Boynton Beach, Florida). Samples were de-gassed under vacuum at 200 °C for 6 hours before analysis. Transmission electron microscopy (TEM) and scanning transmission electron microscopy (STEM) were conducted with a JEOL 2100 F scope operating at 200 kV. The samples were prepared by sonication in ethanol for 3 minutes prior to drop-casting on a TEM grid covered with holey carbon film. Bright Field (BF) STEM image was acquired using a JEOL BF detector. The energy dispersive spectroscopy (EDS) mapping of the particles was collected on a BF image using a Gatan system.
3. Results and discussion
3.1 Physical properties of the sorbent materials
Porous pure ZnO and Ni-doped ZnO were synthesized using agarose gel as a template. A commercially available pure zinc oxide ZnO sample was additionally used as a reference sorbent for comparison. As shown in Fig. 1, the PXRD pattern of commercial ZnO (blue) and as-synthesized ZnO (red) is indexed as pure phase ZnO (JCPDF #01-089-0510). The broadened line width of as-synthesized ZnO and Ni-doped ZnO in the PXRD patterns indicates that the crystallite size should be smaller than commercial ZnO. Additionally, we found that ZnO doped with 4 wt% Ni (green) exhibits a slightly different pattern. The pattern predominantly retains the pure ZnO structure profile except for the very small NiO peaks indexed at around 2θ = 37° and 43° (JCPDF #01-089-7390), which indicate uniform dispersion of NiO nanoparticles across the ZnO particle. This dispersion is further confirmed by TEM, as described below.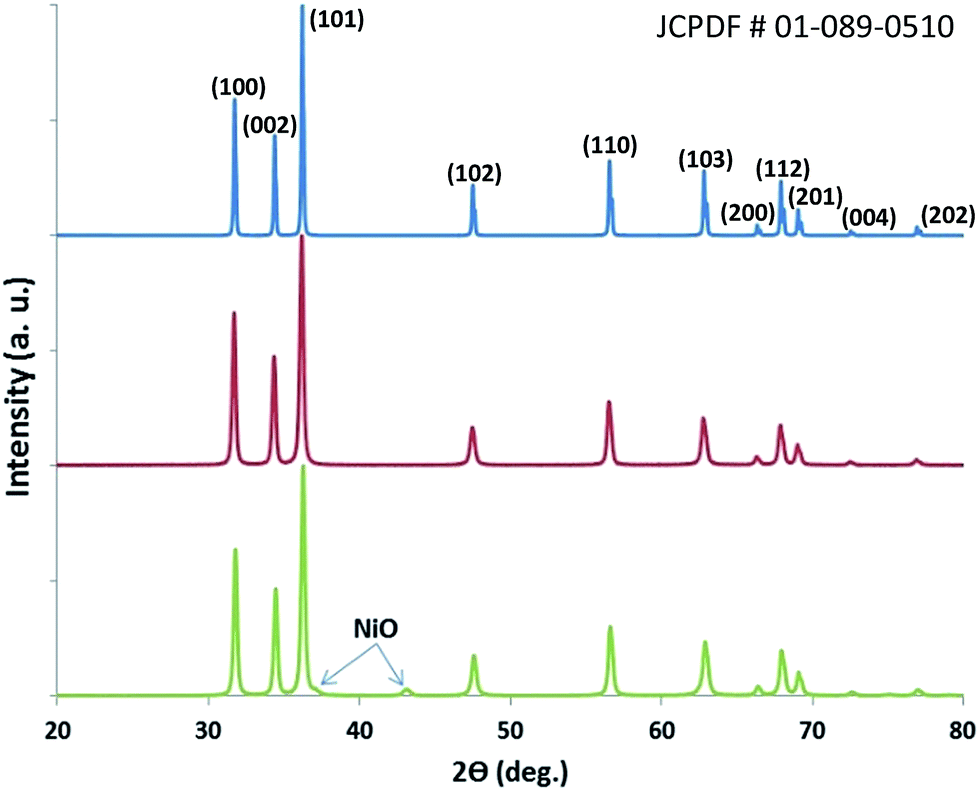 | ||
| Fig. 1 X-ray diffraction patterns of commercial ZnO (blue), as-synthesized ZnO (red) and Ni-doped ZnO (green). | ||
The average crystallite size was estimated for these ZnO based materials from measurement of the broadening of the X-ray reflections. Utilizing the Scherrer equation:35
| β2 = βM2 − βS2 |
Fig. 2a and b show the N2 sorption isotherms of these materials being closest to the IUPAC classification of a type IV isotherm with an H3 hysteresis loop – characteristics of a mesoporous material.36 Based on the high slope of the adsorption isotherms near saturation, indicating further pore filling, the materials may also have pores in the macropore size range (>500 Å) that are outside the limits of detection of the gas adsorption method. The surface area of these sorbent materials was examined using BET measurement (Table 2). The commercial ZnO was found to have a low surface area of 1.5 m2 g−1, which we attribute to its negligible porosity, larger crystallites, and high density. On the other hand, pure as-synthesized ZnO has a relatively higher surface area of 10.2 m2 g−1. The higher surface area of this sorbent material can be attributed to the macro-scale porosity running throughout the entire structure. When ZnO was doped with 4 wt% Ni, the surface area was reduced to 6.8 m2 g−1, but retains its high porosity. BJH calculations from the N2 isotherms (Fig. 2) were used to calculate pore volume and pore size of as-synthesized ZnO and Ni-doped ZnO. The pore volume of as-synthesized ZnO and Ni-doped ZnO were found to be 0.029 cm3 g−1 and 0.025 cm3 g−1, respectively. A comparison of the pore size distribution (insets of Fig. 2a and b) shows that both materials have similar pore size distribution from mesopore of ∼3 nm to macropore of >50 nm. These results correspond well to the SEM analyses. While the study of macroporous structures was limited by N2 sorption isotherms, the macroporous structure of the samples was additionally characterized using mercury porosimetry. Fig. 2c shows the bimodal pore size distribution obtained for the as-synthesized ZnO sample using mercury porosimetry. The first peak represents the mode pore diameter of 0.105 μm while the second peak, at approximately 100 μm, is believed to be due to inter-particle intrusion. The total surface area of this sample as-synthesized ZnO was found to be about 14.0 m2 g−1. In case of Ni-doped ZnO, the mode pore diameter value was approximately 122.5 μm (Fig. 2d). However, this value does not represent the true pore size because of the filling of inter-particle voids. The total surface area of this sample Ni-doped ZnO was determined to be about 11.6 m2 g−1. Overall, the analyses of both methods provide comparable results.
 | ||
| Fig. 2 N2 adsorption (blue) and desorption (red) isotherms for as-synthesized ZnO (a) and Ni-doped ZnO (b). Inset shows the pore size distribution. Mercury intrusion analysis for macroporous structures of as-synthesized ZnO (c) and Ni-doped ZnO (d). | ||
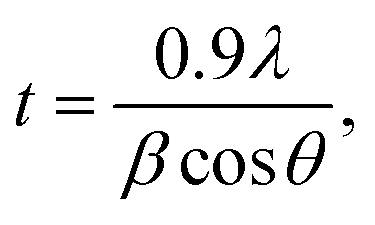
As expected, SEM analyses reveal the starkly different morphologies between commercial ZnO and as-prepared ZnO based materials after calcination at 600 °C in air to remove the agarose template. The commercial ZnO (Fig. 3a) is a bulk powder and consists of cube- or rod-like particles in the submicron to micron range, while as-synthesized ZnO (Fig. 3b) and Ni-doped ZnO (Fig. 3c) are sponge-like materials and contain a highly porous network structure with an interconnected mesopore/macropore hybrid.
 | ||
| Fig. 3 SEM images of commercial ZnO (a), porous ZnO as-synthesized (b) and Ni-doped ZnO (c). The scale bar is the same for all images. | ||
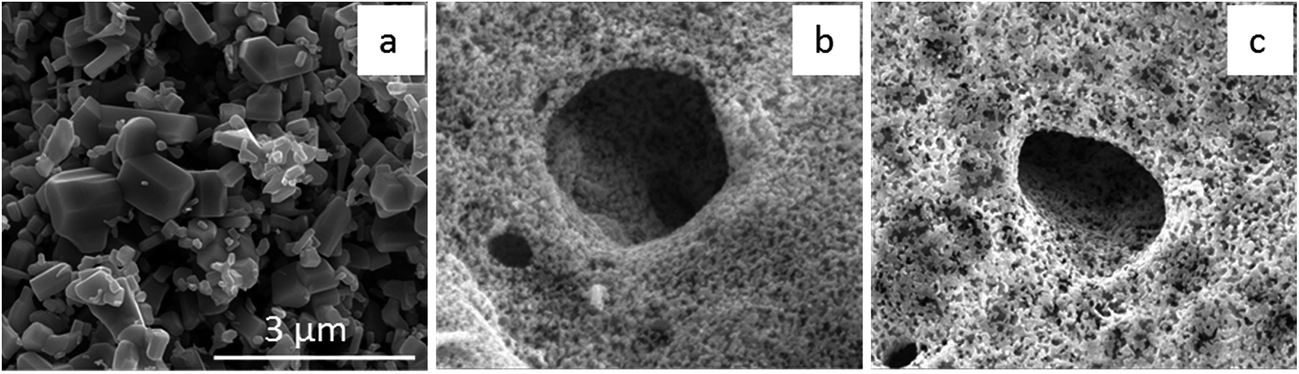
The as-synthesized ZnO (Fig. 4a) and Ni-doped ZnO (Fig. 4b) were further analyzed by TEM and STEM. For imaging and compositional analysis, the samples were dispersed into small particles by sonication. The as-synthesized ZnO consists of spherical nanoparticles with diameters of approximately 30 to 100 nm. Interestingly, for ZnO doped with Ni, TEM shows that ZnO particle sizes (Fig. 4b) are increased slightly, upon which the nickel is uniformly dispersed across the ZnO nanoparticle. The small clusters are present throughout the nanoparticle, the largest approximately 20 nm in diameter with the majority of visible clusters less than 10 nm.
 | ||
| Fig. 4 TEM images of as-synthesized ZnO (a), and Ni-doped ZnO (b). | ||
Elemental mapping using EDS was performed on a bright field (BF) STEM image of Ni-doped ZnO (Fig. 5) to analyze the composition of the particles. Fig. 5 clearly shows that small particles on the surface of the big particle contain mainly Ni while the big particle as support contains mainly Zn. By combining the observation from Fig. 4b and elemental analysis from Fig. 5, we can conclude that nickel particles with smaller size are decorated uniformly on the surface of the larger ZnO nanoparticles.
 | ||
| Fig. 5 STEM bright field image with EDS elemental analysis of Ni-doped ZnO using agarose gel as a template. | ||
3.2 H2S gas testing and regeneration
The sulfidation performance of the samples (Table 2) is defined as milligram of sulfur adsorbed per gram of adsorbent (mg S per g). Fig. 6 shows the experimental sulfur removal results obtained by the weight of 0.1 g of each sample at 400 °C with an incoming H2S concentration of 400 ppmv as one of the simulated reformate gas conditions (water, H2S, H2, He, and CO2). Table 2 summarizes the surface area and adsorption capacity of the sorbents. From the experimental data, it was possible to determine the sulfur capacity by integrating under the curve of sulfur removal data and normalizing per unit mass. Fig. 6 shows the results of H2S desulfurization where commercial ZnO exhibits a low sulfur removal capacity of 245.2 mg S per g sorbent as it quickly uptakes H2S and reaches the saturation point fast; meanwhile the as-synthesized ZnO has a much higher sulfur uptake capacity of 457.3 mg S per g – nearly a two-fold increase as it significantly extends the uptake curve and rises at a slower rate to the saturation point. The greater H2S desulfurization by as-synthesized ZnO is attributed to its nanoparticle morphology and porosity, which makes its surface more active as compared to commercial ZnO in micron particle size. This nanosize effect, inducing high performance, adds to the evidence of a recent report on ZnO nanowires,37 and other reports, showing the effect of ZnO particle size on adsorption performance.22,38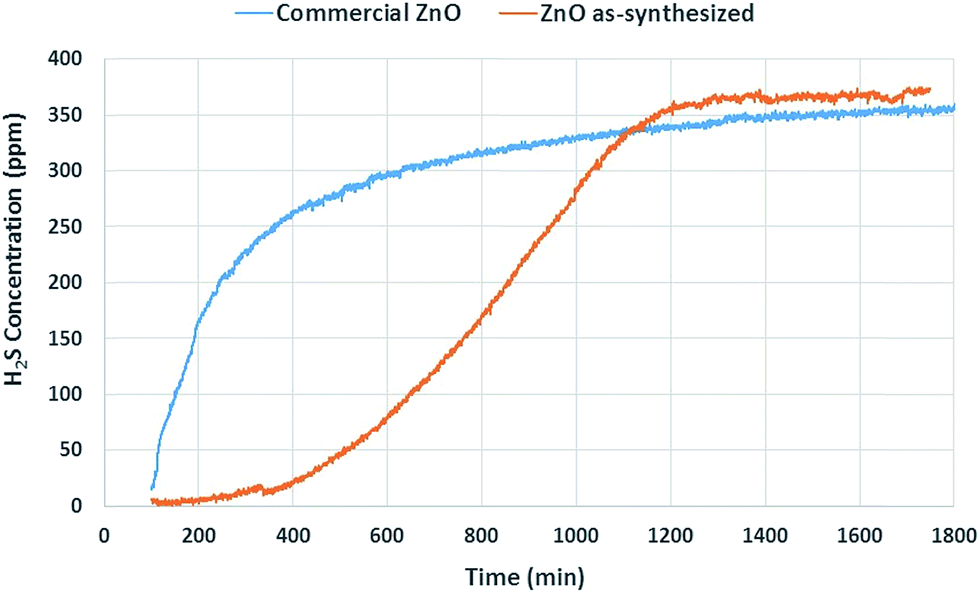 | ||
| Fig. 6 Plot of outlet H2S concentration as a function of time for commercial ZnO (blue), and as-synthesized ZnO (orange). | ||
Moreover, when ZnO was doped with 4 wt% Ni, the sulfur adsorption for this sample (Fig. 7, blue curve) was further improved to a higher capacity of 730.0 mg S per g. This significant improvement can be attributed to the addition of a small amount of Ni (4 wt%) nanoparticles doped onto the ZnO structure. We also noted that when ZnO was doped with more than 4 wt% Ni, the sulfur removal capacity decreased to about 300 mg S per g. Further investigation on this effect is underway. After sulfidation for the 1st cycle, we regenerated the sample in air at 600 °C for 5 hours and ran the sample again for a 2nd cycle (Fig. 7, orange curve). The result shows that Ni-doped ZnO sorbent can be regenerated with 100% sulfur removal capacity of its 1st cycle. Adding promoters such as Ni and other transition metals to the sorbents was well studied in improving the regeneration properties of the sorbents.21
 | ||
| Fig. 7 Plot of outlet H2S concentration as a function of time for Ni-doped ZnO (blue, 1st cycle), and regeneration after calcination at 600 °C in air (orange, 2nd cycle). | ||
The 4 wt% Ni-doped ZnO sample was examined with XRD after the 1st and 2nd sulfur adsorption cycles. The phase structures from this analysis can be seen in Fig. 8, which consistently shows a mixture of products for the Ni-doped ZnO samples post H2S exposure for both cycles. Specifically, ZnS and Ni3S2 as indexed to JCPDF #01-083-2360 and JCPDF #01-071-1682, respectively, were identified. From these XRD patterns, we hereby propose the reactions as shown in eqn (1) and (2) below:
| ZnO + H2S ↔ ZnS + H2O | (1) |
| 3NiO + 2H2S ↔ Ni3S2 + 2H2O + ½O2 | (2) |
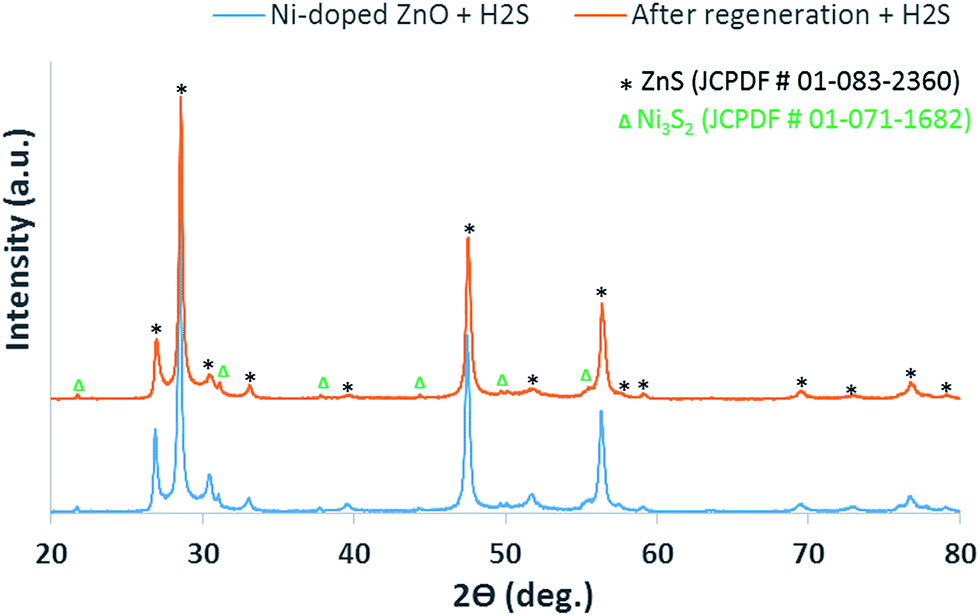 | ||
| Fig. 8 XRD patterns of Ni-doped ZnO after H2S desulfurization for 1st cycle (blue) and 2nd cycle after regeneration (orange). | ||
As expected, adding Ni to ZnO enhances further H2S adsorption performance due to NiO nanoparticles being well dispersed on ZnO structure, which creates additional active sites for reacting with H2S. This improvement can be confirmed by eqn (1) and (2) and the products observed in the XRD analyses.
4. Conclusions
In summary, porous ZnO and Ni-doped ZnO templated by agarose gel are promising materials for removal of H2S gas. This approach enables us to create networked and highly porous sorbent materials that consist of an interconnected mesopore/macropore hybrid throughout the particle. TEM reveals that porous ZnO consists of ZnO nanoparticles throughout the structure and Ni-doped ZnO contains NiO nanoparticles uniformly dispersed across the ZnO nanoparticles. The saturation adsorption capacity of as-synthesized ZnO is almost double as compared to commercial ZnO. When loading ZnO with 4 wt% Ni, the material displays a saturation adsorption capacity of 730 mg S per g, which is nearly a three-fold increase compared to commercial ZnO. Further, the ZnO with 4 wt% Ni was easily regenerated by heat in air, retaining 100% of its initial H2S adsorption capacity. The role of Ni in enhancing the H2S adsorption performance was studied in detail by XRD analysis. This synthetic method opens up a new route to create porous materials tailored to applications including gas adsorption, catalysis and separation. Specifically, desulfurization of H2S is an important step in fuel processing technology.Acknowledgements
The author would like to thank Dr Scott Walck (U.S. Army Research Laboratory, Aberdeen Proving Ground, MD 21005) for helping with TEM/EDS analyses.References
- F. Huang, M. Zhou, Y. B. Cheng and R. A. Caruso, Chem. Mater., 2006, 18, 5835–5839 CrossRef CAS.
- J. Zhou, M. Zhou and R. A. Caruso, Langmuir, 2006, 22, 3332–3336 CrossRef CAS PubMed.
- G. L. Drisko, V. Luca, E. Sizgek, N. Scales and R. A. Caruso, Langmuir, 2009, 25, 5286–5293 CrossRef CAS PubMed.
- G. L. Drisko, P. Imperia, M. de los Reyes, V. Luca and R. A. Caruso, Langmuir, 2010, 26, 14203–14209 CrossRef CAS PubMed.
- G. L. Drisko, X. Wang and R. A. Caruso, Langmuir, 2011, 27, 2124–2127 CrossRef CAS PubMed.
- X. Fan, H. Fei, D. H. Demaree, D. P. Brennan, J. M. S. John and S. R. J. Oliver, Langmuir, 2009, 25, 5835–5839 CrossRef CAS PubMed.
- N. Haimour, R. El-Bishtawi and A. Ail-Wahbi, Desalination, 2005, 181, 145–152 CrossRef CAS.
- M. Behl, J. Yeom, Q. Lineberry, P. K. Jain and M. A. Shannon, Nat. Nanotechnol., 2012, 7, 810–815 CrossRef CAS PubMed.
- R. Portela, F. Rubio-Marco, P. Leret, J. F. Fernandez, M. A. Banares and P. Avila, J. Mater. Chem. A, 2015, 3, 1306–1316 CAS.
- S. Kim, B. Bajaj, C. K. Byun, S. J. Kwon, H. I. Joh, K. B. Yi and S. Lee, Appl. Surf. Sci., 2014, 320, 218–224 CrossRef CAS.
- H. S. Song, M. G. Park, S. J. Kwon, K. B. Yi, E. Croiset, Z. Chen and S. C. Nam, Appl. Surf. Sci., 2013, 276, 646–652 CrossRef CAS.
- H. S. Song, M. G. Park, E. Croiset, Z. Chen, S. C. Nam, H.-J. Ryu and K. B. Yi, Appl. Surf. Sci., 2013, 280, 360–365 CrossRef CAS.
- H. Tajizadegan, M. Rashidzadeh, M. Jafari and R. Ebrahimi-Kahrizsangi, Chin. Chem. Lett., 2013, 24, 167–169 CrossRef CAS.
- D. Montes, E. Tocuyo, E. Gonzalez, D. Rodriguez, R. Solano, R. Atencio, M. A. Ramos and A. Moronta, Microporous Mesoporous Mater., 2013, 168, 111–120 CrossRef CAS.
- M. Mureddu, I. Ferino, E. Rombi, M. G. Cutrufello, P. Deiana, A. Ardu, A. Musinu, G. Piccaluga and C. Cannas, Fuel, 2012, 102, 691–700 CrossRef CAS.
- X. Wang, T. Sun, J. Yang, L. Zhao and J. Jia, Chem. Eng. J., 2008, 142, 48–55 CrossRef CAS.
- B. Elyassi, Y. A. Wahedi, N. Rajabbeigi, P. Kumar, J. S. Jeong, X. Zhang, P. Kumar, V. V. Balasubramanian, M. S. Katsiotis, K. A. Mkhoyan, N. Boukos, S. A. Hashimi and M. Tsapatsis, Microporous Mesoporous Mater., 2014, 190, 152–155 CrossRef CAS.
- X. Wang, J. Jia, L. Zhao and T. Sun, Appl. Surf. Sci., 2008, 254, 5445–5451 CrossRef CAS.
- L. Li and D. L. King, Catal. Today, 2006, 116, 537–541 CrossRef CAS.
- R. Habibi, A. M. Rashidi, J. T. Daryan and A. Mohamad ali zadeh, Appl. Surf. Sci., 2010, 257, 434–439 CrossRef CAS.
- S. Y. Jung, S. C. Lee and H. K. Jun, Catal. Surv. Asia, 2013, 17, 85–102 CrossRef CAS.
- C. Babe, M. Tayakout-Fayolle, C. Geantet, M. Vrinat, G. Bergeret, T. Huard and D. Bazer-Bachi, Chem. Eng. Sci., 2012, 82, 73–83 CrossRef CAS.
- I. Valsamakis, R. Si and M. Flytzani-Stephanopoulos, J. Power Sources, 2010, 195, 2815–2822 CrossRef CAS.
- C. Rong, R. Jiang and D. Chu, US. Pat., No. 8, 465,712 B2, 2013.
- L. R. Pahalagedara, A. S. Poyraz, W. Song, C. H. Kuo, M. N. Pahalagedara, Y. T. Meng and S. L. Suib, Chem. Mater., 2014, 26, 6613–6621 CrossRef CAS.
- H. L. Fan, T. Sun, Y. P. Zhao, J. Shangguan and J. Y. Lin, Environ. Sci. Technol., 2013, 47, 4859–4865 CrossRef CAS PubMed.
- G. Monteleone, M. D. Francesco, S. Galli, M. Marchetti and V. Naticchioni, Chem. Eng. J., 2011, 173, 407–414 CrossRef CAS.
- M. Hussain, N. Abbas, D. Fino and N. Russo, Chem. Eng. J., 2012, 188, 222–232 CrossRef CAS.
- I. Ramos, R. Perez and M. Fdz-Polanco, Bioresour. Technol., 2013, 142, 633–640 CrossRef CAS PubMed.
- L. Micoli, G. Bagnasco and M. Turco, Int. J. Hydrogen Energy, 2014, 39, 1783–1787 CrossRef CAS.
- T. Wang, J. Costan, A. Centeno, J. S. Pang, D. Darvill, M. P. Ryan and F. Xie, J. Mater. Chem. C, 2015, 3, 2656–2663 RSC.
- N. K. Hassan and M. R. Hashim, J. Alloys Compd., 2013, 577, 491–497 CrossRef CAS.
- Y. C. Chen, H. Y. Cheng, C. F. Yang and Y. T. Hsieh, J. Nanomater., 2014, 1–6 Search PubMed.
- T. Guo, M. S. Yao, Y. H. Lin and C. W. Nan, CrystEngComm, 2015, 17, 3551–3585 RSC.
- A. R. West, Solid State Chemistry and its Applications, John Wiley and Sons, New York, 1984, pp. 173–175 Search PubMed.
- K. S. W. Sing and R. T. Williams, Adsorpt. Sci. Technol., 2004, 22, 773–782 CrossRef CAS.
- H. Huang, P. Xu, D. Zheng, C. Chen and X. Li, J. Mater. Chem. A, 2015, 3, 6330–6339 CAS.
- Y. L. Zhang, Y. Yang, H. Han, M. Yang, L. Wang, Y. N. Zhang, Z. Jiang and C. Li, Appl. Catal., B, 2012, 119–120, 13–19 CrossRef CAS.
| This journal is © The Royal Society of Chemistry 2016 |