DOI:
10.1039/C5RA20344A
(Paper)
RSC Adv., 2016,
6, 3552-3560
Greener technology for organic reactive dye degradation in textile dye-contaminated field soil and in situ formation of “electroactive species” at the anode by electrokinetics†
Received
1st October 2015
, Accepted 13th December 2015
First published on 17th December 2015
Abstract
The present study focuses on the electrokinetic process for the in situ formation of electroactive species at the anode. A bench scale experiment was conducted to investigate the organic molecule degradation by in situ electroactive species and simultaneous removal of trace metals in soil contaminated by a textile effluent. With an impressed direct current (DC), the voltage gradient of 2 V cm−1 facilitated the dye/metal ion movement in the contaminated soil towards the electrodes by electromigration. Two different electrolytes were evaluated for the degradation of pollutants in the soil. Thus, 0.5 M potassium sulfate was assayed as the anolyte and catholyte for system I and in system II, distilled water was used as the electrolyte. The EK process experiments were conducted for 120 h. The UV-Visible spectrum revealed the presence of humic substances in the anolyte chamber during the EK process. The EK treatment was accomplished by the in situ anodic generation of electroactive species. These species were able to degrade the organic components efficiently. The formation of peroxide was noticed in the range of 18 to 32 mg L−1 (system I) during the anodic EK processes. After the EK process, the total organic content was reduced by about 68% and 41% for system I and system II, respectively, which clearly indicates that the significant removal of organic content in system I as compared to that in system II. The trace metals nickel, chromium and copper were significantly removed from the contaminated soil. This technology may be exploited for a faster and eco-friendly degradation and removal of textile dye and inorganic substances in the soil environment.
1. Introduction
Soil contamination is a crucial environmental issue. The discharge of textile industrial effluent, containing mixtures of unfixed dyes, inorganic salts and heavy metal complexes,1 pollutes the soil and the aquatic environment. The high organic content of the dye effluent decreases the dissolved oxygen content of the water bodies. Under this scenario, the polluted/contaminated water bodies are not suitable for organisms typically present in them.2–4 The textile reactive dyes and metals have negative impacts on both the environment and the living beings. However, many organic contaminants and heavy metals in the soil cannot be degraded and so can accumulate and move to the food chain.5,6
A number of physical and chemical treatments, viz., soil washing, soil flushing, chemical extraction etc., have been reported for the removal of trace metals from the contaminated sites.6,7 Soil washing is primarily a physical separation of soil and metal ions from contaminated sites. In this process water acts as a washing solution which reduces the metal concentration in the soil. Chemicals are also used to remove the trace metal from the soil in a chemical extraction process. These technologies are well established in the mineral processing industry but are not suitable for the remediation of organic and inorganic contaminated soil.8 In the bioremediation process, indigenous microorganism degrades the contaminants present in the soil matrix. But this process is a time-consuming one. The literature reports that the electro-dialysis process could efficiently remove heavy metals, viz., Pb, Cu, Zn, Cr, As, etc.,9,10 from contaminated clay soil and suspended soil. Even though those techniques are used in the removal of trace metal or volatile and/or semi-volatile organic compounds alone, an appropriate technology is needed for the in situ removal/degradation of both dye and inorganic trace metals from the polluted soil.
The nature of organic and inorganic pollutants and their possible interaction make it difficult to use developed treatment methods for soil remediation. Some technologies, viz., soil washing, chemical extraction, etc., are not suitable for field conditions and a high cost is involved. Electrokinetic (EK) remediation has been studied to remove heavy metals and organic compounds from soils, sediments and solid wastes. Several researchers11–13 have investigated EK remediation for the removal of metal and organics from contaminated soil. Only a few reports are available regarding the removal of dye from soil by electrokinetics (EK).14–18 In these studies, the investigators tried to remove the dye in a synthetic solid matrix like kaolinite. In another study, Annamalai et al.19 attempted to remove the dyes and metals from the polluted soil by using the EK process with ammonium acetate used as the anolyte.
In the EK process, the electrolyte plays a major role for the removal of pollutants from the contaminated soil matrix. Several researches have reported the removal of pollutants from the contaminated soil using different electrolytes, viz., acetic acid,20,21 tap water,22 ammonium acetate,19,23 hydrochloric acid,24 potassium sulfate,17 etc. Pazos et al.17 established that to improve the EK process it is necessary to add the electrolyte (K2SO4) to increase the electrical conductivity and to favour reactive black 5 desorption from the artificially polluted clay sample.
In this study, a green technology for the degradation and removal of textile reactive dye and trace metals was investigated in a dye polluted soil collected in Tirupur, South India, by using a direct current (DC) EK process. It was expected that the addition of K2SO4 may enhance the conductivity and favour desorption of dye components from the contaminated soil. In addition, the formation of electroactive species (OH˙, ClO−, H2O2) in the anolyte may increase dye degradation. Finally, the identification of electroactive species during the EK process is a new finding while using IrO2–RuO2–TiO2/Ti as the anode and K2SO4 as the anolyte in the EK process.
2. Materials and methods
2.1. Sample
The textile dye contaminated soil sample was collected from the nearby textile industry, Tirupur, South India. The soil was kept in a sterile condition. The soil sample was air dried and sieved to remove the coarser particles. The sieved sample (1 mm; US Standard Screen No. 18) was used for the EK experiments.
2.2. Cell setup
2.2.1. DC electrokinetic cell arrangement. The EK cell was constructed using acrylic sheets of dimensions 24 cm × 4 cm × 6 cm, which was divided into three compartments separated by perforated acrylic sheets. The design of the cell is similar to that of cells used in the previous studies.25–27 Adjacent to the acrylic sheets, filter paper was placed in order to avoid movement of soil particles from the central compartment into the anodic or cathodic compartments. The soil sample was mixed with water to give 20% moisture and then carefully placed in the central compartment. In this study, two systems were evaluated and the experimental details are given in the ESI (Table S1†). A solution of K2SO4 was used as the electrolyte in system I and distilled water was used as the electrolyte in system II. IrO2–RuO2–TiO2/Ti was used as the anode and titanium as the cathode. A DC power supply (Aplab power supply model: regulated DC power supply L 3205) was used to impress a voltage gradient of about 2 V cm−1 in the EK systems.
2.3. Physico-chemical analysis
The soil samples were dried and homogenized for physico-chemical analysis before and after the EK process and all analyses were performed in triplicate. The pH was determined by employing a pH meter (EuTech Instrument pH510 Cyber scan). The soil was mixed with deionized water in the ratio of 1![[thin space (1/6-em)]](https://www.rsc.org/images/entities/char_2009.gif) :5 (soil: H2O) and the mixture stirred using a magnetic stirrer for 30 min. Then, the supernatant solution was used for the chloride concentration which was estimated by volumetric analysis (Mohr's methods).28 The hypochlorite concentration was determined by the iodometric titration method.28 The quantity of hydrogen peroxide was estimated with the help of a UV-Visible spectrophotometer29 in the wavelength range of 420 nm. The samples were taken for analysis at every h during the EK experiments.
:5 (soil: H2O) and the mixture stirred using a magnetic stirrer for 30 min. Then, the supernatant solution was used for the chloride concentration which was estimated by volumetric analysis (Mohr's methods).28 The hypochlorite concentration was determined by the iodometric titration method.28 The quantity of hydrogen peroxide was estimated with the help of a UV-Visible spectrophotometer29 in the wavelength range of 420 nm. The samples were taken for analysis at every h during the EK experiments.
After 120 h of the EK process, the soil was sectioned into 5 equal portions, which were labelled as S1 to S5 from the anode to the cathode (Fig. 1). The total organic content (TOC) (Elementar, Vario TOC Cube) of the soil sample was analysed before and after the EK process. For metal analyses, the sample was digested with a mixture of supra nitric acid, hydrochloric acid (1:3 HNO3:HCl). The digested solution was used for trace metal analysis by atomic absorption spectrophotometer (Varian SpectrAA 220). The concentration of dye in the soil before and after the EK process was determined by UV-Visible spectroscopy (UV-Vis) (CARY Analytical Instrument). The dye components were extracted from the soil samples with deionized water in the ratio of 1:5 (soil:H2O) by stirring on a magnetic stirrer for 30 min and centrifuged at 6000 rpm for 5 min. The supernatant solution was used for the UV-Vis analysis and the removal percentage of the dye was calculated as follows:
| |
 | (1) |
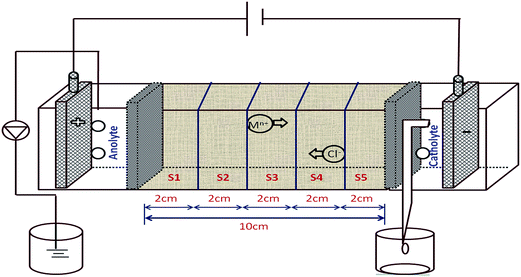 |
| | Fig. 1 Treated soil was sectioned from the anode to the cathode (S1 to S5) after the EK process. | |
In the present study, triplicate experiments were examined and average values with standard deviation (SD) are presented. Statistical student's T-tests (Origin Pro 8.5) were performed for EOF, chloride and TOC analysis.
2.4. Measurement of electroactive species
During the EK process, the hydroxyl radical was measured and confirmed by electron paramagnetic resonance (EPR) spectroscopy. The EPR spectrum of the free radical was recorded using a Bruker EMX Plus spectrometer. The conditions for the measurement were X band: 100 kHz modulation with 6.0 G application; microwave power, 5 mW; central magnetic field, 3480 G; scan width, 200 G. The OH˙ radical was captured by using a radical scavenger (5,5-dimethyl N-pyrroline 1-oxide – DMPO). 20 mM of DMPO was added to trap the hydroxide radical in the electrolyte during electrokinetic experiment.
3. Results and discussion
The physico-chemical properties of the contaminated soil, such as pH, TOC, and initial chloride concentration, were determined and the standard deviation results are presented in Table 1.
Table 1 Physico-chemical characteristics of the contaminated soil
| Parameters, average value (S1 to S5) |
Textile dye contaminated soil (initial) |
Treated soil (EK) |
| System I (K2SO4 electrolyte) |
System II (distilled water electrolyte) |
| pH |
7.3 ± 0.21 |
5 ± 0.20 |
5.32 ± 0.23 |
| Chloride, mg kg−1 |
3187 ± 142 |
286 ± 30 |
542 ± 28 |
| TOC, mg kg−1 |
488 ± 19 |
154 ± 18 |
292 ± 22 |
| UV-Visible spectra, absorbance |
0.3464 |
0.0016 |
0.0363 |
The anodic and cathodic potentials of system I and system II during the EK are presented in ESI Fig. S1.† In system I, the potential was observed in the range of 1.5 V to 1.91 V and −1.25 V to −1.1 V vs. SCE for the anodic and cathodic potentials, respectively. In system II, anodic and cathodic potentials were observed in the range of 1.3 V to 1.58 V and −1.25 V to −1.41 V vs. SCE, respectively. The pH profile during the EK process is shown in ESI Fig. S2.† In the present study, the anolyte pH was maintained at around 2 to 3 and the catholyte pH was controlled at 7.1 ± 0.2 throughout the EK experiment. In system I, the pH of the soil close to the anode chamber was about 2.1 and in the proximity to the cathode chamber it was about 7.3; whereas in system II, the soil close to the anodic and cathodic chambers showed a pH of about 3 and 7.7, respectively. The anodic and cathodic reactions in the electrolytes are the cause for the pH variation.19,25 The electroosmotic flow (EOF) was measured during the experiment and is presented in ESI Fig. S3.† The EOF started after 5 h of EK treatment for system I and after 29 h of the EK process for system II. At the end of the experiments, the cumulative EOF was 355 ml and 121 ml for systems I and II, respectively. It can be assumed that EOF is also involved in the mobility of ions towards the cathode side. The EOF depends on the ionic strength of the electrolyte solutions (K2SO4 and distilled water) and pH variation during the EK process. The higher ionic strength of K2SO4 compared to distilled water leads to electroosmosis mobility in less time in system I. Statistically significant (P < 0.05; t value 4.9644 > 2.011) variation of EOF in these two systems was observed (ESI Table S2a†). It can be assumed that the desorption process by using K2SO4 may also enhance the EOF.
3.1. UV-Visible analysis
During the EK process, electrolyte samples were analysed by UV-Vis spectroscopy and the results are presented in Fig. 2. In system I, no peak was observed in an anolyte sample at the initial time (Fig. 2a). After 36 h of the EK process, a peak was observed at 670 nm which indicates the organic dye molecule accumulated in the anodic chamber (Fig. 2b). This peak gradually decreased during the 88 h of the EK experiment. At the same time a new shoulder band was noticed in the range of 270 nm (Fig. 2c). A peak at 670 nm completely diminished after 96 h of the EK experiment and the shoulder band peak absorbance increased at 270 nm which indicates that a humic substance was formed in the anolyte sample (Fig. 2d) due to oxidation of organic dye molecules on the anodic surface. In system II no peaks were observed in the anolyte samples during the EK process. This is due to the lack of desorption of organics while using distilled water as the anolyte in system II. Subsequently, the in situ generated hypochlorite in the anolyte enters into the soil and removes around 86% of the organics in the soil. UV-Vis spectra of catholyte samples are presented in Fig. 3. A peak was noticed at 262 and 266 nm for system I and system II, respectively. These facts indicate the presence of chromium ion in the catholyte chambers.
 |
| | Fig. 2 The UV-Visible spectrophotometry analysis of anolyte samples taken at different time intervals in system I. (a) Initial time, (b) after 36 h of EK, (c) after 88 h of EK and (d) after 96 h of the EK process. | |
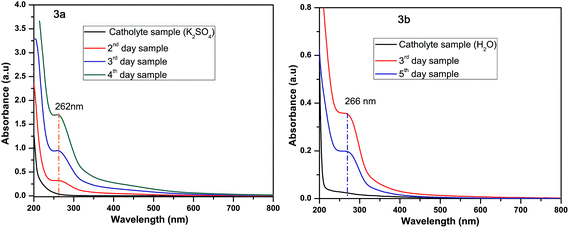 |
| | Fig. 3 Catholyte sample taken at different time intervals: (a) K2SO4 used as the electrolyte, (b) distilled water used as the electrolyte. | |
UV-Visible absorption spectra of the soil samples taken at different positions from the anode towards the cathode (S1 to S5) for both systems are shown in Fig. 4. Absorption peaks at 623 and 670 nm were observed in the contaminated soil. After EK, the intensity of the absorption peaks, in the S5 section, significantly decreased from 0.3464 to 0.0016 and 0.0363 for system I and system II, respectively. This indicates more than 98% (for system I) and 86% (for system II) of the dye compounds were moved towards the anode by an electromigration process. The removal percentage of dye components in the soil sections from S1 to S5 was about 13, 65, 79, 91 and >98% for system I and 12, 48, 67, 81 and 86% for system II (Fig. 4). In both the systems, the absorption value increased towards the anode section of the soil compartment which indicates the mobility of dye from the cathode to the anode chamber. Visual inspection showed that the dye moved towards the anode as shown in ESI Fig. S4.† This observation is supported by the presence of a blue colour near the anode. The dye mobility towards the anode may be due to the presence of the anionic reactive dyes in the contaminated soil. This postulated that the observed blue colour may be due to the presence of reactive blue dyes, or to a copper complex dye in the contaminated soil, which is getting concentrated near the anode section. This supports the observation made by Annamalai et al.,19 who noticed the mobility of the reactive dye and trace metal (copper alone) towards the anode by an electromigration process but they did not consider the electroactive species formation during EK.
 |
| | Fig. 4 UV-Visible absorption spectra of the soil samples taken at different sections before and after the EK experiments: (a) K2SO4 used as the electrolyte, (b) distilled water used as the electrolyte. | |
The amount of chloride content in the soil before and after EK is presented in ESI Fig. S5.† Initially, the chloride concentration was about 3187 mg kg−1. After 120 h of the EK process the average chloride concentration was effectively reduced by about 91% and 83% in system I and II, respectively. Annamalai et al.19 reported that the average removal percentage of chloride was about 84% for 120 h of the EK process using ammonium acetate as the electrolyte. In the present work, K2SO4 was used as the electrolyte and 91% chloride removal at 120 h of the EK process was reached. It should be pointed out that the difference in removal of the chloride was statistically insignificant (P > 0.05; t value 2.2778 < 2.306) between system I and II (ESI Table S2b†). This is because the chloride is easily solubilized in an aqueous environment where electromigration determines the chloride removal process in the both systems.
During the EK process, hypochlorite and peroxide are formed in the anolyte. The hypochlorite and peroxide concentrations are presented in Fig. 5. The concentration of hypochlorite at the anolyte was in the range of 80 to 249 mg L−1 for system I (Fig. 5a). In system II, the hypochlorite concentration was in the range of 25 to 225 mg L−1 (Fig. 5b). The mechanism for the formation of hypochlorite in the anolyte chamber (eqn (3)) is given below
| | |
Cl− + Cl− → Cl2 + 2e−
| (2) |
| | |
Cl2 + H2O → H+ + Cl− + HOCl → H+ + ClO−
| (3) |
 |
| | Fig. 5 The concentration of hypochlorite (a and b) and hydrogen peroxide (a) during the electrokinetic process at regular time intervals. | |
The peroxide was observed in the anolyte during EK in system I, and the concentration in the soil close to the anolyte was about 10 mg L−1 and then slowly increased to the range of 18 to 32.2 mg L−1 (Fig. 5a). The peroxide was noticed after 88 h of the EK process. But, in the case of system II, no peroxide was noticed in the anolyte during the EK process. There are two possible reasons for the formation of peroxide. The first one is that K2SO4 desorbs the organics from the soil and these desorbed organics are pulled by the EK process to the anolyte in which they are oxidized and a humic substance is formed. In the anodic reaction, the humic substance was again oxidized which may supply electrons that enhance the formation of peroxide (eqn (5)). The H2O2 undergoes reduction and forms OH˙ (eqn (7)). The presence of the hydroxyl radical was confirmed with the help of EPR spectra by using a trapping agent (20 mM DMPO) (Fig. 6).
| | |
HS → HS+ + e− (humic substance – HS)
| (4) |
| | |
O2 + 2H+ + 2e− → H2O2
| (5) |
| | |
H2O2 + H+ + e− → H2O + OH˙ (EPR – spectra)
| (7) |
 |
| | Fig. 6 EPR spectrum of the hydroxyl radical formed during the electrokinetic process in anolyte of system I (a) DMPO trapping agent, (b) 36 h, (c) 88 h, (d) 96 h of the EK experiment. | |
The second possible reason is that the presence of K2SO4 produced the peroxydisulfate during the EK process as shown in eqn (9). The peroxydisulfate reacted with water which led to the formation of peroxide as shown in eqn (10) (after 88 h of the EK process). This H2O2 can also undergo reduction producing OH˙.
The presence of anolyte K2SO4 may be involved in the peroxide formation indirectly.
| | |
S2O8−2 + 2H2O → H2O2 + 2HSO4−
| (10) |
| | |
H2O2 + H+ + e− → OH˙ + H2O (EPR spectra)
| (11) |
The present observation is supported by Ando et al.30 who noticed the production of hydrogen peroxide during water electrolysis at the anode. They suggested that 1.776 V vs. NHE is the required voltage for the production of peroxide at the anode (carbon electrode) by a two electron transfer. They claimed that the oxygen over potential need not be considered in this process. The formation of peroxide at the anode was also noticed by other investigators.31,32 In the present study, since the anode voltage was 1.89 ± 0.10 V vs. SCE (TSIA), there is a possibility of peroxide formation in the anode chamber.
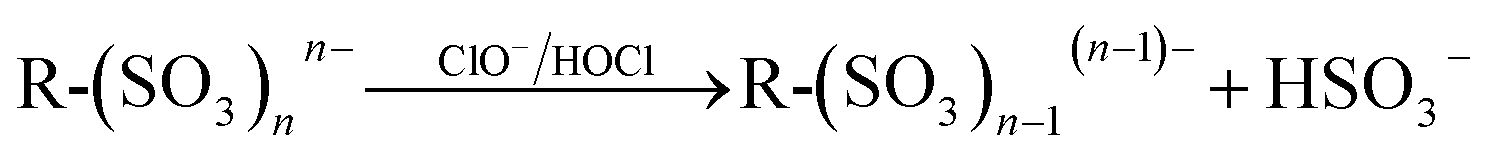
3.2. Degradation mechanism
The textile effluent contaminated soil has mixed reactive dyes like reactive blue 19 (RB 19), copper phthalocyanine (Cu-P), acid red 14 (AR 14), reactive black 5 (RB 5), etc., which are all commonly used in the textile dyeing process. It can be claimed that the mobility of chloride ions from the soil towards the anode may contribute to the production of hypochlorite. Hence, we expected that the formation of in situ electroactive species may degrade the organic molecules present in the soil matrix in the following way,| | |
R-(SO3)nn−nMn+ ↔ R-(SO3)nn− + Mn+
| (12) |
| |
 | (13) |
| |
 | (14) |
| |
 | (15) |
| | |
O2 + 2H+ + 2e− → H2O2
| (16) |
| |
 | (17) |
where R is the mixed reactive dye molecule (RB 19, Cu-P, AR 14, RB 5, etc.), M = Na ion and n = 0, 1, 2, 3, … etc.
In eqn (12), the organic dye molecule ionized to form R-(SO3)nn− and M+ ions which migrated in the respective directions in the electric field by the electromigration process. The R-(SO3)nn− reacts with anodically generated hypochlorite/hypochlorous acid and may result in the hydrogen bisulfite and R as shown in eqn (14). The R reacts with hypochlorite/hypochlorous acid to form the oxidized product of R+ and electron (e−) (eqn (15)). Further, organic molecule, R+, degraded into CO2 and H2O by the in situ formed peroxide and hydroxyl radical in the anolyte compartment (eqn (17)). The mobility of hypochlorous (HOCl) acid/peroxide (H2O2) in the soil by electroosmosis may be involved in the degradation of dye components in the soil compartment.
3.3. TOC analysis
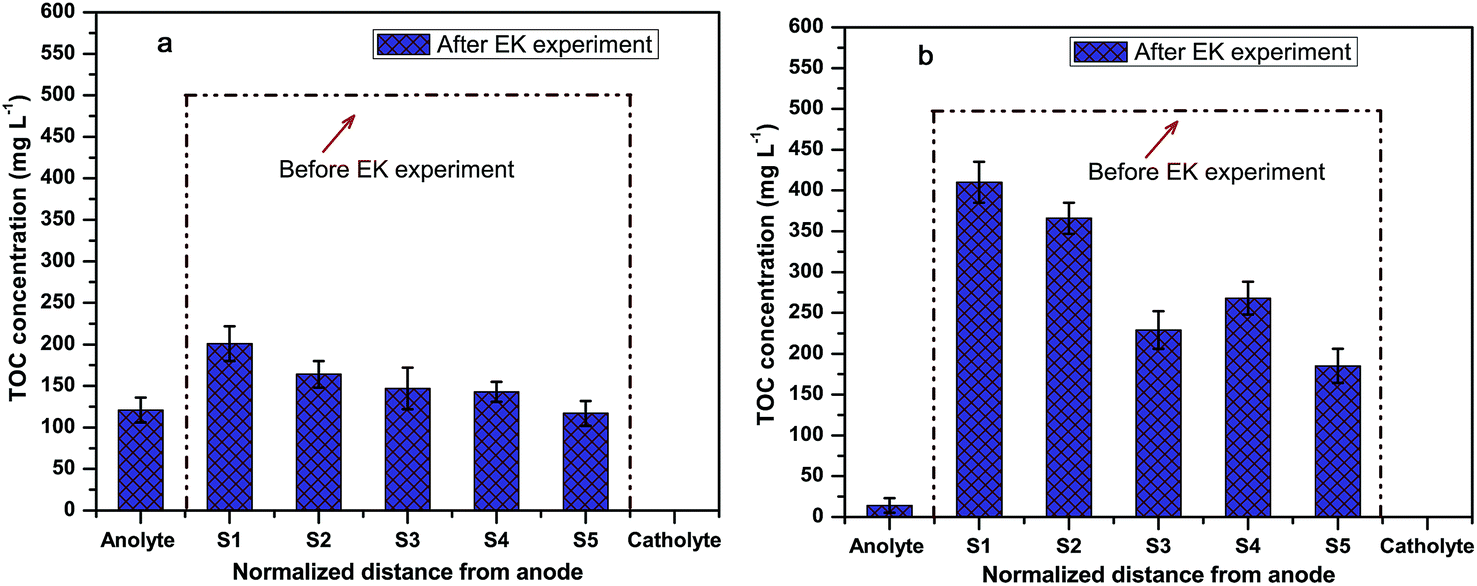
The TOCs of the soil before and after EK are shown in Fig. 7. Initially, the TOC of the soil was around 488 mg kg−1. During the EK treatment, negatively charged textile reactive dyes moved towards the anolyte due to the electromigration process. Thus, employing the EK process, the level of the TOC drastically decreased in all the sections after treatment. Thus, in system I, the average percentage removal of the TOC was around 68% in the soil compartment and 41% of the TOC was removed in system II. In the anolyte compartment, the TOC was about 125 mg L−1 in system I whereas in the case of system II the TOC was about 20 mg L−1 after 120 h of the EK process. A statistically significant (P < 0.05; t value 3.0974 > 2.306) difference in the TOC removal at different sections of the soil was observed in these two systems (ESI Table S2c†). This is due to the highly active desorption process by K2SO4. This observation supports the UV-Vis spectroscopy results, where the humic substance was noticed in the anolyte compartment. This reveals that the movement of organics towards the anolyte in system I is significantly higher than mobility of the organics towards the anolyte in system II. This indicates that the K2SO4 desorbed the organics with soil particles and encouraged the mobility of organics.33 The removed organics in the anolyte were degraded by the OH˙ formed by the anode. The TOC results directly represent the in situ formation of electroactive species that degrade the organic molecule.
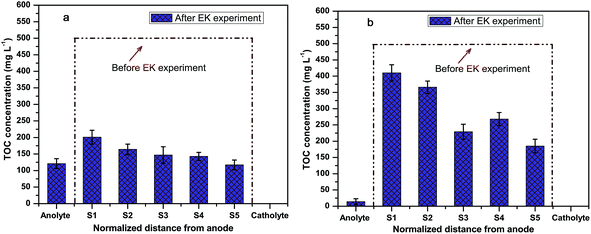 |
| | Fig. 7 TOC analysis of soil samples at different sections before and after EK: (a) system I, (b) system II. | |
3.3.1. Factors affecting the degradation process. Control of the pH value is an important phenomenon in the electrokinetic remediation process.17 In this study, the formation of a rich quantity of H+ ion was produced at a pH in the range of 2 to 3. We expected that the H+ ions react with the chloride ion from the soil matrix by electromigration process which may encourage the formation of electroactive species like hypochlorous acid/hypochlorite ions. The organic dye molecules are efficiently decolorized during the EK process. Besides, the formation of electroactive species depends upon the acidic pH of the anolyte during EK. The formation of H+ and O2 in the anolyte determined the formation of H2O2 with the organic species removed in the anolyte.The initial concentration of hypochlorite was about 80 mg L−1 measured at 5 h of the EK process in system I. The formation of the hypochlorite gradually increased due to the mobility of the chloride ion migration towards the anolyte chamber from the real contaminated soil matrix. The maximum concentration (249 mg L−1) was reached at 60 h of the EK process and gradually reduced to 35 mg L−1 at 95 h of the EK process. It is assumed that the hypochlorite may move towards the soil matrix by an electroosmosis process.
In the K2SO4 electrolyte system, peroxide was observed in the anolyte during EK. The initial concentration of peroxide was about 10 mg L−1 observed at 88 h of the EK process. Initially, the organics were oxidized by the in situ generation of hypochlorite/hypochlorous acid and the oxidized organics supplied electrons to the oxygen and hydrogen ions in the anolyte for the formation peroxide. But in the case of system II, no peroxide was noticed in the anolyte during the EK process.
In system II, the initial hypochlorite concentration was about 25 mg L−1 measured at 5 h of the EK process. During the EK process, the concentration of hypochlorite gradually increased in the range of 25 to 225 mg L−1 up to 120 h where a decreasing trend of hypochlorite could not be noticed. This is due to the lower amount of EOF which doesn't influence the removal of hypochlorite with time.
3.4. Trace metal analysis
The Cu concentration in the bulk from the normalized distance from the node in the EK cell is presented in ESI Table. S3.† In the control system, the concentration of Cu was about 5.5 mg kg−1. After 5 days of EK experiments, the copper was in the range between 3.0 and 8.5 mg kg−1 in the soil. In the present study, Cu was concentrated in section S1 and 42, 45, 32 and 34.5% (system I) of Cu was removed from sections S2 to S5. In system II, the removal percentage of Cu was 10.2, 27, 38.5, 28 and 27.8% from sections S1 to S5. In section S5 the least amount of Cu was removed from both the systems which may be due to the higher pH of the catholyte and the formation of hydroxide. The presence of the negative charge dye components of the azo group and the sulphonate group lead to the Cu movement towards the anode due to electromigration. It is postulated that the blue colour at the anodic area during the EK experiment is due to the presence of Cu-complexes like Cu-phthalocyanine. The mobility of Ni and Cr was insignificant in the contaminated soil, as the Ni may interact with the Cr ions and format nickel chromate19 which reduces the mobility of metal ions.
4. Conclusion
Most of the studies on EK techniques are focused on the removal of inorganic and organic compounds (PAH, PCB) from a model soil like kaolinite and spiked soil. However, these studies need to be extended to the various real polluted soils to have a better understanding of the potential of the EK technique. In the present study, the remediation of a soil contaminated with real textile dye effluent was carried out by EK techniques. K2SO4 as well as water were explored as the electrolytes. The presence of K2SO4 assisted the formation of electroactive species (OH˙, H2O2, ClO−) which significantly degraded the organic molecules. This fact was confirmed by TOC measurements. These analyses, in the different soil sections, indicated that the degradation of organic content was around 68% which is significantly higher than 41% organic content removal when water was used as electrolyte. The mobility of dye towards the anodic side under the applied potential on the EK cell was noticed by the visual colour appearance. The movement of Cu towards the anode is explained by the formation of Cu-complexes with the dyes. The movement of trace metals towards the cathode is supported by the data obtained by AAS. It can be concluded that during EK, the formation of OH˙ efficiently degrades the organic molecules and simultaneously removes the trace metals from the soil contaminated with textile dye.
Acknowledgements
CSIR-HRDG, New Delhi, is gratefully acknowledged for the Senior Research Fellowship to Sivasankar Annamalai. The authors thank CSIR for sponsoring this project under Sustainable Environmental Technology for Chemical and Allied Industries (SETCA) – Project No CSC 0113.
References
- A. S. A. Prasad and K. V. B. Rao, Global J. Biotechnol. Biochem., 2010, 5, 80–86 Search PubMed.
- N. Puvaneswari, J. Muthukrishnan and P. Gunasekaran, Indian J. Exp. Biol., 2006, 44, 618–626 CAS.
- S. Sharma, V. Suryavathi, P. K. Singh and K. P. Sharma, et al., Australas. J. Ecotoxicol., 2007, 13, 35 Search PubMed.
- A. Fernandes, M. J. Pacheco, L. Ciríaco and A. Lopes, Appl. Catal., B, 2015, 176, 183–200 CrossRef.
- D. G. Crosby, Environmental Toxicology and Chemistry, Oxford University Press, New York, 1998 Search PubMed.
- L. Y. Li, Environ. Technol., 2006, 27, 811–822 CrossRef CAS PubMed.
- D. Leštan, C. Luo and X. Li, Environ. Pollut., 2008, 153, 3–13 CrossRef PubMed.
- J. Xu, A. G. Bravo, A. Lagerkvist, S. Bertilsson, R. Sjöblom and J. Kumpiene, Environ. Int., 2015, 74, 42–53 CrossRef CAS PubMed.
- P. E. Jensen, G. M. Kirkelund, K. B. Pedersen, C. Dias-Ferreira and L. M. Ottosen, Electrochim. Acta, 2015, 181, 167–178 CrossRef CAS.
- K. B. Pedersen, G. M. Kirkelund, L. M. Ottosen, P. E. Jensen and T. Lejon, J. Hazard. Mater., 2015, 283, 712–720 CrossRef CAS PubMed.
- K. Maturi and K. R. Reddy, Chemosphere, 2006, 63, 1022–1031 CrossRef CAS PubMed.
- K. R. Reddy and M. R. Karri, Land Contam. Reclamat., 2006, 14, 685–698 CrossRef.
- G. Maini, A. K. Sharman, C. J. Knowles, G. Sunderland and S. A. Jackman, J. Chem. Technol. Biotechnol., 2000, 75, 657–664 CrossRef CAS.
- M. T. Ricart, M. Pazos, S. Gouveia, C. Cameselle and M. A. Sanroman, J. Environ. Sci. Health, Part A: Environ. Sci. Eng., 2008, 43, 871–875 CrossRef CAS PubMed.
- Y.-J. Lee, H. Han, S.-H. Kim and J.-W. Yang, Sep. Sci. Technol., 2009, 44, 2455–2469 CrossRef CAS.
- J.-Y. Wang, X.-J. Huang, J. C. M. Kao and O. Stabnikova, J. Hazard. Mater., 2007, 144, 292–299 CrossRef CAS PubMed.
- M. Pazos, M. T. Ricart, M. A. Sanromán and C. Cameselle, Electrochim. Acta, 2007, 52, 3393–3398 CrossRef CAS.
- M. Pazos, C. Cameselle and M. A. Sanromán, Environ. Eng. Sci., 2008, 25, 419–428 CrossRef CAS.
- S. Annamalai, M. Santhanam, M. Sundaram and M. P. Curras, Chemosphere, 2014, 117, 673–678 CrossRef CAS PubMed.
- Y. B. Acar and A. N. Alshawabkeh, Environ. Sci. Technol., 1993, 27, 2638–2647 CrossRef CAS.
- Ö. Hanay, H. Hasar, N. N. Koçer and O. Ozdemir, Environ. Technol., 2009, 30, 1177–1185 CrossRef PubMed.
- K. R. Reddy and S. Chinthamreddy, Adv. Environ. Res., 2003, 7, 353–365 CrossRef CAS.
- J.-L. Chen, S.-F. Yang, C.-C. Wu and S. Ton, Sep. Purif. Technol., 2011, 79, 157–163 CrossRef CAS.
- S. Annamalai, S. Selvaraj, H. Selvaraj, M. Santhanam and M. Pazos, RSC Adv., 2015, 5, 81052–81058 RSC.
- J.-H. Choi, S. Maruthamuthu, H.-G. Lee, T.-H. Ha and J.-H. Bae, J. Hazard. Mater., 2009, 168, 1208–1216 CrossRef CAS PubMed.
- S. Maruthamuthu, T. Dhanibabu, A. Veluchamy, S. Palanichamy, P. Subramanian and N. Palaniswamy, J. Hazard. Mater., 2011, 193, 188–193 CrossRef CAS PubMed.
- C. Soundarrajan, A. Sivasankar, S. Maruthamuthu and A. Veluchamy, J. Hazard. Mater., 2012, 217–218, 452–456 CrossRef CAS PubMed.
- G. H. Jeffery, J. Bassett, J. Mendham and C. R. Denney, Quantitative Chemical, John Wiley & Sons, 1989 Search PubMed.
- C. N. Satterfield and A. H. Bonnell, Anal. Chem., 1955, 27, 1174–1175 CrossRef CAS.
- Y. Ando and T. Tanaka, Int. J. Hydrogen Energy, 2004, 29, 1349–1354 CrossRef CAS.
- J.-H. Choi, S. Maruthamuthu, H.-G. Lee, T.-H. Ha and J.-H. Bae, Met. Mater. Int., 2009, 15, 771–781 CrossRef CAS.
- E. Chatzisymeon, N. P. Xekoukoulotakis, A. Coz, N. Kalogerakis and D. Mantzavinos, J. Hazard. Mater., 2006, 137, 998–1007 CrossRef CAS PubMed.
- M. Pazos, M. T. Ricart, M. A. Sanromán and C. Cameselle, Electrochim. Acta, 2007, 52, 3393–3398 CrossRef CAS.
Footnote |
| † Electronic supplementary information (ESI) available. See DOI: 10.1039/c5ra20344a |
|
| This journal is © The Royal Society of Chemistry 2016 |
Click here to see how this site uses Cookies. View our privacy policy here.