Targeting human telomeric G-quadruplex DNA with curcumin and its synthesized analogues under molecular crowding conditions

Niki S. Jha*a, Satyendra Mishra b, Ashalatha S. Mamidic, Archita Mishrac, Shailendra K. Jhad and Avadhesha Surolia*c
aDepartment of Chemistry, National Institute of Technology, Patna-800005, India. E-mail: nikij@nitp.ac.in; Tel: +91-612-2260004
bIndian Institute of Advanced Research, Gujarat-382007, India
cMolecular Biophysics Unit, Indian Institute of Science, Bangalore 560012, India. E-mail: surolia@mbu.iisc.ernet.in; Fax: +91-80-2360-0535; Tel: +91-80-2293-2714
dCSIR-Central Electrochemical Research Institute, Karaikudi, Tamil Nadu, India

Received 27th August 2015 , Accepted 14th December 2015

First published on 17th December 2015


Abstract

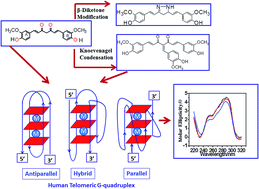
The formation of telomeric G-quadruplexes has been shown to inhibit telomerase activity. Indeed, a number of small molecules capable of π-stacking with G-tetrads have shown the ability to inhibit telomerase activity through the stabilization of G-quadruplexes. Curcumin displays a wide spectrum of medicinal properties ranging from anti-bacterial, anti-viral, anti-protozoal, anti-fungal and anti-inflammatory to anti-cancer activity. We have investigated the interactions of curcumin and its structural analogues with the human telomeric sequence AG3(T2AG3)3 under molecular crowding conditions. Experimental studies indicated the existence of a AG3(T2AG3)3/curcumin complex with binding affinity of 0.72 × 10⁶ M−1 under molecular crowding conditions. The results from UV-visible absorption spectroscopy, a fluorescent TO displacement assay, circular dichroism and molecular docking studies, imply that curcumin and their analogues interact with G-quadruplex DNA via groove binding. While other analogs of curcumin studied here bind to G-quadruplexes in a qualitatively similar manner their affinities are relatively lower in comparison to curcumin. The Knoevenagel condensate, a methoxy-benzylidene derivative of curcumin, also exhibited significant binding to G-quadruplex DNA, although with two times decreased affinity. Our study establishes the potential of curcumin as a promising natural product for G-quadruplex specific ligands.

Introduction

Telomeres, found in all eukaryotic chromosomes are uniquely characterized by a repetitive sequence of guanine bases.1 In human cells, telomeric DNA is typically composed of 5–15 kb predominantly consisting of double-stranded rich sequences with a single-stranded 3′-end overhang comprising of TTAGGG, which is necessary for its function. A guanine rich sequence self-assembles into four stranded helical arrangements called G-quadruplexes through multiple Hoongsteen base pairs and stabilized by cations (Na+ and K+) in the center of the quartet2–4 [Fig. 1]. Putative G-quadruplex forming sequences are found in the telomeric region of eukaryotic chromosomes,5 an oncogene promoter sequence such as c-kit and c-myc,6–9 and in the untranslated region of mRNA.10 Quadruplex formed by the human telomeric DNA have significant role in biological processes, such as ageing and cancer, serving as a potential therapeutic target for cancer.11 In humans and other vertebrates, telomeres consist of tandem T2AG3 repeats that adopt G-quadruplex conformation in vitro under physiological conditions.12,13 They are involved in the regulation of the activity of telomerase, which is activated in 80–90% of human tumors and can serve as specific tumor-selective target for chemotherapy.9
image file: c5ra17390f-f1.tif
Fig. 1 Structure of G-tetrad for telomeric DNA sequence and various structural motifs.

G-Quadruplex is structurally diverse in nature due to their strand direction, sequence, loop orientation, and the nature of metal cation stabilizing the quadruplex. The formation of telomeric G-quadruplex has been shown to inhibit telomerase activity.14 Indeed, a number of small molecules were reported which stabilize telomeric G-quadruplex structures found in human and therefore inhibit telomerase activity through primer sequestration mechanism.15 A number of compounds with extended aromatic ring system capable of π-stacking with G-tetrads have shown the ability to inhibit telomerase activity. Example, telomostatin based macrocycle16,17 porphyrins,18 Braco-19,19 quinacridine20 etc. Most ligands bind to G-quadruplex though end stacking. When ligands bind to one face of a single guanine quartet in the G-quadruplex it gives rise to intercalation. On the other hand, when a ligand binds between two guanine quartets in the G-quadruplex, it is called groove binding.

Curcumin, isolated from roots and rhizomes of Curcuma longa shows various medicinal properties such as antioxidant, anti-bacterial, anti-viral, anti-protozoal, anti-fungal, anti-inflammatory and anti-cancer activity.21–24 Curcumin induces apoptosis in tumor cells suppressing their proliferation. It is an inhibitor of NF-κβ transcription factor and downstream gene products including c-myc, BCl-2, COX-2, NOS, cyclin D1, TNF-α, interleukin and MMP-9.23–26 It also leads to DNA mutation through the process of tumorgenesis, growth and metastasis.27,28 Curcumin is highly lipophilic and almost insoluble in water at acidic or neutral pH. The hydrolytic stability and solubility of curcumin can be improved by incorporating it in polyethylene glycol as reported earlier.29 Polyethylene glycol also leads to molecular crowding which in turn will increase the stability of G-quadruplex.

Here we report on the binding of curcumin and its structural analogues with human telomeric sequence AG3(T2AG3)3 under molecular crowding condition. Spectroscopic method such as circular dichorism (CD), UV, fluorescence along with molecular docking simulations have been utilized for studying binding process of G-quadruplex with curcumin and its various structural analogues. The results suggest that in addition to the structural features of the central core of the ligand, the side chains also play a critical role in achieving selective G-quadruplex DNA stabilization.

Experimental section

Materials and reagents

Curcumin (from Curcuma longa), tris(hydroxymethyl)aminomethane, sodium cocodylate and polyethylene glycol (400) were obtained from Sigma-Aldrich.

Oligonucleotides

DNA oligonucleotide AGGGTTAGGGTTAGGGTTAGGG were obtained from Sigma Aldrich. As double stranded DNA we have used calf thymus DNA (ctDNA, Sigma). All oligonucleotides were desalted and HPLC purified. The concentration was determined at 260 nm in UV-vis spectrophotometer using appropriate molar extinction coefficient. A molar extinction coefficient of 228[thin space (1/6-em)]500 M−1 cm−1 at 260 nm was determined for the folded quadruplex form based on nearest neighbor approximation.30 All measurements were performed in a buffer consisting of 10 mM Tris–HCl, pH 7.4 and 100 mM KCl. DNA were annealed by heating the oligonucleotide telomeric sequence forming G-quadruplex with Tris (10 mM, pH 7.4) and KCl (100 mM) at 95 °C for 5 min. Subsequently, it was cooled gradually at room temperature for 1 h and then kept overnight at 4 °C.

Synthesis of curcumin analogues

General procedure for the preparation of curcumin pyrazole and N-(substituted) phenyl curcumin pyrazole analogues. The pyrazole and substituted phenyl pyrazole derivatives of curcumin were synthesized, as illustrated in Schemes 1 and 2 as reported previously by us and others.23,24 Curcumin (1 mmol) was dissolved in glacial acetic acid (5 mL), to which hydrazine hydrate/various phenyl substituted hydrazine hydrochlorides (1.2 mmol) were added. The solution was refluxed for 8–24 h, and then the solvent was removed in vacuum. Residue was dissolved in ethyl acetate and washed with water. Organic portion was collected, dried over sodium sulfate, and concentrated in vacuum. Crude product was purified by column chromatography. All the curcumin pyrazoles analogues were prepared by using this procedure.
image file: c5ra17390f-s1.tif
Scheme 1 Synthesis of pyrazole derivative of curcumin.

image file: c5ra17390f-s2.tif
Scheme 2 Synthesis of N-(substituted) phenylcurcumin pyrazole analogs.
Curcumin pyrazole (2). The crude product purified by column chromatography (dichloromethane/methanol, 97[thin space (1/6-em)]:[thin space (1/6-em)]3) on silica gel to get the desired curcumin pyrazole product gave 71% yield with Rf = 0.50 (DCM/MeOH 9[thin space (1/6-em)]:[thin space (1/6-em)]1), and mp 214 °C (lit. 211–214). 1H NMR (400 MHz, DMSO-d6): δ 3.83 (s, 6H, 2 × OCH3), 6.65 (s, 1H, C4H), 6.91 (d, 2H, J = 15.8 Hz, C2H and, C6H), 7.04 (d, 2H, J = 15.8 Hz, C1H & C7H), 7.16–7.39 (m, 6H, ArH), 9.20 (s, 2H, –OH). ESI HRMS m/z calculated for (C21H20N2O4 + H+) 365.1495, found [M + H]+ 365.1489 [Fig. S13–S14].
N-(3-Flurophenylpyrazole)curcumin (3). The crude product was purified by column chromatography (EtOAc/hexanes, 40[thin space (1/6-em)]:[thin space (1/6-em)]60) on silica gel, which yielded 46% of the desired compound with Rf = 0.60 (EtOAc/hexane 40[thin space (1/6-em)]:[thin space (1/6-em)]60), & mp 122–123 °C, 1H NMR (300 MHz, DMSO-d6): δ 3.78 (s, 3H, –OCH3) 3.83 (s, 3H, –OCH3), 6.76–6.84 (m, 3H, C4H, C2H and, C6H), 6.98–7.43 (m, 10H, C1H, C7H, ArH), 7.56–7.74 (m, 2H, ArH). ESI HRMS m/z calculated for (C27H23FN2O4 + H+) 459.1714, found [M + H]+ 459.1714 [Fig. S15–S16].
N-(3-Nitrophenylpyrazole)curcumin (4). The crude mixture on column chromatography hexane/ethyl acetate, (60[thin space (1/6-em)]:[thin space (1/6-em)]40) on silica gel provided 45% of (4). It gave Rf = 0.65 (DCM/MeOH 9[thin space (1/6-em)]:[thin space (1/6-em)]1), mp 93 °C, 1H NMR (300 MHz, DMSO-d6): δ 3.78 (s, 3H, –OCH3), 3.84 (s, 3H, –OCH3), 6.70–6.86 (m, 3H, C4H, C2H and, C6H), 7.10 (d, 2H, J = 14.8 Hz, C1H and C7H), 6.56–7.91 (m, 7H, ArH), 7.81 (t, 1H, J = 8.13 Hz, ArH), 8.10 (dd, 1H, J1 = 8.13 Hz, J2 = 7.6 Hz, ArH), 8.30 (s, 1H, J = 8.2 Hz, ArH), 9.71 (s, 1H, –OH), 9.80 (s, 1H, –OH). ESI HRMS m/z calculated for (C27H23N3O6 + H+) 486.1459, found [M + H]+ 486.1452 [Fig. S17–S18].
General synthetic procedure for the synthesis of Knoevenagel condensates of curcumin (5). 4-Hydroxy-3-methoxybenzaldehyde (5 mmol) was mixed with curcumin (4 mmol) and 10 mL of dry DMF. Subsequently piperidine (0.2 eq.) was added drop wise to the resulting solution and stirred at room temperature for 48 h under nitrogen atmosphere. The product was diluted with ethyl acetate and washed with water and saturated brine. The organic phase was dried over Na2SO4, concentrated under vacuum, and purified by chromatography on silica gel with EtOAc/hexanes (50[thin space (1/6-em)]:[thin space (1/6-em)]50) mixtures to provide pure compound (5) in 43% yield with Rf = 0.40 (EtOAc/hexane: 1[thin space (1/6-em)]:[thin space (1/6-em)]1), mp 96–98 °C. 1H NMR (300 MHz, CDCl3): δ 3.85 (s, 3H, –OCH3), 3.87 (s, 3H, –OCH3), 3.90 (s, 3H, –OCH3), 6.77–7.13 (m, 9H, ArH), 7.21 (d, 2H, J = 15.0 Hz, C2H, C6H), 7.83 (d, 2H, J = 15.0 Hz, C1H, C7H), 8.01 (s, 1H, [double bond, length as m-dash]CHAr). ESI HRMS m/z calculated for (C29H26O8 + H+) 503.1700, found [M + H]+ 503.1703 [Fig. S19–S20].
CD titration and melting. CD spectra were measured in JASCO 715 spectropolarimeter with wavelength range of 220–320 nm using a quartz cuvette with 2.0 mm path length. The scanning speed of the instrument was set to 50 nm min−1, and response time used was 4 s. The data pitch was 0.2 nm and band width 2.0 nm with four continuous scan. The strand concentration of oligonucleotide used was 5 μM, and ligand stock solution used was 2 mM in ethanol. The quadruplex DNA solution were annealed by heating the quadruplex forming DNA and KCl (100 mM) in Tris (10 mM, pH 7.4) buffer at 95 °C for 5 min and cooling in ice for 10 min. Each spectrum was an average of 3 measurements at 25 °C. In addition, the spectrum of the corresponding buffer was collected and subtracted from the sample. All spectra were baseline corrected and analyzed using Origin 8.0 software.

For melting studies, 5 μM of telomeric DNA in 10 mM Tris (pH 7.4) and 100 mM KCl were annealed by heating at 95 °C for 5 min followed by gradual cooling to room temperature. Thermal melting was monitored at 295 nm for telomeric DNA, at the heating rate of 1 °C min−1. The data were fit to a reversible two-state model.

 
N ⇔ U (1)
where N is the native DNA and U is the unfolded DNA. The data can be described by the equation:31
 
image file: c5ra17390f-t1.tif(2)
where Y0 is the mean residue ellipticity measured at temperature T, yF and yU represents the intercepts and mF and mU are the slopes of the folded and unfolded baselines of the transition, respectively, Tm is the midpoint of the thermal transition, ΔH0(Tm) is the change in enthalpy at Tm, and ΔCP represents the change in heat capacity.

The observed data were fit to the above equation with nonlinear least squares program using Sigma plot for windows scientific software.

UV-visible titration. The UV-titration was carried out with JASCO V-530 UV/VIS double beam spectrophotometer equipped with a thermostated cell compartment, using quartz cuvettes with 1 cm path lengths. All titration experiments were performed in buffer solution containing 10 mM Tris–HCl containing 100 mM KCl and 10% PEG 400 at pH 7.4. UV-visible absorption titration was carried out by the stepwise addition of G-quadruplex solution to a cell containing 20 μM curcumin or its analogues. After incubation at 25 °C, absorption spectra were scanned from 300 to 600 nm at room temperature. The titration was terminated when the wavelength and the intensity of the absorption band for curcumin did not change any more upon three successive additions of G-quadruplexes.

The spectroscopic titrations were analyzed according to Scatchard model.32 At each intermediate titration point, the fraction of bound drug was calculated by the use of the expression

 
α = (AfA)/(AfAS) (3)
where Af and AS, respectively are absorbance for free and for fully-bound curcumin. The concentration of the free curcumin was calculated using Cf = (1 − α)C where C is the total concentration of curcumin, Cf was then used to determine the binding ratio r, defined as r = (CCf). Titration data were cast into the r/Cr to r Scatchard plot which were fit to the Scatchard's linear relation
 
r/Cf = Ki(nr) (4)
where Ki and n, respectively, represent the intrinsic binding constant and the saturated binding of curcumin molecules to G-quadruplex.

Steady-state fluorescence measurements. The binding of curcumin and its analogues to the G-quadruplex DNA was monitored by enhancement of curcumin fluorescence in the presence of tetrad. Fluorescence spectra were recorded using a JASCO FP-6300 spectrofluorometer. All fluorescence measurements were carried out in 0.5 cm path-length quartz cuvette. The curcumin were excited at their characteristic wavelength maximum, 427 nm. In all the experiments set up excitation and emission band-pass were 5 nm. Increasing amount of a stock solution of oligonucleotide was added to a 20 μM of compounds 2–5 and fluorescence emission was recorded 10 min after each addition.
Fluorescence intercalator displacement assay. The quadruplex forming DNA in 10 mM sodium cocodylate buffer pH 7.4 and 100 mM KCl were annealed by heating at 95 °C for 5 min and cooling in ice for 10 min. 0.5 μM strand concentration for tetramolecular G-quadruplex was mixed with 1 μM of thiazole orange (TO). After the addition of TO, 2–3 h equilibration time was provided. Each experiments were tested in triplicate, in a volume of 200 μL of the sample. The fluorescence of sample was measured at 25 °C in a JASCO fluorescence spectrophotometer. The excitation and emission wavelength were 501 nm and the 510–700 nm, respectively, and the slit width was 5 nm. Ligand stock solution were made (200 μM) in DMSO. Each addition of ligand (0, 1, 2, 5, 7, 9, 10, 11, 13, 15, 17, 19 and 20 μM) was followed by a 3 min equilibration period. Each curve was integrated using Origin 8.0 software to get the fluorescence area. The percentage of displacement is calculated from the fluorescence area (FA, 510–750 nm, λex = 501 nm) using: percentage of displacement = 100 − [(FA/FA0) × 100], FA0 being the fluorescence of TO bound to DNA without added ligand. FID curves were obtained by plotting the percentage of displacement versus the concentration of added ligand.

Molecular modeling studies

Binding site prediction. To identify the binding pockets in G-quadruplex DNA, a web server MetaPocket 2.0 (http://projects.biotec.tu-dresden.de/metapocket) was used.33 For this, the three dimensional NMR structure of human telomere DNA quadruplex hybrid form (PDB Id: 2HY9) was obtained from RCSB PDB (http://www.rcsb.org).34 Metapocket 2.0 uses a consensus method, in which four methods viz. LIGSITEcs, PASS, Q-SiteFinder, and SURFNET are combined together to predict the binding sites with high accuracy. The results of the top three sites predicted from each method are presented.
Molecular docking simulations. Molecular docking simulations were performed using Dock v6.6 program (http://dock.compbio.ucsf.edu/DOCK_6/index.htm).35 The 3D coordinates of G-quadruplex hybrid form (PDB Id: 2HY9) and dodecamer duplex B-DNA (PDB ID: 1BNA)36 were obtained from RCSB PDB. Curcumin and its four derivatives viz. pyrazole curcumin, N-(3-fluorophenyl) pyrazole curcumin, N-(3-nitrophenyl)pyrazole curcumin and 4-(4-hydroxy-3-methoxy)benzylidene curcumin used in the study were generated using PRODRG2 web server.37 The hybrid form of G-quadruplex comprising the human telemetric repeat sequence d[AG3(T2AG3)3] is a 26 mer with extra two ‘AA’ flanking at both 5′ and 3′ ends. Hence, the PDB structure was modified by deleting the caps and considered only the canonical 22 mer as the conformational template. For docking simulations, the receptor and ligand structures were prepared by removing counter ions, adding hydrogens, AMBER parm99 partial charges and energy minimized using Chimera visualization program.38 All the input files required to define the negative image of the binding site were prepared to superpose the ligands using the programs present in the DOCK distribution (DMS, SPHGEN, SHOWBOX, and GRID). Flexible docking was performed using an incremental construction method called anchor-and-grow to account for ligand flexibility. Grid-based scoring was implemented as primary and secondary scoring, which is based on the intermolecular non-bonded terms viz., van der Waals (VDW) for steric and electrostatic for charge based interactions of the AMBER force field ff99. Ligand minimization was enabled and all other docking parameters were set to default values for docking runs. A total of 100 docking conformers for each ligand molecules were computed and were visualized. The best output conformation of ligands docked into the receptor possessing the lowest binding energy was chosen for computing the binding energies. The electrostatic free energy of binding were calculated for the G-quadruplex and B-DNA complexes using the programs APBS39 and visualised with Chimera. The dielectric constants was set to εP = 2.0 for the solute and εS = 78.0 for the solvent at an ion concentration of 0.15 M.

Results and discussion

Curcumin and its structural analogues have not been explored in the past as G-quadruplex ligands. To probe the effects of substituents and the chemical nature of the interaction of curcumin to G-quadruplex, a number of analogues of curcumin were synthesized [Fig. 2]. Pyrazole derivative of curcumin was synthesized by refluxing curcumin and hydrazine hydrate in glacial acetic acid for 6 h (Scheme 1). Substituted curcumin pyrazoles were synthesized by the treatment of substituted phenyl hydrazine hydrochloride with curcumin in glacial acetic acid under reflux conditions for 8–24 h (Scheme 2). Knoevenagel condensate of curcumin was prepared by treatment of curcumin with aromatic aldehyde (4-hydroxy-3-methoxybenzaldehyde; vanillin) in presence of piperidine (as catalyst) and anhydrous DMF (as solvent) to yield 4-(4-hydroxy-3-methoxybenzylidene)curcumin (Scheme 3).
image file: c5ra17390f-f2.tif
Fig. 2 The structures of curcumin and its structural synthesized analogues.

image file: c5ra17390f-s3.tif
Scheme 3 Synthesis of Knoevenagel condensate of curcumin 4-(4-hydroxy-3-methoxybenzylidene)curcumin (5).

UV absorption studies

UV-visible absorption spectrum of 20 μM curcumin in Tris buffer with concentration of PEG 400 in the range of 0–10% was recorded every 5 minute in order to investigate the solubility and stability of curcumin in these solution. The UV-visible absorption of curcumin shows an intense peak with absorption maximum around 430 nm. There was a steady increase in absorbance of curcumin at 430 nm with increase in concentration of PEG 400 [Fig. 3]. Thus the solubility and stability of curcumin is improved in PEG 400 as was highlighted by Tonnesen et al.29 This is substantially due to presence of both H-bond accepting and H-bond donating groups in PEG 400.
image file: c5ra17390f-f3.tif
Fig. 3 Absorption spectra of curcumin in Tris–HCl buffer with increasing concentration of PEG 400.

Circular dichorism studies

Next we examined the structure of human telomere quadruplex in a more physiological environment. For this CD spectroscopic analysis was conducted in K+ and Na+ solution in presence of crowding agent PEG 400 [Fig. 4]. CD spectrum with a maximum at 290 nm represents antiparallel conformation while shoulder at 265 nm and a minimum at 235 nm corresponds to the parallel portion of the quadruplex structure. In presence of K+ and in the absence of PEG 400, spectrum of AG3(T2AG3)3 shows a negative peak at 235 nm with a maximum at 290 nm with a positive shoulder at 270 nm [Fig. 4]. In presence of 10% PEG 400, a decrease in peak near 235 nm and an increase in positive peak at 290 nm was observed. The CD spectra of human telomeric DNA with Na+ but without PEG 400 shows a negative peak around 262 nm and a positive peak around 292 nm. In the presence of 10% PEG in Na+ the above oligonucleotide still maintains the conformation while in K+ it shows greater alterations and contains mixture of antiparallel and parallel conformation. This is consistent with an earlier study that at 40% PEG 200 induces conformation transition in G-quadruplex from antiparallel to parallel conformation.40
image file: c5ra17390f-f4.tif
Fig. 4 CD spectra of 5 μM AG3(T2AG3)3 prepared in 100 mM (a) K+ (b) Na+ in absence and presence of 10% PEG 400.

For human telomeric DNA, K+ was used with 10% PEG rather than Na+ salt, since with K+ it gives a conformation expected under cellular environment. Upon addition of curcumin, a negative peak appeared at 260 nm while the positive peak at 290 nm was retained, suggesting induction of anti-parallel quadruplex structure upon binding of curcumin [Fig. 5a]. For G-quadruplex, increasing concentration of curcumin led to a decrease in peak intensities around 260 nm and 290 nm. This shows that interaction of curcumin with G quadruplex DNA causes substantial changes in the conformation of G quadruplex DNA. We did not observe any isodichoric point in the CD spectra, which could be due to the presence of more than one conformation of G-quadruplex in solution. Other analogues such as pyrazole curcumin and N-(3-nitrophenyl) pyrazole curcumin also induces similar topology in the quadruplex [Fig. 5b and c]. However, 4-hydroxy 3-methoxy benzylidene curcumin diminishes shoulder peak at 270 nm suggesting it induces antiparallel quadruplex structure (Fig. 5b). The hypochromicity was observed in case of N-(3-fluorophenylphenyl)pyrazole curcumin [Fig. 5b].


image file: c5ra17390f-f5.tif
Fig. 5 CD spectra of 5 μM AG3(T2AG3)3 with (a) curcumin (0, 20 and 30 μM) respectively (b) analogue of curcumin–pyrazole curcumin (red) (20 μM) (ii) N-(3-flurophenyl)pyrazole curcumin (blue) (20 μM) (iii) 4-(4-hydroxy-3-methoxybenzylidene)curcumin (dark cyan) (20 μM) (c) N-(3-nitrophenylpyrazole)curcumin (blue) (20 μM) in 10 mM Tris–HCl having 100 mM KCl and 10% PEG, pH 7.4.

To investigate the selectivity of curcumin binding to G-quadruplex vs. double stranded DNA, we have measured CD spectra of ct-DNA in the presence and absence of curcumin [Fig. S1]. As seen in Fig. S1, ct-DNA in its B conformation shows positive band at around 273 nm and negative band at 245 nm. Whereas gradual titration of curcumin into ct-DNA at increasing concentration of 0, 2, 4, 10, 15 and 20 μM resulted in a slight change in the positive band with no change in band shape or induction of new band. To sum up, CD results shows that curcumin possess stronger affinity and higher specificity for G-quadruplex over ct-DNA.

We have performed circular dichroism experiment of curcumin binding to AG3(T2AG3)3 sequence under increasing concentration of PEG [Fig. S2]. As we increase concentration of PEG 400 from 0 to 30%, a decrease in peak near 235 nm and an increase in positive peak at 290 nm were observed in presence of curcumin. This shows curcumin is retaining antiparallel conformation of quadruplex even in increasing in concentration of PEG 400. While in literature it has been reported that 30–40% PEG induces transformation of anti-parallel to parallel conformation of quadruplex.40

The CD spectrum of the human telomeric sequence AG3(T2AG3)3 in the presence of 100 mM K+ exhibits positive band at 290 nm and 252 nm with shoulder around 272 nm with negative peaks around 235 nm and 260 nm. In contrast, CD spectrum of AG3(T2AG3)3 in the presence of Na+ has a negative peak around 262 nm and a positive peak around 295 nm. An antiparallel structure is characterized by negative peak near 260 nm and positive peak near 295 nm, whereas a parallel structure displays a negative peak near 240 nm followed by a peak near 264 nm and mixed hybrid has two positive maxima at 295 nm and 268 nm.41 Hence telomeric G-quadruplex in K+ solution adopts a hybrid-type mixed parallel/antiparallel conformation. The three G-tetrad have mixed G-arrangement with the top G-tetrad being (syn:syn:anti:syn) and the bottom two being (anti:anti:syn:anti) adopts a novel and distinct topology which can be targeted by small molecules.42 Our data show that 10% PEG 400 did not alter appreciably the conformation of telomeric G-quadruplex DNA in presence of curcumin,40 while facilitating solubilization and increased stability of curcumin enabling the studies of the interaction between curcumin and a human telomeric sequence. In the presence of curcumin, telomeric G-quadruplex DNA sequence still shows small peak around 270 nm and positive peak around 295 nm which is characteristics of hybrid quadruplex structure. Interactions with other analogues also exhibit similar spectra of curcumin too suggesting formation of hybrid parallel/antiparallel G-quadruplex structure in the presence of curcumin analogues.

Circular dichorism thermal denaturation studies

DNA melting studies have been widely employed to investigate the interaction and stability of quadruplex DNA by a ligand. Telomeric G quadruplex DNA shows only small change in absorbance at their UV maximum, 260 nm, while a greater change in the signal was obtained at 295 nm. Hence CD thermal melt of G-quadruplex was performed at 295 nm. The melting temperature of each transition is determined and compared for various ligands. The melting temperature (Tm) which is the mid-point of a given transition at which the complex is 50% dissociated, hence the fraction of folded conformation (α) could, therefore, be calculated at each temperature. A comparison of the Tm values of different ligands enables a simple comparison of their relative stabilities. Fig. 6 shows effect of curcumin on the melting of telomeric G-quadruplex DNA sequence. Tm value for telomeric DNA in 10 mM Tris and 100 mM KCl is 65.9 °C and ΔH value is 55.41 kcal mol−1. These values correlate very well with the values reported earlier.43 We have observed that Tel22 in K+ with 10% PEG shows Tm of 68.9 °C which is increased to 70.6 °C. Thus 15 μM curcumin as a ligand increases the stability of telomeric DNA quadruplex by 2.71 °C [Fig. 7 and Table 1]. The determination of ΔCP from melting was difficult to determine accurately due to subjective change of baseline. The ΔTm value for pyrazole curcumin, N-(3-nitrophenyl)pyrazole curcumin, N-(3-fluorophenyl)pyrazole curcumin and 4-hydroxy 3-methoxy benzylidene curcumin were −1.29, −6.42, −6.33 and −5.26 °C, respectively which are relatively lower than that observed for the complex with native curcumin [Table 1 and Fig. 8]. These results thus show that only curcumin is able to stabilize the quadruplex structure of telomeric DNA sequence while other analogues of curcumin destabilize its conformation.
image file: c5ra17390f-f6.tif
Fig. 6 CD melting curve of 5 μM AG3(T2AG3)3 with 10 mM Tris–HCl with 100 mM KCl (black) and 10% PEG (red), pH 7.4.

image file: c5ra17390f-f7.tif
Fig. 7 CD melting curve of AG3(T2AG3)3 (5 μM, 10 mM Tris buffer and 100 mM KCl pH 7.4) with curcumin 10 μM (red) and 15 μM (blue) in 10 mM Tris–HCl with 100 mM KCl and 10% PEG, pH 7.4. Tm values are listed in Table 2.
Table 1 Thermal stability of telomeric quadruplex DNA with curcumin and its structurally modified analogues measured by CD melting experimentsa
Experimental condition Tm/K ΔH/(kcal mol−1) ΔTm/K
a ΔTma represents difference in thermal melting [ΔTm = Tm (DNA in 10 mM Tris with 100 mM KCl) − Tm (DNA in 10% PEG with 10 mM Tris and 100 mM KCl)]. While ΔTmb represents difference in thermal melting [ΔTmb = Tm (DNA with curcumin) − Tma (DNA in 10% PEG)] in 10 mM Tris HCl with 100 mM KCl, pH 7.4. All experiments were triplicate and the values reported are measurement with the estimated standard deviation.
10 mM Tris and 100 mM KCl, pH 7.4 339.09 ± 0.3 55.41 ± 1.6
10% PEGa 342.35 ± 0.2 37.11 ± 0.9 3.26a
15 μM curcuminb 345.06 ± 0.3 34.80 ± 0.2 2.71b
20 μM curcuminb 345.11 ± 0.2 30.10 ± 0.4 2.76b
20 μM pyrazole curcuminb 341.06 ± 0.5 52.06 ± 5.1 −1.29b
20 μM N-(3-nitrophenyl)pyrazole curcuminb 335.93 ± 0.1 35.81 ± 1.2 −6.42b
20 μM N-(3-fluorophenyl)pyrazole curcuminb 336.02 ± 0.6 40.33 ± 3.4 −6.33b
20 μM 4-hydroxy 3-methoxy benzyldiene curcuminb 337.09 ± 0.14 41.38 ± 2.43 −5.26b


image file: c5ra17390f-f8.tif
Fig. 8 CD melting curve of AG3(T2AG3)3 (5 μM, 10 mM Tris–HCl buffer and 100 mM KCl pH 7.4) with 20 μM each of pyrazole curcumin (black), N-(3-nitrophenyl)pyrazole curcumin (red), N-(3-fluorophenyl)pyrazole curcumin (blue) and 4-hydroxy 3-methoxy benzylidene curcumin (cyan) in 10 mM Tris–HCl with 100 mM KCl and 10% PEG, pH 7.4.

Telomeric G-quadruplex sequence AG3(T2AG3)3 were stabilized more with curcumin as shown by increase in Tm value (Table 1). In contrast, the Tm value for pyrazole analogues of curcumin and the Knoevenagel condensate lead to destabilization of AG3(T2AG3)3 as evident from a decrease in the Tm value of sequence. The oligonucleotide G-quadruplex sequence in comparison was less stable with all the analogues of curcumin studied here. Thus, curcumin stabilizes the G-quadruplex structure increasing the transition temperature by 3 °C, whereas 4-(4-hydroxy-3-methoxybenzylidene)curcumin decreases it by approximately 6 °C. Despite the opposing effects on G-quadruplex melting temperatures observation of, a simultaneous increase in the transition enthalpy in case of 4-(4-hydroxy-3-methoxybenzylidene)curcumin provides a marginal stabilization to the quadruplex.

UV-visible absorption titration studies

UV-visible absorption is frequently used to investigate the DNA binding behavior with a ligand. In this study, we have examined the binding of curcumin, pyrazole curcumin, N-(3-nitrophenyl) pyrazole curcumin, N-(3-fluorophenyl) pyrazole curcumin and 3-methoxy 4-hydroxy benzylidene curcumin to G-quadruplex by a UV-visible absorption experiment. A 10 mM Tris buffer pH 7.4 with 100 mM KCl was used to characterize the interaction of curcumin and its analogue with quadruplex DNA. An intramolecular G-quadruplex was prepared by incubating oligonucleotide AG3(T2AG3)3 with 10 mM Tris and 100 mM KCl, pH 7.4 at 95 °C for 5 min. Then it was gradually cooled at room temperature for 1 h and kept overnight at 4 °C. The expected secondary structure was confirmed by a positive peak at 290 nm and negative peak at 235 nm in CD [Fig. 4]. Fig. 9 shows the UV-visible absorption spectra of curcumin (20 × 10−6 M−1) titrated with quadruplex DNA (0 to 10 × 10−6 M−1) in the presence of 10 mM Tris with 100 mM KCl and 10% PEG. G-Quadruplex induces greater change in hypochromicity (∼86%) as compared to ct-DNA (∼36%) with no change in the wavelength in the Soret band of curcumin (430 nm). The shoulder peak at around 350 nm was also observed in case of curcumin. The striking spectral changes exhibited π–π interactions between chromophore of curcumin and G-quadruplex DNA. The absence of isosbestic point indicates that the binding of curcumin to G-quadruplex DNA sequence involves complex binding process.
image file: c5ra17390f-f9.tif
Fig. 9 (a) Absorption spectra of 20 μM curcumin with AG3(T2AG3)3 in 10 mM Tris–HCl with 100 mM KCl and 10% PEG (b) Scatchard plots for curcumin with AG3(T2AG3)3 is the mole of bound curcumin per mole of AG3(T2AG3)3 (c) binding curves for curcumin with AG3(T2AG3)3 (d) binding constant curve for r = 3.25 to r = 2.702.

The Scatchard analysis can be used to analyze binding data in a quantitative manner. The Scatchard plot from UV-visible absorption titration of G-quadruplex with curcumin shows a non-linearity of Scatchard plot (Fig. 9b). The deviation from linearity may arise from multiple binding modes of curcumin with G-quadruplex or neighbour exclusion effects. Nevertheless, the linear extrapolation of Scatchard plot in the range of r = 2.70 to 3.25 [Fig. 9d] indicate multiple binding sites, n = 4 for curcumin on AG3(T2AG3)3 with an overall association constant of 1.87 × 10⁶ M−1. For pyrazole curcumin K = 3.34 × 10⁵ M−1 for range r = 2.53 to 3.91 [Fig. 11a, Fig. S2]. N-(3-Nitrophenyl) pyrazole curcumin shows greater binding affinity of 5.4 × 10⁵ M−1 with the values of r = 2.85 to 4.25 [Fig. 11b and S4] compared to pyrazole curcumin while N-(3-fluorophenyl) pyrazole curcumin shows binding affinity of 2.22 × 10⁵ M−1 for n values of 3.22 to 3.95 [Fig. 11c, S5]. Knoevenagel condensate (4-(4-hydroxy-3-methoxy)benzylidene)curcumin shows higher binding affinity of 8.5 × 10 5 M−1 than pyrazole curcumin [Fig. 11d, S6]. On the other hand, binding constant of curcumin with ct-DNA obtained is 5.3 × 10⁵ M−1 [Fig. S7].


image file: c5ra17390f-f10.tif
Fig. 10 Plot of r (moles of bound curcumin per G-quadruplex molecule) versus [curcumin]free for the absorption titration.

image file: c5ra17390f-f11.tif
Fig. 11 Absorption spectra of 20 μM pyrazole curcumin (A), N-(3-nitrophenyl)pyrazole curcumin (B), N-(3-fluorphenyl)pyrazole curcumin (C), 4-(4-hydroxy-3-methoxybenzylidene)curcumin (D) with AG3(T2AG3)3 in 10 mM Tris–HCl with 100 mM KCl and 10% PEG.

A modification of the Scatchard equation for multiple binding sites for curcumin to G-quadruplex according to Chaires (2001) was therefore used44

 
r = (nKCf)/(1 + KCf) (5)
where r is the mole of bound ligand per mole of G-quadruplex, K is the association constant and n is the number of ligand binding sites on the G-quadruplex. The plot of r versus Cf should give hyperbolic plot according to eqn (5) if binding were to involve multiple non-interacting sites. Here, however plot of r versus Cf is sigmoidal in nature [Fig. 10] indicating co-operative binding of 4 molecules of curcumin to G-quadruplex and hence direct plot is not suitable for evaluating the binding of curcumin to G-quadruplex. The McGhee–von Hippel model45 assuming cooperative binding was therefore used to determine the overall binding constant of curcumin to the quadruplex to be 0.72 × 10⁶ M−1. The highest binding affinity was exhibited by curcumin followed by 4-(4-hydroxy 3-methoxy)benzylidene curcumin (Table 2).

Table 2 Comparative G4-FID assay and absorption titration results for curcumin and its structural analogues
  Ligand DC50/μM Kb (10−6 M−1)
1 Curcumin 17.24 1.87
2 Pyrazole curcumin 19.7 0.33
3 N-(3-Fluorophenyl)pyrazole curcumin >20 0.22
4 N-(3-Nitrophenyl)pyrazole curcumin >20 0.54
5 4-(4-Hydroxy 3-methoxy)benzylidene curcumin 11.3 0.85


UV-visible absorption result shows that curcumin and its modified analogues binds to quadruplex DNA with affinity constants in the range of 105 to 106 M−1. The hypochromism without significant changes in spectral wavelength and absence of isosbestic point was observed in the absorption spectrum. No shift of UV-visible peak indicates that binding of curcumin and their analogues with quadruplex DNA does not involve intercalation. This indicates curcumin and its analogues form complexes with quadruplex sequence through groove binding and multiple conformations for the quadruplex and quadruplex–curcumin complexes exist. Scatchard analysis also suggested that each G-quadruplex had 4 curcumin binding sites, thus confirming the binding stoichiometry of 1[thin space (1/6-em)]:[thin space (1/6-em)]4 between G-quadruplex and curcumin.

Fluorescence titration

We also investigated whether fluorescence properties of curcumin are affected by binding with G-quadruplex. The steady state fluorescence spectrum indicates the contribution from each emissive species in solution, hence can be used to monitor the changes in the microenvironment of the chromophore(s). The fluorescence spectrum of curcumin displayed two peaks at ∼540 nm and ∼580 nm, with the fluorescence intensity of the 540 nm peak stronger than 580 nm peak. Under molecular crowding condition, curcumin exhibited emission in the range of 540–575 nm when excited at its Soret band (427 nm). An increase in the fluorescence intensity at 542 nm and a blue shift of 5 nm from 542 to 537 nm for its emission maximum indicates its binding in a non-polar region of the G-quadruplex [Fig. 12(i)a]. The increase in the fluorescence intensity of curcumin indicates an increase in the quantum efficiency of the curcumin upon binding to G-quadruplex. Generally, hydrophobic molecules show this type of spectral characteristics when there is binding to hydrophobic pockets. These changes in the fluorescence intensities of curcumin were used to determine of binding constant and number of binding sites on quadruplex as described by Tedesco et al.46 Fluorescence intensity (F) scales up with increase in telomeric quadruplex DNA concentration according to the following relationship:
 
image file: c5ra17390f-t2.tif(6)

image file: c5ra17390f-f12.tif
Fig. 12 (a) Fluorescence emission spectra of curcumin (20 μM) in the absence and in the presence of increasing concentration of AG3(T2AG3)3 (AG3(T2AG3)3: 0, 2, 3, 4, 5, 6, 7, 8, 9 and 10 μM). (b) The double logarithmic plot to calculate Kb, [curcumin] = 20 μM and [AG3(T2AG3)3] = 0 to 10 μM.

The binding constant Kb is obtained by plotting log[(F0F)/(FF)] versus log[DNA], where F0 and F are the relative fluorescence intensities of curcumin alone and curcumin saturated with quadruplex DNA respectively.

The slope of the double-logarithm plot gives the number of the binding site (n), whereas the value of log[DNA] at log[(F0F)/(FF)] = 0 equals the logarithm of the binding constant (Kb) [Fig. 12(i)b]. The value of Kb and n thus obtained are 0.53 × 10⁶ M−1 and is 1.54 (R2 = 0.98), respectively. The value of binding constant from fluorescence is similar to those from Scatchard plot analysis of absorption titration experiment. The fluorescence behaviour of curcumin was also monitored in presence of calf thymus DNA. The emission maximum intensity of curcumin was gradually decreased on increasing concentration of ct-DNA without a shift in the emission wavelength [Fig. S8]. The value of Kb and n thus obtained are 3.3 × 10⁵ M−1 and is 1.11 (R2 = 0.92), respectively. The binding constant of curcumin with ct-DNA obtained from fluorescence and UV-visible titration matches with each other.

Free curcumin is weakly fluorescent molecule, with two emission band at ∼540 nm and ∼580 nm (Fig. 13). Curcumin undergoes keto–enol tautomerism due to presence of the β-diketone moiety. The emission band at 542 nm is assigned to tautomer conformation (S1 → S0) while other band at 575 nm due to another tautomer (S′1 → S′0). The interaction of curcumin with G-quadruplex DNA causes significant enhancement of the fluorescence intensity. The enhancement of fluorescence intensity of curcumin on binding with AG3(T2AG3)3 is due to an increase in quantum yield of curcumin upon binding with G-quadruplex which confirms external groove binding as the mechanism of this interaction. These modes of binding causes minor or no spectral shift with an occasional hyperchromicity, while enhanced fluorescence was believed earlier to be related with only intercalative binding,47,48 subsequent studies have shown its occurrence during groove binding to quadruplex–ligand interaction as well.


image file: c5ra17390f-f13.tif
Fig. 13 Fluorescence spectra of different curcumin analogues in the presence of G-quadruplex DNA. Fluorescence spectra were measured after exciting the ligand at their characteristic absorbance maxima of 427 nm, 327 nm, 332 nm, and 334 nm for curcumin (dark yellow), pyrazole curcumin (black), (N-3-fluophenyl pyrazole)curcumin (red), N-3-nitrophenyl pyrazole curcumin (blue), respectively.

Fluorescence intercalation displacement (FID) assay

FID assay represents a simple and rapid method for evaluating the affinity of various ligands to binding quadruplexes. This method is based on the decrease in the fluorescence due to the displacement of thiazole orange from quadruplex DNA probe by the addition of the putative ligand. This allows for a quantification of the binding constant for curcumin by competitive displacement of the bound probe by ligands. FID curves were obtained by plotting percentage of displacement of thiazole orange versus concentration of a given ligand.

A series of fluorimetric titration were performed with TO, quadruplexes and various analogue of curcumin. The fluorescence area, was converted into percentage displacement (PD, with PD = 100 − [(FA/FA0) × 100]. FA0 being FA prior to the addition of ligand), is then plotted versus the concentration of added ligand. FID curves are presented in Fig. 14. In order to quantify the ligand-induces TO displacement and in turn to sort ligands with respect to this DC50 value was used to evaluate the required concentration of the ligand to displace 50% TO from telomeric quadruplex. Values are reported in Table 2. For telomeric quadruplex sequence, low concentration of 4-((4-hydroxy 3-methoxy)benzylidene)curcumin and curcumin was required to displace 50% thiazole oranges, suggesting higher binding affinity of these ligands for quadruplex. DC50 value for 4-((4-hydroxy 3-methoxy)benzylidene)curcumin and curcumin are 11.3 and 17.24, respectively. However N-(3-nitrophenyl)pyrazole curcumin and N-(3-fluorophenyl)pyrazole curcumin shows weaker binding affinity than pyrazole curcumin. These analogues of pyrazole curcumin were not able to reach 50% threshold of the displacement of the fluorescent probe in the concentration range examined. High affinity of 4-(4-hydroxy 3-methoxy)benzylidene curcumin over curcumin indicates that the additional 4-hydroxy 3-methoxybenzylidene curcumin moiety increases its binding propensity for the G-quadruplex.


image file: c5ra17390f-f14.tif
Fig. 14 FID curves obtained with curcumin (black), 4-hydroxy 3-benzylidene (red), pyrazole curcumin (green), N-(3-nitrophenyl)pyrazole curcumin (blue) and N-(3-fluorophenyl)pyrazole curcumin (cyan) using TO as fluorescent probe.

Thiazole orange is a dye which end-stacks on the two external quartet of a G-quadruplex with high affinity. TO is highly fluorescent upon interaction with G-quadruplex DNA whereas it is completely nonfluorescent when free in solution, which ensures that displacement of a given ligand can be easily monitored by decrease of fluorescence of TO with an excitation wavelength at 501 nm. The percentage decrease of TO was 58% and 68%, respectively, when 20 μM of curcumin and 4-((4-hydroxy-3-methoxy)benzylidene)curcumin was added to the solution of TO bound G-quadruplex, indicating most of the G-quadruplex bound TO has been driven out by curcumin. This proves that curcumin binds to human telomeric G-quadruplex DNA in a mode of end stacking in the grooves of this telomeric sequence.

Identification of binding pockets

Since, the CD spectrum of the human telomeric sequence AG3(T2AG3)3 showed peaks characteristic of hybrid form of the G-DNA quadruplex structure, the NMR structure 2HY9 was considered for identification of binding grooves. This hybrid form exhibited 3 + 1 topology characteristic of mixed parallel/antiparallel G-quadruplex structure. Computational prediction of binding cavities in the NMR solution structure of G-quadruplex hybrid form (PDB ID: 2HY9) using MetaPocket webserver has detected four binding pockets, which two binding pockets were observed between the parallel strands formed by double-chain-reversal loop (3′-3AGGGTTA9-5′ and 3′-6GTTAGGGTTA14-5′), a wide groove formed by two strands arranged in clock wise manner (3′-10GGGTTAGGGT19-5′) and a narrow groove formed by two strands arranged in an anti-clockwise manner (3′-16GGGTTAGGG24-5′) (Fig. 15). These findings together with the experimental evidences confirm further that G-quadruplex hybrid form comprises multiple binding sites.
image file: c5ra17390f-f15.tif
Fig. 15 Identification of binding pockets in G-quadruplex hybrid form. The binding sites are represented as spheres spanning the grooves. Spheres in yellow and pink represent grooves formed by parallel strands formed by double-chain-reversal loop, cyan represents a wide groove formed by two strands arranged in clockwise manner and red spheres represent narrow groove formed by two strands arranged in anti-clockwise manner.

Analysis of G-quadruplex and curcumin complexes

Molecular docking simulations were performed to identify the binding poses as well as relative binding affinities of curcumin and its derivatives with both G-quadruplex hybrid form and double stranded B-DNA, a mimic for calf thymus DNA. Final 100 output conformers obtained through molecular docking simulations of G-quadruplex and curcumin and its derivatives were analysed. Interestingly we found that curcumin and its four derivatives bound to the narrow groove (3′-16GGGTTAGGG24-5′) only, which was formed by anti-parallel adjacent strands connected through a lateral loop in the G-quadruplex hybrid form structure. Whereas, all the curcumin ligands interacted with the AT rich region of minor groove in B-DNA. Similar findings were also reported by Di Leva at al.49 Fig. S11 and S12 of ESI show the docked conformers of curcumin and its derivatives in the narrow groove of hybrid form of G-quadruplex DNA and the minor groove of B-DNA, respectively.

The best ranked output conformation for each ligand was chosen on the Grid Score of Dock v6.6 and computed for electrostatic potentials contributing to binding free energies. The docked pose of the best ranked conformers of each ligand is shown in Fig. 16, where we noticed that curcumin binds to G-quadruplex DNA with low binding free energies in comparison to other four derivatives. A similar trend was observed in binding with B-DNA, where curcumin possessed higher affinity than its derivatives. Also, it was noted that curcumin binds to G-quadruplex DNA with much higher affinity than that observed for B-DNA. Other derivatives of curcumin did not show significant binding (see Table S1). These observations corroborate our experimental results, thus emphasizing that curcumin interacts preferentially with the hybrid form of G-quadruplex DNA. While analyzing the binding modes of 100 s of conformations for curcumin we found that curcumin binds to the G-quadruplex DNA predominantly through minor groove binding. Although, various conformations also orient towards the external G-tetrad thereby participating in end-stacking interactions through π–π interactions49 (ESI Fig. S11).


image file: c5ra17390f-f16.tif
Fig. 16 The binding poses of the best ranked conformers of curcumin and its derivatives docked into the narrow grooves of (a) G-quadruplex DNA hybrid form (PDB ID: 2HY9) and (b) double stranded dodecamer B-DNA (PDB ID: 1BNA).

Conclusions

In conclusion, we have synthesized a number of analogues of curcumin and studied the effect of substituents and chemical nature of the interaction of curcumin to G-quadruplex. Their binding properties with quadruplex vs. duplex selectivity have been characterized by UV-visible absorption, UV-visible titration, steady state fluorescence, fluorescent TO displacement assay, circular dichorism spectroscopy, CD thermal melting as well as molecular docking experiments. Our investigation shows that G-quadruplex form hybrid parallel/antiparallel conformation in the presence of curcumin and their analogues with K+ ions. Curcumin and its various structural analogues are able to stabilize G-quadruplex DNA sequence in molecular crowding condition. As we increase concentration of PEG 400 from 0 to 30%, a decrease in peak near 235 nm and an increase in positive peak at 290 nm were observed in presence of curcumin. This shows curcumin helps in retaining antiparallel conformation of quadruplex even in increasing in concentration of PEG 400. Experimental studies indicated existence of AG3(T2AG3)3/curcumin complex with binding affinity of 0.72 × 10⁶ M−1 under effect of PEG 400 as molecular crowding agent. Curcumin has higher binding with G-quadruplex DNA over duplex DNA. Curcumin form complexes with quadruplex through groove binding and multiple conformation exist which leads to complex binding process. Molecular docking studies also suggested that curcumin binds to narrow groove in the G-quadruplex hybrid form while it interacted with AT rich region of minor groove in B-DNA. On the other hand, analogues of curcumin where keto–enol tautomerism was abrogated i.e.; pyrazole curcumin and its derivative destabilizes the G-quadruplex DNA structure with low binding affinity. Whereas 4-((4-hydroxy-3-methoxy)benzylidene)curcumin which lacks the ability of hydride transfer shows better binding in comparison to pyrazole curcumin. Taken together results from CD, UV-visible, TO displacement assays and molecular docking studies, imply that curcumin and 4-((4-hydroxy-3-methoxy)benzylidene)curcumin have more pronounced groove binding than pyrazole curcumin and its derivatives. Collectively, our studies shows that two o-methoxy phenolic group and the diketo moiety of its heptadoine link of curcumin are important for the quadruplex structure recognition and stabilization. Moreover, the binding affinity and selectivity of curcumin and its structural analogues to human telomeric G-quadruplex in molecular crowding condition establishes curcumin as a promising natural product for G-quadruplex specific ligands.

Acknowledgements

AS is a Bhatanagar fellow of the Council of Scientific and Industrial Research (CSIR), India HRD/Bhatnagar/2011. Also this work is partially supported by a grant from CSIR on neuropathic pain to AS. This work is supported by a grant from the Department of Science and Technology (DST), India SR/WOS-A/CS-95/2012 to NSJ as DST Woman Scientist.

References

  1. R. C. Allshire, M. Dempster and N. D. Hastie, Nucleic Acids Res., 1989, 17, 4611–4627 CrossRef CAS.
  2. S. Burge, G. N. Parkison, P. Hazel, A. K. Todd and S. Neidle, Nucleic Acids Res., 2006, 34, 5402–5415 CrossRef CAS.
  3. D. J. Patel, A. T. Phan and V. Kuryavya, Nucleic Acids Res., 2007, 35, 7429–7455 CrossRef CAS.
  4. E. H. Blackburn, Cell, 1994, 77, 621–723 CrossRef CAS.
  5. W. E. Wright, V. M. Tesmer, K. E. Huffman, S. D. Levene and J. W. Shay, Genes Dev., 1997, 11, 2801–2809 CrossRef CAS.
  6. J. L. Huppert and S. Balasubramanian, Nucleic Acids Res., 2007, 35, 406–413 CrossRef CAS.
  7. S. Rankin, A. P. Reszka, J. Huppert, M. Zloh, G. N. Parkinson, A. K. Todd, S. Ladame, S. Balasubramanian and S. Neidle, J. Am. Chem. Soc., 2005, 127, 10584–10589 CrossRef CAS.
  8. T. Agarwal, S. Roy, T. K. Chakraborty and S. Maiti, Biochemistry, 2010, 49, 8388–8397 CrossRef CAS.
  9. S. Balasubramanian, L. H. Hurley and S. Needle, Nat. Rev. Drug Discovery, 2011, 10, 261–275 CrossRef CAS.
  10. J. L. Huppert, A. Bugaut, S. Kumari and S. Balasubramanian, Nucleic Acids Res., 2008, 36, 6260–6268 CrossRef CAS.
  11. J. Ren, X. Qu, J. O. Trent and J. B. Chaires, Nucleic Acids Res., 2002, 30, 2307–2315 CrossRef CAS.
  12. G. N. Parkinson, M. P. Lee and S. Neidle, Nature, 2002, 876–880 CrossRef CAS.
  13. Y. Wang and D. J. Patel, Structure, 1993, 1, 263–282 CrossRef CAS.
  14. A. M. Zahler, J. R. Williamson, T. R. Cech and D. M. Prescott, Nature, 1991, 350, 718–720 CrossRef CAS.
  15. D. Sun, B. Thompson, B. E. Cathers, M. Salazar, S. M. Kerwin, J. O. Trent, T. C. Jenkins, S. Neidle and L. H. Hurley, J. Med. Chem., 1997, 40, 2113–2116 CrossRef CAS.
  16. K. Jantos, R. Rodriguez, S. Ladame, P. S. Shirude and S. Balasubramanian, J. Am. Chem. Soc., 2006, 128, 13662–13663 CrossRef CAS.
  17. D. S. Pilch, C. M. Barbieri, S. G. Rzuczek, E. J. LaVoie and J. E. Rice, Biochimie, 2008, 90, 1233–1249 CrossRef CAS.
  18. N. V. Anantha, M. Azam and R. D. Sheardy, Biochemistry, 1998, 37, 2709–2714 CrossRef CAS.
  19. A. M. Burger, F. Dai, C. M. Schultes, A. P. Reszka, M. J. Moore, J. A. Double and S. Neidle, Cancer Res., 2005, 65, 1489–1496 CrossRef CAS.
  20. C. Hounsou, L. Guittat, D. Monchaud, M. Jourdan, N. Saettel, J. L. Mergny and M. P. Teulade Fichou, ChemMedChem, 2007, 2, 655–666 CrossRef CAS.
  21. D. Karunagaran, R. Rashmi and T. R. Kumar, Curr. Cancer Drug Targets, 2005, 5, 117–129 CrossRef CAS.
  22. C. H. Hsu and A. L. Cheng, Adv. Exp. Med. Biol., 2007, 595, 471–480 CrossRef.
  23. B. B. Aggarwal, A. Kumar and A. C. Bharti, Anticancer Res., 2003, 23, 363–398 CAS.
  24. N. S. Jha, S. Mishra, S. K. Jha and A. Surolia, Electrochim. Acta, 2015, 151, 574–583 CrossRef CAS.
  25. A. E. Gururaj, M. Belakavadi, D. A. Venkatesh, D. Marmé and B. P. Salimath, Biochem. Biophys. Res. Commun., 2002, 97, 934–942 CrossRef.
  26. R. Mohan, J. Sivak, P. Ashton, L. A. Russo, B. Q. Pham, N. Kasahara, M. B. Raizman and M. E. Fini, J. Biol. Chem., 2000, 275, 10405–10412 CrossRef CAS.
  27. P. Yoysungnoen, P. Wirachwong, P. Bhattarakosol, H. Niimi and S. Patumraj, Clin. Hemorheol. Microcirc., 2006, 34, 109–115 CAS.
  28. S. Ray, N. Chattopadhyay, A. Mitra, M. Siddiqi and A. Chatterjee, J. Environ. Pathol., Toxicol. Oncol., 2003, 22, 49–58 CAS.
  29. T. Haukvik, E. Bruzell, S. Kristensen and H. H. Tonnesen, Pharmazie, 2010, 65, 600–606 CAS.
  30. C. R. Cantor, M. M. Warshaw and H. Shapiro, Biopolymers, 1970, 9, 1059–1107 CrossRef CAS.
  31. V. R. Agashe and J. B. Udgaonkar, Biochemistry, 1995, 34, 3286–3299 CrossRef CAS.
  32. I. Haq, J. O. Trent, B. Z. Chowdhary and T. C. Jenkins, J. Am. Chem. Soc., 1999, 121, 1768–1779 CrossRef CAS.
  33. B. Huang, OMICS, 2009, 13, 325–330 CrossRef CAS.
  34. J. Dai, C. Punchihewa, A. Ambrus, D. Chen, R. A. Jones and D. Yang, Nucleic Acids Res., 2007, 35, 2440–2450 CrossRef CAS.
  35. P. T. Lang, S. R. Brozell, S. Mukherjee, E. F. Pettersen, E. C. Meng, V. Thomas, R. C. Rizzo, D. A. Case, T. L. James and I. D. Kuntz, RNA, 2009, 15, 1219–1230 CrossRef CAS.
  36. H. R. Drew, R. M. Wing, T. Takano, C. Broka, S. Tanaka, K. Itakura and R. E. Dickerson, Proc. Natl. Acad. Sci. U. S. A., 1981, 78, 2179–2183 CrossRef CAS.
  37. A. W. Schüttelkopf and D. M. van Aalten, Acta Crystallogr., Sect. D: Biol. Crystallogr., 2004, 60, 1355–1363 CrossRef.
  38. E. F. Pettersen, T. D. Goddard, C. C. Huang, G. S. Couch, D. M. Greenblatt, E. C. Meng and T. E. Ferrin, J. Comput. Chem., 2004, 25, 1605–1612 CrossRef CAS.
  39. N. A. Baker, D. Sept, S. Joseph, M. J. Holst and J. A. McCammon, Proc. Natl. Acad. Sci. U. S. A., 2001, 98, 10037–10041 CrossRef CAS.
  40. Y. Xue, Z. Y. Kan, Q. Wang, Y. Yao, J. Liu, Y. H. Hao and Z. Tan, J. Am. Chem. Soc., 2007, 128, 11185–11191 CrossRef.
  41. M. Chen, G. Song, C. Wang, D. Hu, J. Ren and X. Qu, Biophys. J., 2009, 97, 2014–2202 CrossRef PubMed.
  42. A. Ambrus, D. Chen, J. Dai, T. Bialis, R. A Jones and D. Yang, Nucleic Acids Res., 2006, 34, 2723–2735 CrossRef CAS PubMed.
  43. J. B. Chaires, FEBS J., 2010, 277, 1098–1106 CrossRef CAS PubMed.
  44. J. B. Chaires, Methods Enzymol., 2001, 340, 3–22 CAS.
  45. J. D. Mc Ghee and P. H. von Hippel, J. Mol. Biol., 1974, 86, 469–489 CrossRef CAS.
  46. A. C. Tedesco and D. M. Oleveira, J. Appl. Phys., 2003, 93, 6704–6706 CrossRef CAS.
  47. V. Sehlstedt, S. K. Kim, P. Carter, J. Goodisman, J. F. Vollano, B. Norden and J. C. Dabrowiak, Biochemistry, 1994, 33, 417–426 CrossRef PubMed.
  48. M. A. Sari, J. P. Battioni, D. Duprt, D. Mansuy and J. B. Le Pecq, Biochemistry, 1990, 29, 4205–4215 CrossRef CAS PubMed.
  49. F. S. Di Leva, E. Novellino, A. Cavalli, M. Parrinello and V. Limongelli, Nucleic Acids Res., 2014, 42, 5447–5455 CrossRef CAS PubMed.

Footnotes

Electronic supplementary information (ESI) available. See DOI: 10.1039/c5ra17390f
Equal contribution.

This journal is © The Royal Society of Chemistry 2016