Modeling of thermal conductivity of nanofluids considering aggregation and interfacial thermal resistance

Meng Liu, Chen Ding* and Jun Wang
School of Aeronautic Science and Engineering, Beijing University of Aeronautics and Astronautics, Beijing 100191, China. E-mail: dingchen@buaa.edu.cn; Tel: +86-132-4130-1892

Received 13th August 2015 , Accepted 18th December 2015

First published on 22nd December 2015


Abstract

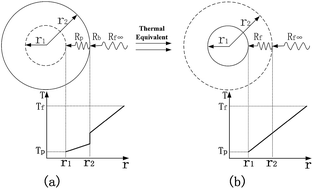
A model with consideration given to particle size, aggregate size and interfacial thermal resistance was developed to predict the thermal conductivity of nanofluids. Interfacial thermal resistance was modeled and found to have a relationship with the equivalent particle size, in terms of keeping the thermal resistance constant. The shape factor of the aggregate was determined by the number of particles in the aggregate. The presented model agrees well with the widely accepted experimental data. It was concluded that particle size and aggregate size have positive effects on the thermal conductivity enhancement, because the increase of particle size can weaken the effect of interfacial thermal resistance, and the increase of aggregate size can offer a fast heat transfer path for adjacent particles and it significantly increases the shape factor of the aggregate. The thermal conductivity of nanofluids increases linearly with particle volume fraction and the increase rate differs according to particle size and aggregate size. The inferred values of interfacial thermal resistance are in a reasonable range and fit well with different experimental data. If the particle volume fraction is lower than 0.1%, or if the particle size is smaller than 10 nm without aggregation, the factors of nano-convection and nanolayers need to be taken into account.


1. Introduction

The discovery of nanofluids, in which solid nanoparticles are dispersed in a conventional base fluid, has aroused worldwide interest in the last two decades. Numerous studies have shown that compared with base fluid, nanofluids can dramatically improve thermal conductivity, convective heat transfer and solar energy absorption features.1–3

Reports have shown that the thermal conductivity, k, of nanofluids depends on factors like particle volume fraction (ϕ), single particle diameter (d), particle morphology, additives, pH value, temperature, nature of the base fluid and particle materials.4 The studies of the effect of particle size on the k of nanofluids have produced conflicting reports. Patel et al.5 and Cui et al.6 used experimental methods and molecular dynamics (MD) simulations, respectively, to find out that the k increased with the reduction of particle diameter. However, Beck et al.7 measured the k of nanofluids that contain nanoparticles of different diameters and found an enhancement in k as particle size increased. Taking temperature into consideration, most studies show an enhancement in k with the increase in temperature.5,8,9 Taking the materials of the base fluid and nanoparticles into account, most of the studies show an increase in k with the reduction of k of the base fluid, and the increase of k of the nanoparticles.5,10 The shape of the particles and the formation of clusters in the nanofluids significantly influence the k of the nanofluids. The benchmark study on alumina nanoparticles and nanorods in PAO showed that the k was higher if the particles had larger aspect ratios (nanorods).11 Particles in the nanofluids were prone to form aggregates, which can enhance the k of nanofluids because aggregates create paths of lower thermal resistance among particles, and heat could be conducted rapidly in the cluster. Moreover, aggregates set up percolating structures and the effective volume of the aggregates could be much larger than the total volume of the particles.12,13 The effect of pH value and the addition of surfactant on k were also studied. Lee et al.14 found that because the pH value was far from the isoelectric point, the particle size changed and particles became more stable. Younes et al.15 demonstrated that the pH value affected zeta potentials and aggregate size, and surfactant could separate particles to avoid forming clusters and stabilize nanofluids.

The mechanisms of the unusual high thermal conductivity of nanofluids with low particle volume fractions are controversial. The Maxwell model was firstly introduced to model the k of nanofluids based on the effective medium theory (EMT).16 Hamilton17 took particle shape effects into account. The phenomenon that the measured k of nanofluids was anomalously greater than theoretical predictions attracted considerable attention.1 The existence of an ordered layer of liquid molecules at the solid–liquid interface was experimentally proved, and it could measurably increase the k of nanofluids when particle diameter was below 10 nm.18,19 Brownian motion and the convective heat transfer induced by Brownian motion of nanoparticles were considered as the mechanisms of the enhancement of k in nanofluids.20–22 On the contrary, Gao et al.23 measured the k of nanofluids in both liquid and solid states and figured that the effect of Brownian motion on k of nanofluids was much less than that of the clustering formation.

Mathematical models to predict the k of nanofluids are built on many investigations. Brownian motion of particles may result in convection-like effects on the nanoscale.24 Prasher et al.21 introduced a model considering local convection caused by Brownian movement of particles based on EMT. The convection factor was given by kcon = (1 + ARemPr0.333ϕ)kf, where Re and Pr are Reynolds number and Prandtl's number, respectively, and A and m are constants determined by experimental results. Yu et al.19 modified the Maxwell model to include the effect of the ordered nanolayer. With the nanolayer of thickness h attaching to the surface of the particles, the equivalent particle radius became r + h and the equivalent particle volume fraction increased. The effect of the ordered layer was rapidly weakened as particle diameter increased, and it wore off if particle diameter was larger than 10 nm. Increasing evidence suggests that EMT can estimate thermal conductivity by considering the effect of aggregation and interfacial resistance.10,25 Based on the study by Nan et al.,26 who introduced a methodology to predict the k of particulate composites with interfacial thermal resistance, Prasher et al.12 and Evans et al.27 built a three-level homogenization model to evaluate the k of colloids, assuming that an aggregate was composed of a few linear chains that spanned the whole cluster and side chains. In the first level, the k of the aggregate with a dead end was calculated by the Bruggeman model, then, the k of the aggregate that includes a backbone was calculated by the model of Nan et al. Finally, the k of nanofluids with aggregates was obtained by the Maxwell model. Based on the three-level homogenization, Okeke et al.28 numerically investigated the k of nanofluids with the consideration of different factors and found that aggregate size affected thermal conductivity, whereas interfacial thermal resistance did not play a major role. Zhou et al.29 built a model based on particle size distribution and found that the k of nanofluids could be enhanced if there were clusters in it.

In this study, the authors build a model to predict the k of nanofluids based on the EMT, considering the factors of particle size, aggregate size, particle volume fraction and interfacial thermal resistance. According to this model, the increase of interfacial thermal resistance is equivalent to the decrease of particle size in terms of keeping thermal resistance constant, which further affects the effective particle volume fraction. Aggregate size affects the shape factor and the number of particles in the aggregate. The predictions of the presented model are compared with experimental results in the literature, and they are in good agreement. Various simulations of the k of nanofluids are established to analyze factors such as particle size, aggregate size and particle volume fraction on the k of nanofluids. Finally, further discussions on the divergence of the presented model and some experimental data are made.

2. Model development

The schematic of a particle in nanofluids is shown in Fig. 1. The particle is assumed to be a sphere with a radius r2. The thermal resistance in nanofluids contains particle thermal resistance Rp(K/W), fluid thermal resistance Rf(K/W) and interfacial thermal resistance Rb(Km2/W) at the solid/liquid interface. The boundary conditions at the interface can be expressed as30
 
image file: c5ra16327g-t1.tif(1)
 
image file: c5ra16327g-t2.tif(2)
where kp and kf are particle and base fluid thermal conductivity (W/mK), respectively, Tp and Tf are particle temperature and base fluid temperature at the solid/liquid interface, and r refers to the radius vector.

image file: c5ra16327g-f1.tif
Fig. 1 The schematic of the geometry of a particle. The circle with a solid line shows (a) the actual particle and (b) the thermal equivalent particle. The temperature change along the radius direction, assuming there is temperature gradient around a particle, is also presented. Rf∞ refers to water thermal resistance around the particle.

Considering that there is a temperature gradient around a particle, as shown in Fig. 1, a temperature difference exists at the solid/liquid interface due to interfacial thermal resistance. Because the temperature difference makes it difficult to model the process of heat conduction, we assume that there is no temperature difference at the solid/liquid interface and the particle radius is smaller than r2, as depicted in Fig. 1(b). We can get a certain value for a hypothetical particle radius r1 that makes the hypothetical particle thermal resistance (Fig. 1(b)) equal to the original particle thermal resistance (Fig. 1(a)).

The thermal resistance of the sphere between the surfaces of radius r1 and r2 that contains interfacial thermal resistance can be expressed as

 
image file: c5ra16327g-t3.tif(3)

Assuming that there is no interfacial thermal resistance at the solid/liquid interface and particle radius is r1, as shown in Fig. 1(b), the space between r1 and r2 is filled with liquid, so the thermal resistance between the surfaces of radius r1 and r2 becomes as follows

 
image file: c5ra16327g-t4.tif(4)

We can then get a certain value of r1 that makes the thermal resistance in Fig. 1(a and b) equal. Thus, the thermal resistance of the original particle and the hypothetical particle are the same, which is called the “thermal equivalent condition”. In this condition we can get

 
image file: c5ra16327g-t5.tif(5)

Transforming eqn (5), r1 is expressed as follows:

 
image file: c5ra16327g-t6.tif(6)

Considering the particle in Fig. 1(b), the effective particle volume fraction can be expressed as follows:

 
image file: c5ra16327g-t7.tif(7)
where ϕ is the particle volume fraction. Interfacial thermal resistance reduces the equivalent particle radius and the effective particle volume fraction.

Hamilton17 developed a model to predict the effective thermal conductivity of suspensions based on EMT. The influence of irregular shapes of particles was considered and the expression of the k of nanofluids was given as follows:

 
image file: c5ra16327g-t8.tif(8)
where keff is the effective thermal conductivity of nanofluids, n is the shape factor given by n = 3/ψ with ψ denoting the sphericity of particles. ψ is defined as the ratio of the surface area of the sphere with the same volume as a particle to the external surface area of a particle. In the presented model, the effective thermal conductivity of nanofluids can be determined by eqn (8).

Due to Brownian motion and the interaction among particles, the particles are randomly packed together and form aggregates of fractal structure.31–33 The number of particles in an aggregate, N, is given by N = (Rg/r)df, whereRg is the aggregate radius of gyration, and df is the aggregate fractal dimension. As previously denoted, an aggregate act as an independent particle unit and its surface area is the same as the surface area of primary particles in the aggregate. Therefore, assuming that the primary nanoparticles are spheres with uniform sizes, we can get ψ = N1/3 according to the definition of ψ. The block diagram for the guidance of the model usage is shown in Fig. 2.


image file: c5ra16327g-f2.tif
Fig. 2 Block diagram of the steps of the model.

3. Model verification

The comparisons between the presented model and experimental results in the literature are used to validate the presented model. The sizes of particles and aggregates are rarely mentioned in literature, and results vary when using different measurement methods for the same sample, because of possible size polydispersity, formation of ordered fluid layers and clustering of particles.7,34

Because particle size is defined by the area of the solid/liquid interface that acts as a new phase affecting properties of nanofluids, the specific surface area of the particles measured by Brunauer–Emmett–Teller (BET) analysis can be used to determine average particle size. The average hydrodynamic diameter of species involved in Brownian motion can be estimated by dynamic light scattering (DLS). Because one aggregate is involved in Brownian motion as a whole, the average aggregate size can be determined by DLS. In these considerations, the reported particle sizes, using BET and DLS, are used to determine particle size and aggregate size, and the experimentally measured k of nanofluids are used to validate the presented model.

The interfacial thermal resistance at the solid/liquid interface has been discussed by researchers. Wilson et al.35 experimentally estimated Rb ≈ 0.77 × 10⁻⁸Km2/W for the particle–water interface and got Rb ≈ 1.61 × 10⁻⁸Km2/W based on the diffuse-mismatch model (DMM). Xue et al.36 figured that interfacial thermal resistance was strongly dependent on the type of bonding between the solid and the liquid, and nanofluids characterized by weak atomic bonding at the solid–liquid interfaces will exhibit high thermal resistance. According to DMM, the velocity of sound and the heat capacity of the base fluid have influence on the interfacial thermal resistance. Under the assumption that the velocity of sound in ethylene glycol and water were approximately the same, Prasher et al.21 assumed Rb ≈ 1.21 × 10⁻⁸Km2/W for ethylene glycol based nanofluids. Because the accurate value of Rb for different particle–liquid interfaces is unavailable, we assume Rb = 1 × 10⁻⁸Km2/W for the particle–water interface, and Rb = 1.5 × 10⁻⁸Km2/W for the particle–organic solvent interface, based on DMM as a first approximation.

The coagulation of primary particles into aggregates, known as “cluster–cluster” aggregation, can be characterized by fractal dimension df. Two kinetic regimes, diffusion-limited aggregation (DLA) and reaction-limited aggregation (RLA), have been identified for cluster–cluster aggregation.31 In DLA, particles collide and combine instantaneously, producing a highly porous, convoluted aggregate, which is similar to the process of aggregation in nanofluids. The value of df is around 1.8.31–33 In RLA, there is a significant repulsive barrier to aggregation and the sticking probability on aggregate–aggregate interaction is less than unity. The value of df is around 2.1–2.2.31 It is therefore reasonable to assume df = 1.8 in this study.

The thermal conductivity of four sets of test nanofluids were measured by over 30 organizations worldwide to resolve the inconsistencies of the reported thermal conductivity of nanofluids.11 Because the data from most organizations lie within a narrow band, these data are used to validate the presented model. The characteristics of the four sets of samples are listed in Table 1. In the presented model, particles are assumed to be spheres; therefore, the samples of alumina nanorods are not used for comparison.

Table 1 Characteristics of the samples for validation
  Particle type Volume fractiona (%) Particle sizeb (nm) Aggregate sizec (nm) Type base fluid
a The volume fraction of particles, reported by the providers.b The particle sizes are the nominal particle sizes. As gold particles and silica particles are well dispersed without aggregation, the particle sizes are the same as aggregate sizes.c The sizes of aggregates are the average sizes of the dispersed phase, measured by DLS, or the particle size for the nanofluids without aggregation.
1 Alumina 1 10 81.5 PAO + surfactant
2 Alumina 3 10 105.5 PAO + surfactant
3 Gold 0.001 15 15 Water + stabilizer
4 Silica 31.1 22 22 Deionized water
5 Mn–Zn 0.17 7.4 11 Water + stabilizer


Comparisons of the k enhancement (keff/kf) between experimental results and predictions of the presented model are depicted in Fig. 3. The k enhancement as a function of fraction dimension is plotted to evaluate the robustness of the model because the value of fraction dimension (df) was handpicked from some references.


image file: c5ra16327g-f3.tif
Fig. 3 The k enhancement as a function of fractal dimension. The k enhancement of experimental results from ref. 11 is also presented.

It was found that the experimental data are consistent with the presented model, if the fraction dimension is set as 1.8. The influence of the magnitude of the fraction dimension on the k enhancement is minor enough to prove that the agreement is truly convincing. The volume fraction of gold particles was too low to estimate the k enhancement using the presented model.

4. Results and discussion

4.1 Effect of particle size on the k enhancement of nanofluids

The predictions of the k enhancement with different particle sizes using the presented model, the three-level homogenization model,12 and the renovated Maxwell model that considers nanolayers19 are shown in Fig. 4. The experimental data measured by Timofeeva et al.34 are also listed for comparison. They measured the k of water-based α-SiC nanofluids for different particle sizes. The average particle diameters were determined by BET and the average aggregate sizes were measured by DLS. The parameters in the three-level homogenization model are the same as the proposed values in ref. 12. The particle sizes and aggregate sizes used in Fig. 4 are the same as the experimental measurements.
image file: c5ra16327g-f4.tif
Fig. 4 Dependence of the k enhancement on the average particle diameter in 4.1 vol% of water based SiC nanofluids. The experimental data in ref. 34 and predictions obtained by the presented model, the three-level homogenization model, and the renovated Maxwell model that considers nanolayers are presented.

Fig. 4 indicates that both the presented model and the experimental results show the increase of k enhancement with the increase of average particle sizes. The reason particle size has a positive effect on k enhancement is that as the average particle size increases, the total surface area of the solid/liquid interface decreases geometrically, thus weakening the effect of interfacial thermal resistance (according to eqn (3)). The predictions of this model (kcal) fit well with the experimental results (kexp), with the deviations ((kcalkexp)/kexp × 100%) being within ±3%.

For the three-level homogenization model, although the increase of particle size can weaken the effect of interfacial thermal resistance and enhance the k of nanofluids, the aggregate size has a greater impact on the k of nanofluids. It also shows that compared with the three-level homogenization model, the presented model can better predict the k of nanofluids. According to the renovated Maxwell model, the nanolayer has a significant impact on small particles. However, with the increase of particle sizes, the k enhancement decreases and the renovated Maxwell equation reduces to the original Maxwell equation, because the impact of nanolayers becomes smaller.

4.2 Effect of aggregate size on the k enhancement

Studying the k enhancement with the absolute value of aggregate size is meaningless because particle sizes vary. With this consideration, the authors investigated the effect of relative aggregate size, defined as the ratio of aggregate diameter to particle diameter (Dg/d), on the k enhancement. The relative aggregate size reflects the amount of particles of an aggregate and its aggregate shape factor.

The k enhancement as the function of Dg/d for water based alumina nanofluids is shown in Fig. 5. The particle volume fraction is set as 2% and the particle diameters are maintained constant for each line. The k of 2 vol% water based alumina nanofluids reported by Beck et al.7 is also presented to make a comparison. The particle diameters were obtained from BET measurements and the aggregate sizes were obtained from DLS.


image file: c5ra16327g-f5.tif
Fig. 5 Influences of relative aggregate size (Dg/d) on the k enhancement of 2 vol% water based alumina nanofluids. Experimental data from ref. 7 are also presented.

Fig. 5 shows that the k enhancement rises rapidly as Dg/d increases, and the growth rate decreases as aggregate size becomes larger. If the aggregate size is fixed, k enhancement increases as particle size becomes larger. The estimates of the presented model show good agreement with the experimental data, with deviations within 4.67%.

The reason the aggregate size has a positive effect on the k enhancement is that the number of particles in an aggregate increases as the aggregate size becomes larger, which significantly increases the shape factor of the aggregates and enhances the k of nanofluids according to eqn (8).

4.3 Effect of particle volume fraction on the k enhancement

The predictions of k enhancement as a function of particle volume fraction for a series of alumina nanofluids are depicted in Fig. 6. The sizes of particles and aggregates used in the presented model are the same as those measured by Timofeeva et al.10 In their experiment, the k of water and ethylene glycol based alumina nanofluids were measured and aggregate size distributions were determined by DLS. Although the intensity-weighted distributions of aggregate sizes have two peaks, the volume fractions of bigger aggregates are much less than those of the smaller ones. Therefore, the sizes of smaller aggregates are considered as the aggregate sizes, which are 88, 120, and 40 nm, and the nominal particle diameters are 11, 20, and 40 nm, respectively.
image file: c5ra16327g-f6.tif
Fig. 6 The k enhancement as a function of particle volume fraction. The lines are the presented model predictions of k enhancement for nanofluids with 11, 20, and 40 nm nominally sized alumina particles in (a) ethylene glycol and (b) water. The aggregate sizes are four, six and one time(s) the particle size. The dots are the experimental data from ref. 10.

It can be observed from Fig. 6 that the k enhancement of nanofluids increases linearly with the rise of particle volume fraction, which is consistent with the experimental data. For ethylene glycol based nanofluids (Fig. 6(a)), when the volume fraction is fixed, the highest enhancement is observed in nanofluids with particle size of 20 nm, the second highest for 11 nm particles and the lowest for 40 nm particles. The experimental data are within the range of predictions and show that all particle sizes presented the same trend, and this factor has less influence on the k enhancement. The reason nanofluids with the largest particle size (d = 40 nm) show the lowest k enhancement is that the particles (d = 40 nm) are well dispersed in the base fluid without aggregation and cannot form a rapid thermal conduction path among themselves. By contrast, for water based nanofluids (Fig. 6(b)), experimental data show that nanofluids with particle size of 40 nm show the highest k enhancement, which is not consistent with the presented model. The maximum deviations between the experimental data and presented model are within ±8.5%, and the reason might be the variation of the particle size distribution and the uncertainty of interfacial thermal resistance.

The uncertainty of interfacial thermal resistance has a great influence on the k enhancement, as shown in Fig. 6(b). When interfacial thermal resistance is neglected, the k enhancement is much larger than the prediction with Rb = 1 × 10⁻⁸Km2/W for water based nanofluids of fixed volume fraction. Although it is hard to obtain the exact value of interfacial thermal resistance, the comparisons between the presented model and the experimental data7,10,11,34 show that the inferred values of interfacial thermal resistance are within a reasonable range.

4.4 Further discussion about the divergence of the presented model and some experimental results

The relationship between the k of nanofluids and the particle volume fraction is different in different experimental results. Although the presented model analyzes the factors of particle size, aggregate size and interfacial thermal resistance on the divergence of k of nanofluids, some phenomena still need to be discussed further.

First, the anomalous k enhancement at a low particle volume fraction, less than 0.1 vol%, cannot be predicted by the presented model. The measured k enhancement (keff/kf) of 0.001 vol% water based gold nanofluids is 1.015, as shown in Fig. 3, whereas the presented model predicts almost no k enhancement. Pang et al.37 found non-linear enhancement at low concentration and the k of nanofluids was much larger than the prediction when using EMT. The k enhancement at low concentration may dominantly contribute to nano-convection, and can be predicted by the model built by Pang et al.37 and Prasher et al.21

Second, some nanofluids with a small amount of aggregation and particles whose diameters are lower than 10 nm, show larger k enhancement than the predictions of the presented model. Eastman et al.38 found that k enhancement of ethylene glycol based Cu nanofluids was up to 1.4 when particle volume fraction was 0.3%. In this study, a one-step production procedure was used and the particle diameter was less than 10 nm with very little aggregation. Philip et al.4 reported that the k enhancement of Fe3O4 nanofluids was larger than the predictions of the presented model. The particle diameter was 8 nm and there was little aggregation. The reason why nanofluids without aggregates but with well dispersed particles, whose diameters were less than 10 nm show larger k enhancement, might be as a result of the forming of the solid-like nanolayer at the solid/liquid interface. The solid-like liquid layer of thickness h around particles is more ordered than that of the base fluid and the k of the layer is larger than that of the base fluid. The effective particle volume fraction would then be calculated as ϕeff = ϕ(1 + h/r)3, which is much larger than the primary particle volume fraction.

Third, the presented model could not predict the k of nanofluids if the shape of the particles was not spherical. The k of alumina nanorod nanofluids is larger than the k of alumina particles at the same particle volume fraction.11 Philip et al.4 concluded that all thermal conductivity studies in carbon nanotube (CNT) nanofluids showed k enhancement is inconsistent with the predictions of EMT. The reason might be that the shape factor of nanorods and CNT are larger than that of the spherical particles. Lamas et al.39 made several correlations to predict the k of CNT nanofluids and presented critical analysis on these models. However, it is still necessary to conduct further studies about the influence of the particle shape on the k enhancement.

5. Conclusions

In the present study, a model for predicting the thermal conductivity of nanofluids is built considering particle size, aggregate size and interfacial thermal resistance. In this model, the existence of interfacial thermal resistance is considered, and an aggregate acts as an independent unit of a particle. The shape factor of the aggregate is determined based on the number of particles in the aggregate. The k of nanofluids is obtained using the EMT-based Hamilton model. Based on analysis of the factors that influence the k enhancement, it is concluded that particle size and aggregate size have positive effects on the k enhancement. The increase of particle size can weaken the effect of interfacial thermal resistance and enhance the k of nanofluids because the total surface area of the solid/liquid interface decreases as particle size increases. As aggregate size becomes larger, the shape factor of the aggregate significantly increases and the k of nanofluids will also be enhanced. The k of nanofluids increases linearly with particle volume fraction, and the increase rates vary according to particle size and aggregate size. This can explain the divergence of the experimental results. Because the presented model fits different experimental data well, the inferred values of interfacial thermal resistance are within a reasonable range. Considering the case of nanofluids with particle volume fraction lower than 0.1% and particle size smaller than 10 nm without aggregation, the factors of nano-convection and nanolayers need to be taken into account.

References

  1. S. U. S. Choi, Z. G. Zhang, W. Yu, F. E. Lockwood and E. A. Grulke, Appl. Phys. Lett., 2001, 79, 2252–2254 CrossRef CAS .
  2. S. S. J. Aravinda and S. Ramaprabhu, RSC Adv., 2013, 3, 4199–4206 RSC .
  3. Y. Xuan, H. Duan and Q. Li, RSC Adv., 2014, 4, 16206–16213 RSC .
  4. J. Philip and P. D. Shima, Adv. Colloid Interface Sci., 2012, 183–184, 30–45 CrossRef CAS PubMed .
  5. H. E. Patel, T. Sundararajan and S. K. Das, J. Nanopart. Res., 2010, 12, 1015–1031 CrossRef CAS .
  6. W. Z. Cui, Z. J. Shen, J. G Yang, S. H. Wu and M. L. Bai, RSC Adv., 2014, 4, 55580–55589 RSC .
  7. M. P. Beck, Y. H. Yuan, P. Warrier and A. S. Teja, J. Nanopart. Res., 2009, 11, 1129–1136 CrossRef CAS .
  8. P. M. Sudeep, J. Taha-Tijerina, P. M. Ajayan, T. N. Narayananc and M. R. Anantharaman, RSC Adv., 2014, 4, 24887–24892 RSC .
  9. S. K. Das, N. Putra, P. Thiesen and W. Roetzel, J. Heat Transfer, 2003, 125, 567–574 CrossRef CAS .
  10. E. V. Timofeeva and A. N. Gavrilov, et al., Phys. Rev. E: Stat., Nonlinear, Soft Matter Phys., 2007, 76, 061203 CrossRef PubMed .
  11. J. Buongiorno, et al., J. Appl. Phys., 2009, 106, 094312 CrossRef .
  12. R. Prasher, W. Evans, P. Meakin, J. Fish, P. Phelan and P. Keblinski, Appl. Phys. Lett., 2006, 89, 143119 CrossRef .
  13. P. Keblinski, S. R. Phillpot, S. U. S. Choi and J. A. Eastman, Int. J. Heat Mass Transfer, 2002, 45, 855–863 CrossRef CAS .
  14. D. Lee, J. W. Kim and B. G. Kim, J. Phys. Chem. B, 2006, 110, 4323–4328 CrossRef CAS PubMed .
  15. H. Younes, G. Christensen, X. Luan, H. Hong and P. Smith, J. Appl. Phys., 2012, 111, 064308 CrossRef .
  16. J. C. Maxwell, A treatise on electricity and magnetism, Clarendon Press, Oxford, UK, 1873 Search PubMed .
  17. R. L. Hamilton and O. K. Crosser, Ind. Eng. Chem. Fundam., 1962, 1, 187–191 CAS .
  18. C. J. Yu, A. G. Richter, A. Datta, M. K. Durbin and P. Dutta, Phys. Rev. B: Condens. Matter Mater. Phys., 2000, 283, 27–31 CrossRef CAS .
  19. W. Yu and S. U. S. Choi, J. Nanopart. Res., 2003, 5, 167–171 CrossRef CAS .
  20. R. Prasher, P. Bhattacharya and P. E. Phelan, Phys. Rev. Lett., 2005, 94, 025901 CrossRef PubMed .
  21. R. Prasher, P. Bhattacharya and P. E. Phelan, J. Heat Transfer, 2006, 128, 588–595 CrossRef CAS .
  22. S. Mehta, K. P. Chauhan and S. Kanagaraj, J. Nanopart. Res., 2011, 13, 2791–2798 CrossRef CAS .
  23. J. W. Gao, R. T. Zheng, H. Ohtani, D. S. Zhu and G. Chen, Nano Lett., 2009, 9, 4128–4132 CrossRef CAS PubMed .
  24. S. P. Jang and S. U. S. Choi, Appl. Phys. Lett., 2004, 84, 4316–4318 CrossRef CAS .
  25. R. Prasher, P. E. Phelan and P. Bhattacharya, Nano Lett., 2006, 6, 1529–1534 CrossRef CAS PubMed .
  26. C. W. Nan, R. Birringer, D. R. Clarke and H. Gleiter, J. Appl. Phys., 1997, 81, 6692 CrossRef CAS .
  27. W. Evans, R. Prasher and J. Fish, et al., Int. J. Heat Mass Transfer, 2008, 51, 1431–1438 CrossRef CAS .
  28. G. Okeke, S. Witharana, S. J. Antony and Y. Ding, J. Nanopart. Res., 2011, 13, 6365–6375 CrossRef CAS .
  29. D. Q. Zhou and H. Y. Wu, Appl. Phys. Lett., 2014, 105, 083117 CrossRef .
  30. D. P. H. Hasselman and L. F. Johnson, J. Compos. Mater., 1987, 21, 508–515 CrossRef .
  31. T. D. Waite, J. K. Cleaver and J. K. Beattiez, J. Colloid Interface Sci., 2001, 241, 333–339 CrossRef CAS .
  32. B. X. Wang, L. P. Zhou and X. F. Peng, Int. J. Heat Mass Transfer, 2003, 46, 2665–2672 CrossRef CAS .
  33. P. Meakin, Rev. Geophys., 1991, 29, 317–354 CrossRef .
  34. E. V. Timofeeva and D. S. Smith, et al., Nanotechnology, 2010, 21, 215703 CrossRef PubMed .
  35. O. M. Wilson, X. Hu, D. G. Cahill and P. V. Braun, Phys. Rev. B: Condens. Matter Mater. Phys., 2002, 66, 224301 CrossRef .
  36. L. Xue, P. Keblinski, S. R. Phillpot, S. U. S. Choi and J. A. Eastman, J. Chem. Phys., 2003, 118, 337–339 CrossRef CAS .
  37. C. Pang, J. Y. Jung and Y. T. Kang, Int. J. Heat Mass Transfer, 2014, 72, 392–399 CrossRef CAS .
  38. J. A. Eastman, S. U. S. Choi, S. Li, W. Yu and L. J. Thompson, Appl. Phys. Lett., 2001, 78, 718–720 CrossRef CAS .
  39. B. Lamas, B. Abreu, A. Fonseca, N. Martins and M. Oliveira, Int. J. Therm. Sci., 2014, 78, 65–76 CrossRef CAS .

This journal is © The Royal Society of Chemistry 2016