
Distribution of carbon nanotubes in fresh ordinary Portland cement pastes: understanding from a two-phase perspective†
Shu Jian Chena,
Wei Wanga,
Kwesi Sagoe-Crentsilb,
Frank Collinsa,
Xiao Ling Zhaoa,
Mainak Majumderc and
Wen Hui Duan*a
aDepartment of Civil Engineering, Monash University, Clayton, VIC 3800, Australia. E-mail: wenhui.duan@monash.edu
bCSIRO Manufacturing & Infrastructure Technology, Highett, Victoria 3190, Australia
cDepartment of Mechanical and Aerospace, Monash University, Clayton, VIC 3800, Australia
First published on 5th January 2016
Abstract
Significant research advances have been made in the field of carbon nanotube (CNT) reinforced ordinary Portland cement (OPC) paste composites in recent years. However, the distribution of CNTs in fresh OPC paste is yet to be fully researched and quantified, thereby creating a technical barrier to CNT utilization in concrete construction. In this study, fresh OPC paste was treated as a two-phase material containing solid particles (cement grains) and liquid solutions (pore solutions). A centrifugation-based technique was proposed to separate these two phases and the presence of CNTs in each phase was quantified. UV-Vis spectrometry showed that the degree of dispersion can achieve above 90 wt% using polycarboxylate superplasticizer. The results suggested an upper limit of 0.26 wt% for CNT addition into water before mixing with OPC, and the dispersion was found to be stable for at least 4 hours. Based on scanning electron imaging, the adsorption phenomenon of CNTs on OPC grains with size less than 4 μm was discovered. Energy-dispersive X-ray spectroscopy indicated these adsorptive particles have lower Ca to Si ratio. It was observed that about 0.5 mg of CNTs per gram of OPC grains was adsorbed in solid OPC grains in typical fresh OPC pastes. On the basis of these results, a conceptual model was proposed for the distribution of CNTs in fresh OPC paste where about 33 wt% of the CNTs stay in pore solution and 65 wt% of CNTs are adsorbed on OPC grains.
1. Introduction
Carbon nanotube (CNT) reinforced ordinary Portland cement (OPC) composites have attracted considerable attention in recent years. Much research has focused on improving the engineering properties of OPC pastes using CNTs.1–6 It has been found that the addition of CNTs can improve compressive and flexural strength, fracture toughness, Young's modulus,7 porosity,8 electrical resistance,9 and piezoresistivity10,11 of the composite.All these property modifications using CNTs are affected by the distribution of CNTs in the OPC paste matrix. In order to utilized the superior properties of CNTs such as high strength, high electrical and thermal conductivity and large aspect ratio, it is preferred that the CNTs are well distributed in the matrix as single-tubes instead of agglomerates.7 Understanding the distribution of CNTs in OPC paste is essential to study the modification effect of the CNTs.
After mixing with CNT aqueous solution, the OPC powder turns into a paste and the hydration reaction begins. The fresh OPC paste is a fluid before it gradually loses its fluidity due to the reaction. After a period of time, the paste turns into a rigid gel, hardened OPC paste.12 Correspondingly, three main approaches have been adopted in literature to investigate the dispersion of CNTs: (1) to investigate the dispersion of CNTs in aqueous solutions before mixing;13 (2) to measure the viscosity of fresh OPC paste;14 (3) to use the properties of the hardened paste to indicate the effectiveness of the dispersion.14,15
The dispersion of CNTs in aqueous solutions has been studied in depth in the past decade. Dispersion using surfactants is often desired as it preserves the integrity of the CNT walls. Unfortunately, many of the popular surfactants for dispersing CNTs in water16–18 have problems of compatibility with OPC pastes.7 In the work of Collins et al.,13 where different OPC-compatible surfactants (cement additives) were used to disperse CNTs in water, polycarboxylate-based superplasticizer was found to give the best dispersion results. Studies have also shown that multi-walled CNTs can be dispersed more easily due to their larger diameter7 compared with single-walled CNTs.
As CNTs have a large specific surface area that absorbs water, studies have generally reported increased viscosity of the fresh paste when CNT is incorporated.7 It has also been suggested that the CNTs may act as nucleation sites, accelerating the hydration reaction and thereby increasing the viscosity.7,8,19 In the authors' previous study, the viscosity of the fresh paste was found to increase with an increase in the amount of dispersed CNTs in aqueous solutions.14
Other studies7,14,15 have shown that significant improvement in the mechanical properties of the hardened paste can be achieved by using polycarboxylate superplasticizers as dispersant. These findings suggest that the use of polycarboxylate superplasticizers in collaboration with ultrasonication is one of the most efficient methods for achieving improved mechanical properties of the hardened pastes. Improvement of the mechanical properties of the hardened paste is often taken to imply that the CNTs are well dispersed in CNT–OPC paste composites.7,13–15
Although these three approaches have increased understanding of the dispersion of CNTs, they all considered the OPC paste as a single-phase material (either water or paste fluid or hardened solids), which is inadequate to describe CNT distribution. Fresh OPC paste is a complex alkaline environment that contains various types of ions and particles. The particle size ranges from tens of nanometers to hundreds of micrometers. These particles account for a volume fraction about 40% (with water to cement ratio between 0.4 to 0.6).12 CNTs can only reside in the other 60% of the volume, that is filled with pore solutions.12 In other words, the distribution of CNTs is not uniform at sub-millimeter scale. This uneven distribution is a significant characteristic of the composite, especially when the microstructural modification effect of CNTs is considered.1 However, existing approaches are unable to characterize this uneven distribution of CNTs in such a complex system.
Due to the limitations in these existing approaches, the distribution in the OPC paste cannot be quantified. And there is limited proof in the literature indicating the amount of CNTs that can stay dispersed in either fresh or cured OPC paste. Therefore, the objective of the present study is to quantify and understand the distribution of CNTs in the fresh OPC paste using new approaches. Quantification of the distribution in fresh paste helps understand of the dispersion in the hardened pastes.
In the present work, for the first time, we considered the fresh OPC paste as a more realistic two-phase system consisting of a solid particle phase and a liquid solution phase. From this two-phase perspective, we suggest that the term “dispersion” can only be used to describe the CNT status in the liquid phase. The term “adsorption” is used here to describe the interaction between CNTs and solid phase (cement grains). The term “distribution” should be used to describe the status of CNTs in the fresh OPC paste system. We propose a new centrifuge-based approach to separate these two phases to allow quantitative investigation of the CNTs in each phase. As an outcome of this novel approach, the phenomenon of CNT adsorption on the solid particle phase of OPC was discovered. This adsorption phenomenon is likely due to electrostatic or van der Waals forces20 and has not been considered in any previous publications. The amount of adsorbed CNTs is described by a proposed parameter, the adsorption ratio.
In terms of the CNTs dispersion in the liquid phase, the novel approach effectively isolates the liquid solution in the fresh OPC–CNT paste. By characterizing this solution with UV-Vis spectrometry, the first quantification of CNT dispersion in the liquid phase of fresh OPC paste is obtained. Also, the time-dependent stability of CNT dispersion in the liquid phase is studied. The limit of the CNT dispersion prior to mixing with OPC is also investigated.
After quantification of the CNT dispersion and adsorption in these two phases, a conceptual model is proposed to describe the distribution of CNTs in fresh OPC pastes. This model can be used to refine earlier cracking bridging models21,22 and to develop microstructural and hydration models23–26 for CNT-OPC composites. It should be noted that other particulate matrixes such as ceramic and clay27,28 may display similar characteristics to those of OPC pastes, so that this model may be applicable to them.
2. Experimental program
2.1. Materials and instrumentation
Multi-walled CNTs (MWCNTs) were purchased from Nanocyl S.A., Sambreville, Belgium. According to the manufacturer's specifications29 the average diameter of the CNTs was 9.5 nm and the average length of the tubes was 1.5 μm. The product contained less than 5% metal oxide impurities and less than 4% of –COOH functional group. A commercial polycarboxylate-based surfactant containing particular types of polycarboxylate chains that could effectively disperse CNTs13 was used as the dispersing agent to improve dispersion of the CNTs in water. Type GP OPC, conforming to the requirements of Australian Standard AS 3972, was used in the adsorption test.Ultrasonication was applied using a Vibra-cell VCX 500 ultrasonicator from Sonics & Materials, Inc. with a net power output of 500 watt at 20 kHz. A Shimadzu UV 4800 UV-Vis photospectrometer was used to characterize the degree of CNT dispersion. A centrifuge 5702 from Eppendorf was used to centrifuge the fresh CNT–OPC pastes. The dried CNT suspension on silicon wafers was imaged using an FEI Nova NanoSEM™ 450 SEM with an electron diffraction X-ray (EDX) spectrometer.
2.2. Experimental process
One master-batch of CNT suspension was prepared by adding 2.6 wt% of MWCNTs and 10.6 wt% of the surfactant into distilled water. This surfactant-to-CNT ratio was determined by the authors' earlier work.14 CNT suspensions with different total CNT mass concentration (Ct) were obtained by diluting the master-batch with distilled water. Dilution factors of 1![[thin space (1/6-em)]](https://www.rsc.org/images/entities/char_2009.gif) :1, 1:5, 1:10, 1:20, 1:50, 1:100, and 1:1000 were used to make the Ct equal to 2.6 wt%, 0.26 wt%, 0.13 wt%, 0.053 wt%, 0.026 wt%, and 0.0026 wt%, respectively.
:1, 1:5, 1:10, 1:20, 1:50, 1:100, and 1:1000 were used to make the Ct equal to 2.6 wt%, 0.26 wt%, 0.13 wt%, 0.053 wt%, 0.026 wt%, and 0.0026 wt%, respectively.
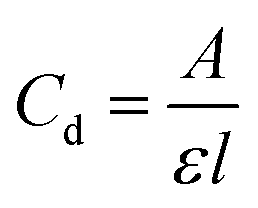
The CNT suspensions with different Ct were then ultrasonicated using the probe sonicator. The intensity and power output of the ultrasonicator were kept at 40% and 40 ± 3 W respectively. When sufficient ultrasonication energy was applied,14,21 the maximum dispersed CNT concentration (Cd) was achieved and the CNT suspensions were sampled for UV-Vis measurement. At least two samples were used in each UV-vis measurement and the coefficient of variation is found to be smaller than 3% (at 500 nm) indicating very consistent suspension of CNTs in the solution. Subsequently the ABS at 500 nm was selected to calculate Cd using the Beer–Lambert law given as:
 | (1) |
To test the stability of the CNT suspensions in alkaline environments, a simulated OPC pore solution was prepared with concentrations of the chemicals as shown in Table 1. This composition of the pore solution33 typically represents the concentration of Na+, K+, Ca2+, SO4−, and OH− ions in early-age (within about 8 hours) concrete.34 These ions were introduced into the CNT suspensions with different Ct by mixing the suspensions with the simulated pore solution. During mixing the ion concentration was chosen to be above 90% of the concentration in Table 1. ABSs of these CNT suspensions were then measured every hour until 17 h after mixing.
| Added compounds | Concentration (g L−1) |
|---|---|
| NaOH | 8 |
| KOH | 22.4 |
| CaSO4·2H2O | 27.6 |
| Ca(OH)2 | Sat. |
The suspension with Ct = 0.26 wt% was used to investigate the adsorption of CNTs on the surface of OPC grains. 2 mL of the suspension was injected into each Falcon centrifuge tube. Then, 0.1 g, 1 g, 2 g, and 4 g of OPC grains were thoroughly mixed with the suspension in four centrifuge tubes for 2 min using a spatula. After mixing, the CNT–OPC mixtures and the CNT suspension (without added OPC grains) were centrifuged with acceleration of 3000g (g = 9.8 m s−2) for 7.5 minutes. Upon centrifugation, the OPC particles settled to the bottom of the tubes and the CNT suspension was concentrated to form a supernatant as shown in Fig. 1. The UV-Vis spectrum of the supernatant was measured and Cd was calculated based on eqn (1). When x g of OPC grains was mixed with the CNT suspension and then centrifuged, the adsorption ratio of OPC grains was calculated by
 | (2) |
 | ||
| Fig. 1 CNT–OPC pastes after centrifugation: (a) 0.1 g and (b) 4 g OPC grains, respectively. The supernatant is the CNT suspension; the grey settlement at the bottom of the tubes is OPC grains. | ||
To examine the morphology of CNTs attached to the OPC grains, the supernatant in the centrifuge tubes was removed by rinsing with ethanol, and then 10 mL of ethanol was added into the tube and mixed with the OPC settlement using a spatula. Mixing with ethanol was essential in order to stop the hydration12 of the OPC grains so that the adsorbed CNTs would not be covered by hydration products and would be easily observed under SEM. The ethanol-rinsed particles were then filtered out using grade 1 filter paper. The residue on the filter paper was spread to dry on silicon wafers in a vacuum chamber. After drying in vacuum for 1 week, the residues were attached to carbon tapes and coated with around 2 nm of gold for SEM imaging and EDX spectroscopy measurement. The SEM operated at 5 kV during the imaging and 15 kV during EDX measurement.
3. Dispersion of CNTs in pore solutions
3.1. Dispersion limit of CNTs in aqueous environment
Concentration of dispersed CNTs (Cd) is one of the key factors that influence the reinforcing effect of CNTs. As addressed in the authors' previously proposed model,21 the reinforcing efficiency of CNTs is proportional to the amount of dispersed CNTs in the matrix. Therefore, a higher Cd is desirable for better reinforcing effect. It is well known, however, that CNTs tend to agglomerate in an aqueous environment,16–18,35,36 and consequently the Cd is not constantly equal to the dosage of CNTs (Ct) that is the mass ratio between the CNTs and the suspension. Fig. 2a presents the calculated Cd/Ct ratio using eqn (1) based on UV absorbance of CNT–water suspensions. The Cd/Ct ratio gives an indication of the degree of CNT dispersion in the suspension; a higher Cd/Ct ratio is desirable as it means that more CNTs are in the dispersed state. | ||
| Fig. 2 Change in degree of dispersion (Cd/Ct, (a)) and dispersed CNT concentration (Cd, (b)) with Ct. The dashed line in (a) shows Cd/Ct under the ideal dispersion condition for ε = 50.12 mL mg−1 cm. The dashed line in (b) indicates Cd =Ct. Insert in (b): zoomed-in view of (b) in the range Ct = 0–0.06. Error bar indicates 1 standard deviation. | ||
Fig. 2a shows that under the ideal dispersion condition, Cd/Ct should reach and stay at 1 when Ct is less than 0.26 wt%. Ct ≈ 0.13 wt% gives the optimal dispersion and Ct ≈ 0.26 wt% is the maximum dosage that can maintain a high degree of dispersion (>85%). When Ct is greater than 0.53 wt% the suspension begins to become saturated with CNTs and the dispersed state of CNTs becomes less energetically feasible.20 Therefore, Cd/Ct was decreased to less than 40%. In the cases of Ct < 0.05 wt%, the experimentally measured Cd/Ct dropped to 60–65%. The ideal dispersion, where Cd/Ct remains at 1 when Ct decreases from 0.13 wt%, was not achievable under the current experimental conditions because of the fixed surfactant-to-CNT ratio of 4, causing low concentration of the surfactants when Ct < 0.05. Consequently, more surfactant dissolved in the solvent as monomers rather than forming an assembly on the CNT surface at low concentration, thereby decreasing the dispersion efficacy of the surfactant.20,35,36 As demonstrated in Fig. 2a, the data scattering is very small for the UV measurements. Therefore, for clarity and better presentation, the error bars are not presented in Figure 2b, 3 and 4.
 | ||
| Fig. 3 (a) Stability of CNT dispersion in simulated OPC pore solution at different durations after mixing. (b) Determination of the transition point and rate of decrease of Cd/Ct. | ||
 | ||
| Fig. 4 Amount of CNTs adsorbed on cement grains vs. the weight of added OPC (Wc) and the cement-to-water ratio (c/w). | ||
Apart from the degree of dispersion (Cd/Ct ratio), the upper limit of Cd is another important parameter for the properties of the composite. Fig. 2b presents the monotonic change of Cd with Ct. The ideal dispersion case is when Cd = Ct (dashed line in Fig. 2b). It can be clearly seen that as Ct increased above 0.26 wt%, Cd gained more bias from the Cd = Ct curve, meaning that more CNT agglomerated. It is notable that at very low concentration, as shown in the insert in Fig. 2b, the Cd curve is also slightly biased away from the Cd = Ct curve, which may be due to the detachment of the surfactants. These results show that Cd could rise to around 0.83 wt% by increasing Ct to 2.6 wt%. The trend of the Cd curve also indicates that Cd may be increased further when Ct exceeds 2.6 wt%. However, using such high concentrations would introduce a fair amount of agglomerated CNTs, with possible detrimental effect on the engineering properties of the composite, for example, causing stress concentration.
3.2. Stability of CNTs in alkaline environment
The dispersion of the CNTs presented in Fig. 2 was very stable. For example, the Cd/Ct for CNT suspensions decreased by less than 5% after 2 weeks. In contrast, significant changes in Cd/Ct were observed after the simulated pore solution was added into the CNT suspensions. Fig. 3 shows the change in Cd/Ct for CNT suspensions with different Ct 18 hours after ultrasonication. It can be seen that Cd/Ct has a decreasing trend in general regardless of Ct. This suggests that the dispersion of CNTs in OPC pore solution is not stable in the long term. However, there is a transition point during the change of Cd/Ct as shown in Fig. 3a. Transition points can be readily identified by the gradient of the curves.As demonstrated in Fig. 3b, before the transition point, Cd/Ct decreases almost linearly at a low rate (0.7% per hour for Ct = 0.26 wt%), whereas after the transition point Cd/Ct decreases sharply in a nonlinear manner. The corresponding times for the transition points were measured for all the curves in Fig. 3a and listed in Table 2. Decreasing rates of Cd/Ct before the transition point were also obtained by linear regression (Table 2 column 4). It is found that the decreasing rate is affected by two factors. The primary factor is the initial degree of dispersion which increases the decreasing rate except for Ct = 0.26 wt%. Higher degree of dispersion indicates less CNTs are in agglomerated form which are, thermodynamically, more stable than the CNTs in dispersed form.37,38 Therefore, higher degree of dispersion with more dispersed CNTs increases the agglomeration rate based on Boltzmann distribution and law of mass action.20 The second factor is the abundancy of polycarboxylate surfactants in the suspension. Higher concentration of polycarboxylate surfactant enhances the steric repulsion37 and stability of suspension in alkaline environment.37,38 This is the reason for the lower decrease rate of Ct = 0.26 wt% compared with Ct = 0.053 wt% since Ct = 0.26 wt% has 5 times higher concentration of polycarboxylate surfactant than Ct = 0.053 wt%. Because the rates of decrease of all the suspensions were found to be very low, with the maximum of 1.9 percent per hour, the suspension before the transition point could be treated as stable from a practical point of view. The transition points were found to be greater than at least 4 hours in the range of Ct from 0.026 wt% to 2.6 wt%. OPC pastes normally set within approximately 3–4 hours, and therefore short-term stability of CNT suspension within an alkaline environment (before the transition point) is sufficient to maintain good dispersion of CNTs in hardened OPC pastes and to avoid re-agglomeration of the CNTs.
| Cd/Ct | Total CNT concentration (Ct, wt%) | Transition point (h) | Rate of decrease of Cd/Ct (% per h) |
|---|---|---|---|
| 0.28 | 2.6 | 16 | 0.2 |
| 0.58 | 0.026 | 8 | 0.5 |
| 0.85 | 0.053 | 6 | 1.6 |
| 0.85 | 0.26 | 7 | 0.7 |
| 0.93 | 0.13 | 4 | 1.9 |
The mechanism behind the transition point is complex. Former studies in flocculation processes in colloid systems containing fibrous particles have also suggested a two-stage flocculation process.39 The existence of the transition point is related to the agglomeration process of CNTs in the pore environment of OPC pastes. Prior to the transition point, the CNTs tend to form one-dimensional bundles, each of which contains several parallel CNTs, but after the transition point these bundles further agglomerate into three-dimensional mesh or cage-like large agglomerates. A detailed explanation with the assistance of molecular dynamics simulations can be found elsewhere.40
4. Adsorption of CNTs on OPC grains
When mixed within OPC pastes, CNTs adsorb on cement grains due to van der Waals or electrostatic forces, as well as dispersing in pore solutions as discussed in Section 3. The amount of CNTs adsorbed by OPC grains was measured and is shown in Fig. 4.It can be seen that the CNT adsorption ratio, defined as the amount of CNTs adsorbed per gram of OPC grains, decreased with the cement-to-water ratio (c/w). If a relatively small quantity of OPC (Wc = 0.1 g, c/w = 0.05) was added into the CNT suspension with Ct = 0.26 wt%, around 2.7 mg of CNTs was adsorbed by 1 g of OPC grains. When c/w rose to 2, the adsorption ratio reduced significantly to 0.51 mg g−1. Adding more OPC grains into the suspensions when c/w > 1 produced no noticeable change in the adsorption ratios with c/w = 2 (or w/c = 0.5, which is commonly used in cement and concrete composites).
SEM images were also taken of OPC pastes with different c/w ratios, as shown in Fig. 5. The CNT concentration was fixed at 0.26 wt%. Two interesting observations can be made. First, CNT adsorption on OPC grains was selective and preferential to smaller grains (the areas within the yellow dashed lines in Fig. 5a and b). Second, a thick layer of heavily agglomerated CNTs covered the surface of these small OPC grains (Fig. 5a and b) when the amount of added OPC was small (c/w = 0.005 or w/c = 200). As shown in Fig. 5c and d, when c/w = 2 (or w/c = 0.5), no significantly layer-like agglomeration of CNTs is observed; instead, the CNTs scatter on the OPC grain surfaces. This reduction in the adsorption ratio and layer thickness of CNTs was attributable to the larger surface area of these small OPC grains as well as the more limited space for CNTs to travel during the adsorption process when the cement-to-water ratio increased.
 | ||
| Fig. 5 SEM images of OPC particles and CNTs adsorbed on OPC particles. (a & b) with 0.1 gram of OPC and (c & d) with 4 grams of OPC in CNT suspension with Ct = 0.26 wt%. | ||
To understand why CNTs preferred smaller OPC grains, the geometry and chemical composition of these OPC grains were examined. The size of these adsorptive OPC grains was measured based on about 20 SEM images. The particle size distribution of these OPC grains is plotted in Fig. 6. The measurement shows that about 98% of the adsorptive particles were smaller than 4 ± 0.5 μm (the longest dimension). The major components of OPC grains within this size range were most likely alite or gypsum.12
 | ||
| Fig. 6 Particle size distribution of the adsorptive OPC particles. The particle dimension measured is the longest dimension of the particle. | ||
Fig. 7 shows typical EDX spectra of small (adsorptive) and large (non-adsorptive) OPC grains. Calcium, silica, aluminum and oxygen are detected on both type of grain. Since no sulfur is observed on the spectrum, it is inferred that neither type of grain is likely to be gypsum (Ca2SO4), which is a common retarder added into OPC to extend the setting time of OPC pastes.12 Clearly, a very high carbon peak in the adsorptive (or small) grains was caused by the adsorbed CNTs. Another distinction between the two type of grain is that a much more significant peak of calcium is present for the non-adsorptive (or large) grains. This indicates that the non-adsorptive grains are likely to have a higher Ca/Si ratio than the adsorptive ones. Past research has shown that hydration products have lower Ca/Si ratios (1.6–1.9)41 than unhydrated cement particles, that are primarily composed of alite and belite with Ca/Si ratio of 3 and 2, respectively.42 Furthermore, smaller OPC grains have been found to possess less belite than larger grains.42 Therefore, it was inferred that the smaller (or adsorptive) particles contained a higher fraction of hydration products and less belite.
 | ||
| Fig. 7 Typical EDX spectra for (a) small particles wrapped by CNTs and (b) larger particles without CNTs. | ||
The reasons why CNTs tended to adsorb on smaller OPC grains can be inferred from the results in Fig. 5–7. First of all, the smaller OPC grains (with high fraction of alite) were more active for hydration during the initial hydration reaction,12 leading to more hydration products on them. These hydration products could bond the –COOH group onto the CNT surface.8 The nucleation effect of the CNTs7 may also stimulate the growth of hydration products on CNTs near the small OPC grains, causing the CNTs to be precipitated on the OPC grains. Moreover, the geometry of CNTs also contributed to the adsorption on smaller OPC grains. The CNT length was comparable to that of the small adsorptive OPC grains, resulting in a flocculation effect39 where the CNT entrapped small OPC grains in the suspension.
5. Distribution of CNTs in OPC pastes
As shown on Fig. 8, at sub-millimeter scale, CNT distribution was not uniform in the fresh OPC pastes. Around 40% of the space was occupied by OPC grains at a common w/c between 0.4 and 0.6 (ref. 12), which would result in some CNT-free zones within hardened OPC pastes, that had been occupied by OPC grains in the fresh pastes. Acknowledgment of this nonuniformity of CNT distribution is critical to the understanding and modelling of hydration, reinforcing effects, and thermal and electrical conductivity of the CNT–OPC composite.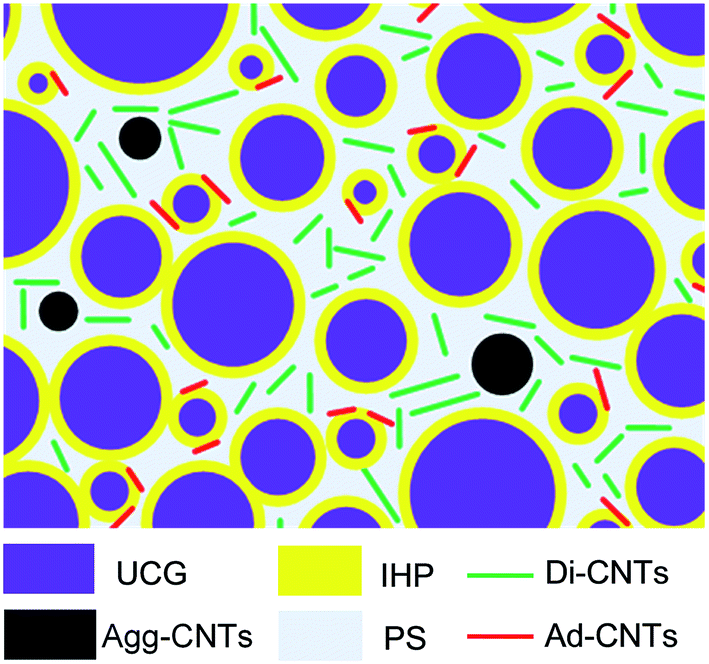 | ||
| Fig. 8 Schematic of the distribution of CNTs in fresh OPC matrix. UCG: unhydrated OPC grains; IHP: hydration product formed during initial hydration; Di-CNTs: dispersed CNTs; Agg-CNTs: agglomerated CNTs; PS: OPC pore solution; Ad-CNTs: CNTs adsorbed on small OPC particles. | ||
From the discussion in Sections 3 and 4, CNTs appeared to have three states in fresh OPC pastes, as shown in Fig. 8, namely the agglomerated state (black), the dispersed state (green), and the adsorbed state (red). Obviously, the heavily agglomerated CNTs had a low aspect ratio and therefore made negligible contribution to the reinforcing effect21 although they could still act as fillers affecting the hydration and workability of CNT–OPC.14 The amount of agglomerated CNTs can be estimated from Fig. 2. If Ct is at the optimum value of 0.26 wt%, the amount of agglomerated CNTs is less than 2% (calculated from (Ct − Cd)/Ct) of Ct (Fig. 2)).
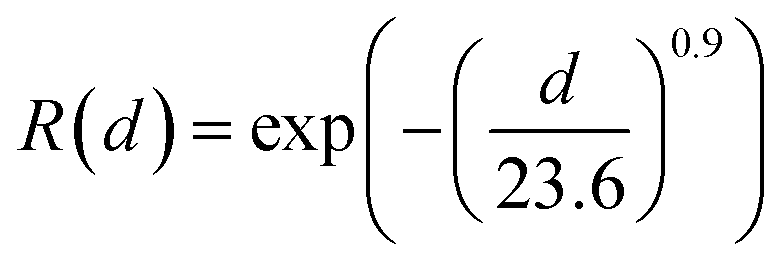
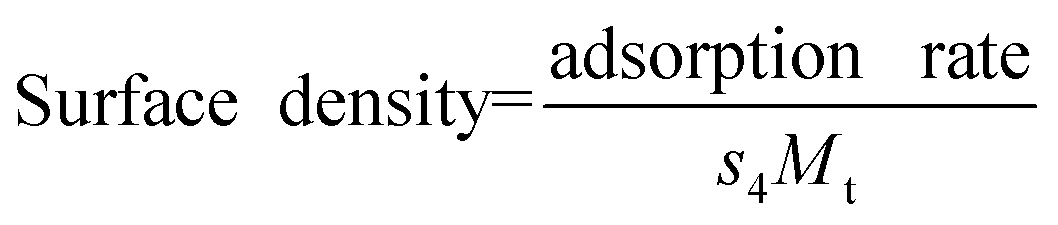
For a common mix of fresh OPC pastes with w/c ratio of 0.5, the amount of adsorbed CNTs was calculated to be 33% of the Ct in the CNTs suspension with Ct = 0.26 wt%. The dispersed CNTs accounted for the remainder (around 65 wt%) of the Ct after mixing with OPC. As shown in Fig. 5c and d, with a w/c ratio of 0.5, the adsorbed CNTs do not appear to form dense and thick agglomerations. For further understanding of the effect of the adsorbed CNTs, the surface density of the adsorbed CNTs, which is the number of CNTs attached per unit area of adsorptive OPC grain surface, was estimated using a spherical shape model.12,43 The typical particle size distribution function of OPC grains is given by
 | (3) |
 | (4) |
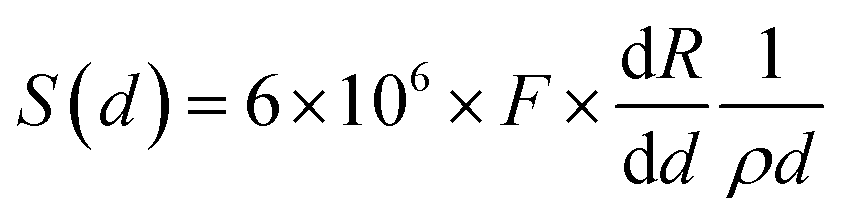
The total surface area of the OPC grains with diameter less than 4 μm (s4) was calculated as 0.28 m2 g−1 using
 | (5) |
Assuming that CNTs are cylinders, the mass of a single multi-walled CNT could be calculated as
 | (6) |
The surface density of CNTs was calculated as
 | (7) |
For the case of c/w = 20 and 2 (with adsorption ratios of 2.5 and 0.44 mg g−1 respectively), the surface density was found to be 28–56 and 5–10 tubes per μm2, respectively. These calculated surface densities coincided with the SEM observation in Fig. 5, which also proved that the reduction of Cd in paste was mainly due to adsorption rather than agglomeration.
For the common OPC mix with c/w = 2 (or w/c = 0.5), the surface density of 5–10 tubes per μm2 corresponded to a thin layer of scattered CNTs on small OPC grains (Fig. 5c and d). However, this surface density was still far higher than the projected surface density of dispersed CNTs that was obtained by evenly splitting the number of CNTs in a 1 μm cubic space into its 6 facets as 65% Ct/Mt 6 = 0.8–1.8 tubes per μm2. It is suggested here that the adsorbed CNTs distributed more densely than the dispersed CNTs but less densely than the CNT agglomerates. The distribution model of CNTs within OPC pastes is meaningful for understanding of the role of CNTs with regard to reinforcement.14,21 Moreover, it is vital for simulating hydration reactions in OPC23–25 as it allows establishment of the initial particle packing model for fresh paste.
The quantification of CNT adsorption and dispersion in the fresh OPC paste also gives indications on the distribution of CNTs in hardened OPC paste. Due to the strong attraction between CNT and adsorptive OPC grains,20 the adsorbed CNTs is likely to stay on the OPC grains during hydration. Based on Section 3.2, the dispersed CNTs in the pore solutions may stay dispersed for a few hours if undisturbed. Considering the hydration products may grow on the CNTs19 during hydration reaction, these hydration products separate individual CNTs and help resisting the agglomeration of CNTs.
The authors' previous study14 on cured OPC paste indicates that adding 0.08 wt% (of cement powder) of CNTs into OPC paste significantly increases the flexural strength and fracture energy of the composite for more than 50% while more than 1 wt% of traditional fibers46 is require to achieve such improvements. This is in agreement with the superior reinforcing potential of CNTs suggested by the crack bridging models.21,22 The reinforcing effect was found to be proportional with Ct when Ct is increase from 0.09 wt% to 0.19 wt%.14 This proportional relationship only exists when most of the CNTs are effectively separated in the cured matrix as suggested by the authors' crack bridging model for CNTs.21 These reinforcing effects on cured paste agrees with distribution of CNTs shown in this study where most (above 90 wt%) of the CNTs can stay in pore water or attached to small cement particles that contributes to the separation of CNTs in cured paste. Coinciding with the fiber crack-bridging theories,21,22 these results show the linear relationship between amount of separated CNTs in fresh paste and the reinforcing effect of CNTs in cured paste.
It should be noted that OPC pastes are very complex mixtures in nature. The conceptual model for typical fresh CNT–OPC paste proposed herein represents the very early stage of the composite mixture. At this early stage, the paste is assumed to be in two phases, the liquid phase with dispersed CNTs and the solid phase with dispersed CNTs. The experimental techniques developed in this study are also applicable to other CNT–OPC paste fabrication schemes involving different types of cement, CNT, or surfactants.
6. Conclusions
To resolve the question regarding the maximum amount of CNTs that can be dispersed in fresh pastes, a two-step investigation was conducted. The first step determined the maximum Cd in CNT–water suspension before mixing with cement. It was found that the Cd kept increasing with Ct to 0.84 wt% when Ct = 2.6 wt%. However, the degree of dispersion Cd/Ct dropped sharply to less than 50% when Ct exceeded 0.26 wt%, resulting in a significant amount of CNT agglomeration. It is suggested, therefore, that the upper limit for economical and effective use of CNTs is Ct = 0.26 wt% with a Cd/Ct around 90%. The second step was to examine the stability of the CNT dispersions with different Ct in a simulated pore solution that represented the concentration of most ions in fresh OPC pastes. The results showed that the decrease in Cd/Ct for different Ct was less than 2% per hour for at least 4 hours, indicating that the suspensions were stable within the common setting time of OPC pastes. After 4–16 hours, however, the suspensions transited into an unstable state and Cd/Ct began to decrease drastically.In terms of CNT distribution in cement paste, there are two major findings in this study. Firstly, the existence of CNT-free zones in the CNT–OPC composite was addressed here in CNT distribution models, where the CNT-free zones were caused by unhydrated grains in the fresh OPC paste. Secondly, the adsorption effect of the OPC grains was proposed and quantified based on an innovative centrifuge-based technique. It was observed that for common w/c ratios, about 0.44 mg of CNT was adsorbed by 1 g of cement. This observation was quantified by SEM imaging demonstrating that only non-gypsum OPC grains <4 μm in size could adsorb the CNTs, due to the formation of hydration reaction products around these small OPC grains.
Combining these findings, a conceptual distribution model for CNTs in OPC is proposed. The model provides a quantification of the amount of dispersed, agglomerated, and adsorbed CNTs in the matrix. The surface density of the adsorbed CNTs is also calculated as 6–11 CNTs per square micrometer. This model can serve as a starting point for establishing or refining models depicting the effect of CNTs on reinforcement and hydration in CNT-OPC composites.
Acknowledgements
The authors are grateful for the financial support of the Australian Research Council in conducting this study. The authors acknowledge the use of facilities within the Monash Centre for Electron Microscopy.References
- G. Y. Li, P. M. Wang and X. H. Zhao, Carbon, 2005, 43, 1239–1245 CrossRef.
- A. Cwirzen, in Multi-Functional Materials and Structures Iii, Pts 1 and 2, 2010, vol. 123–125, pp. 639–642 Search PubMed.
- M. S. Konsta-Gdoutos, Z. S. Metaxa and S. P. Shah, Cem. Concr. Compos., 2010, 32, 110–115 CrossRef.
- J. Luo, Z. Duan, T. Zhao and Q. Li, Adv. Mater. Res., 2011, 146, 581–584 Search PubMed.
- S. Musso, J.-M. Tulliani, G. Ferro and A. Tagliaferro, Compos. Sci. Technol., 2009, 69, 1985–1990 CrossRef CAS.
- K. Wille and K. Loh, J. Transp. Res. Board, 2010, 2142, 119–126 CrossRef.
- S. Chen, F. Collins, A. Macleod, Z. Pan, W. Duan and C. Wang, The IES Journal Part A: Civil & Structural Engineering, 2011, 4, 254–265 Search PubMed.
- G. Y. Li, P. M. Wang and X. Zhao, Carbon, 2005, 43, 1239–1245 CrossRef CAS.
- S. Wansom, N. Kidner, L. Woo and T. Mason, Cem. Concr. Compos., 2006, 28, 509–519 CrossRef CAS.
- G. Y. Li, P. M. Wang and X. Zhao, Cem. Concr. Compos., 2007, 29, 377–382 CrossRef CAS.
- Y. Xun and K. Eil, Smart Mater. Struct., 2009, 18, 055010 CrossRef.
- H. F. Taylor, Cement chemistry, Thomas Telford, 1997 Search PubMed.
- F. Collins, J. Lambert and W. H. Duan, Cem. Concr. Compos., 2012, 34, 201–207 CrossRef CAS.
- B. Zou, S. J. Chen, A. H. Korayem, F. Collins, C. Wang and W. H. Duan, Carbon, 2015, 77, 1–10 Search PubMed.
- M. S. Konsta-Gdoutos, Z. S. Metaxa and S. P. Shah, Cem. Concr. Res., 2010, 40, 1052–1059 CrossRef CAS.
- J. U. Lee, J. Huh, K. H. Kim, C. Park and W. H. Jo, Carbon, 2007, 45, 1051–1057 CrossRef CAS.
- M. Zhang, L. Su and L. Mao, Carbon, 2006, 44, 276–283 CrossRef CAS.
- B. Krause, G. Petzold, S. Pegel and P. Pötschke, Carbon, 2009, 47, 602–612 CrossRef CAS.
- J. M. Makar and G. W. Chan, J. Am. Ceram. Soc., 2009, 92, 1303–1310 CrossRef CAS.
- J. N. Israelachvili, Intermolecular and surface forces: revised third edition, Academic press, 2011 Search PubMed.
- S. J. Chen, B. Zou, F. Collins, X. L. Zhao, M. Majumber and W. H. Duan, Carbon, 2014, 77, 1–10 CrossRef CAS.
- V. C. Li, J. Mater. Civ. Eng., 1992, 4, 41–57 CrossRef.
- G. Ye, Experimental study and numerical simulation of the development of the microstructure and permeability of cementitious materials, TU Delft, Delft University of Technology, 2003 Search PubMed.
- O. Bernard, F.-J. Ulm and E. Lemarchand, Cem. Concr. Res., 2003, 33, 1293–1309 CrossRef CAS.
- E. Garboczi and D. Bentz, Cem. Concr. Res., 2001, 31, 1501–1514 CrossRef CAS.
- G. Ye, P. Lura and V. K. van Breugel, Mater. Struct., 2006, 39, 877–885 CrossRef CAS.
- A. A. White, S. M. Best and I. A. Kinloch, Int. J. Appl. Ceram. Technol., 2007, 4, 1–13 CrossRef CAS.
- H. H. Lee, U. Sang Shin, J. H. Lee and H. W. Kim, J. Biomed. Mater. Res., Part B, 2011, 98, 246–254 CrossRef PubMed.
- Nanocyl, NANOCYL™ NC3100 series – Product Datasheet – Thin Multi-Wall Carbon Nanotubes, Nanocyl S. A., Sambreville, Belgium, 2009 Search PubMed.
- Z. Li, G. Luo, W. Zhou, F. Wei, R. Xiang and Y. Liu, Nanotechnology, 2006, 17, 3692 CrossRef CAS.
- M. D. Clark and R. Krishnamoorti, J. Phys. Chem. C, 2009, 113, 20861–20868 CAS.
- D. Baskaran, J. W. Mays and M. S. Bratcher, Chem. Mater., 2005, 17, 3389–3397 CrossRef CAS.
- P. Ghods, O. Isgor, G. McRae and T. Miller, Cem. Concr. Compos., 2009, 31, 2–11 CrossRef CAS.
- F. Rajabipour, G. Sant and J. Weiss, Cem. Concr. Res., 2008, 38, 606–615 CrossRef CAS.
- A. J. Blanch, C. E. Lenehan and J. S. Quinton, J. Phys. Chem. B, 2010, 114, 9805–9811 CrossRef CAS PubMed.
- A. J. Blanch, C. E. Lenehan and J. S. Quinton, Carbon, 2011, 49, 5213–5228 CrossRef CAS.
- C.-Z. Li, N.-Q. Feng and R.-J. Chen, Cem. Concr. Res., 2005, 35, 867–873 CrossRef CAS.
- T. Nawa, J. Adv. Concr. Technol., 2006, 4, 225–232 CrossRef CAS.
- J. Buffle and G. Leppard, Environ. Sci. Technol., 1995, 29, 2169–2175 CrossRef PubMed.
- S. J. Chen, B. Zou, F. Collins, X. L. Zhao, M. Majumber, C. M. Wang and W. H. Duan, 2016, under review.
- I. Richardson and G. Groves, J. Mater. Sci., 1993, 28, 265–277 CrossRef CAS.
- M. Gougar, B. Scheetz and D. Roy, Waste Manag., 1996, 16, 295–303 CrossRef CAS.
- J. Sanahuja, L. Dormieux and G. Chanvillard, Cem. Concr. Res., 2007, 37, 1427–1439 CrossRef CAS.
- B. Osbaeck and V. Johansen, J. Am. Ceram. Soc., 1989, 72, 197–201 CrossRef CAS.
- Y. J. Hwang, Y. C. Ahn, H. S. Shin, C. G. Lee, G. T. Kim, H. S. Park and J. K. Lee, Curr. Appl. Phys., 2006, 6, 1068–1071 CrossRef.
- A. Bentur and S. Mindess, Fibre reinforced cementitious composites, CRC Press, 2006 Search PubMed.
Footnote |
| † Electronic supplementary information (ESI) available. See DOI: 10.1039/c5ra13511g |
| This journal is © The Royal Society of Chemistry 2016 |