
A highly flexible and conductive graphene-wrapped carbon nanofiber membrane for high-performance electrocatalytic applications†
Yunpeng
Huang
a,
Longsheng
Zhang
a,
Hengyi
Lu
a,
Feili
Lai
a,
Yue-E
Miao
*b and
Tianxi
Liu
*ab
aState Key Laboratory of Molecular Engineering of Polymers, Department of Macromolecular Science, Fudan University, Shanghai, 200433, P. R. China. E-mail: txliu@fudan.edu.cn
bState Key Laboratory for Modification of Chemical Fibers and Polymer Materials, College of Materials Science and Engineering, Donghua University, Shanghai 201620, P. R. China. E-mail: yuee_miao@dhu.edu.cn
First published on 30th May 2016
Abstract
The integration of conventional carbonaceous materials with advanced two-dimensional graphene is a challenging but worthwhile attempt to introduce innovative properties into new composites. Herein, we report a novel and facile strategy to create graphene wrapped electrospun carbon nanofiber (GwC) membranes through the surface-induced assembly of graphene oxide (GO) on the surface of pre-oxidized electrospun PAN (oPAN) nanofibers and subsequent carbonization. Driven by the hydrogen bonding between oxygen-containing groups of GO and tertiary amino groups of oPAN, GwC composite membranes with significantly reinforced electrical conductivity are obtained in which every single oPAN fiber is tightly and evenly wrapped by graphene sheets. Additionally, the GwC membrane is further considered as a free-standing template for an in situ growth of few-layered MoSe2 nanosheets. Compared with the graphene-free counterparts, GwC–MoSe2 composites exhibit a superior electrochemical hydrogen evolution reaction (HER) performance in both acidic and alkaline solutions due to the highly conductive GwC backbone, thus endowing the newly designed GwC membranes with various possibilities for applications in energy-related fields.
Introduction
Graphene, a single layer sp2-bonded carbon sheet with a hexagonal packed lattice structure, has attracted the most intensive attention since its discovery in 2004.1 This is mainly due to its genuine advantages over other carbon materials, such as a high Young's modulus (∼1 TPa), the quantum hall effect (QHE), high carrier mobility at room temperature (∼10![[thin space (1/6-em)]](https://www.rsc.org/images/entities/char_2009.gif) 000 cm2 V−1 s−1), large theoretical specific surface area (2630 m2 g−1), good optical transparency (∼97.7%) and excellent thermal conductivity (3000–5000 W m−1 K−1).2,3 Such characteristics make graphene and its composites highly desirable for many potential applications in Li-ion batteries,4,5 supercapacitors,6,7 photovoltaic devices,8 sensors,9 catalysts,10,11 and so on. Particularly, novel electrochemically active catalysts for a hydrogen evolution reaction (HER) can be synthesized utilizing graphene as a conductive support, attributing to its high surface area and strong electrical coupling effects with other HER active materials, e.g. layered transition metal dichalcogenides (LTMD) including MoS2, MoSe2, WS2 and WSe2.12–15 However, most of the graphene-based composites produced via hydrothermal reactions, a widely employed hybridizing method, inevitably suffer from easy aggregation and poor dispersion. Besides, the powdery state of conventional graphene-based composites even severely hinders their potential applications in flexible and all-solid-state electronic devices.
000 cm2 V−1 s−1), large theoretical specific surface area (2630 m2 g−1), good optical transparency (∼97.7%) and excellent thermal conductivity (3000–5000 W m−1 K−1).2,3 Such characteristics make graphene and its composites highly desirable for many potential applications in Li-ion batteries,4,5 supercapacitors,6,7 photovoltaic devices,8 sensors,9 catalysts,10,11 and so on. Particularly, novel electrochemically active catalysts for a hydrogen evolution reaction (HER) can be synthesized utilizing graphene as a conductive support, attributing to its high surface area and strong electrical coupling effects with other HER active materials, e.g. layered transition metal dichalcogenides (LTMD) including MoS2, MoSe2, WS2 and WSe2.12–15 However, most of the graphene-based composites produced via hydrothermal reactions, a widely employed hybridizing method, inevitably suffer from easy aggregation and poor dispersion. Besides, the powdery state of conventional graphene-based composites even severely hinders their potential applications in flexible and all-solid-state electronic devices.
Electrospinning is a relatively simple and low-cost strategy to produce continuous polymer nanofibers with a diameter from tens of nanometers to several microns.16–19 Carbon nanofiber (CNF) membranes prepared via carbonization of the precursor polymer nanofiber membranes,20,21e.g. polyacrylonitrile (PAN) and polyimide (PI), have been widely employed in applications such as batteries,22–25 electrochemical capacitors,26,27 fuel cells,28,29 sensors,30 catalysts,31,32 and even wearable and portable power sources,33,34 owing to their high mechanical strength, electrical conductivity, chemical stability and flexibility. Currently, most of the as-spun PAN nanofibers are stabilized at 250–300 °C in air and carbonized at 600–1100 °C under an inert atmosphere to obtain carbon nanofibers, which are hardly comparable with the commercial ones graphitized at the temperature up to 2800 °C, in consideration of strength and electrical conductivity.35 Excitingly, embedding graphene or carbon nanotubes (CNTs) in electrospun CNFs is greatly beneficial to increase the electrical conductivity.36,37 Nevertheless, the improvement is confined to a certain degree due to the limited loading efficiency of incompatible conductive additives in the precursor polymer solutions for stable electrospinning processes.
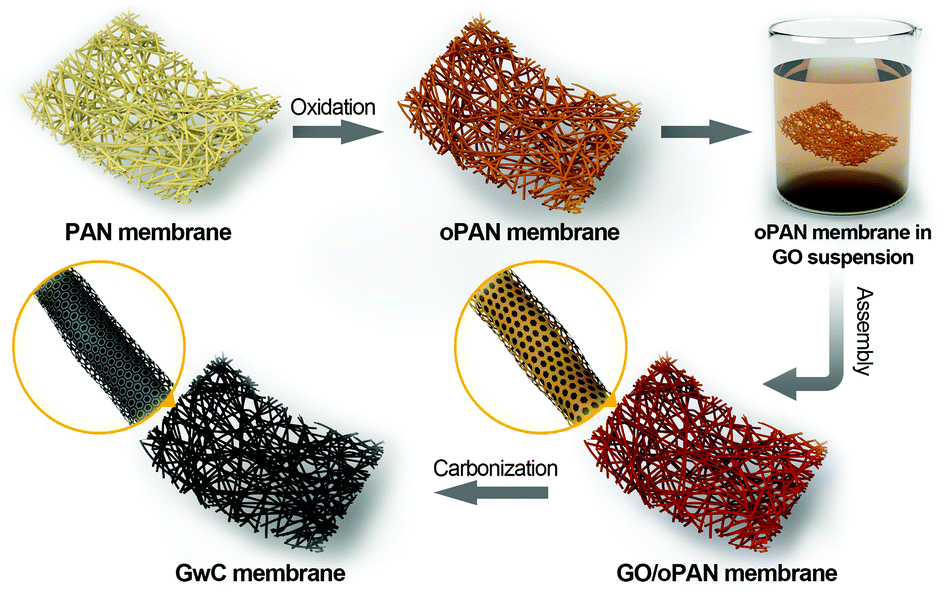
Herein, a versatile surface-induced assembly method combined with subsequent carbonization is employed for successful fabrication of graphene-wrapped carbon nanofiber (GwC) membranes, in which one-dimensional (1D) CNF is evenly wrapped by two-dimensional (2D) graphene sheets through the hydrogen bonding between graphene oxide and pre-oxidized PAN (oPAN) nanofibers (Scheme 1). The unique combination incorporates the merits of electrically conductive graphene sheets and self-standing electrospun membranes, which largely enhances the conductivity of CNF membranes without sacrificing the high flexibility and mechanical strength, and simultaneously resolves the entanglement and aggregation problems of graphene sheets. Remarkably, a few-layered MoSe2 nanosheet anchored GwC membrane exhibits superior catalytic activity towards HER with respect to MoSe2 nanosheets decorated CNF in both acidic and alkaline solutions, demonstrating that graphene-wrapping plays an essential role in improving the electrical conductivity of self-standing GwC membranes.
 | ||
| Scheme 1 Schematic illustration of the preparation of GwC nanofibrous membranes. | ||
Experimental
Materials
Polyacrylonitrile (PAN, Mw = 150000 g mol−1) was purchased from Sigma-Aldrich. Natural graphite powder (325 meshes) was obtained from Alfa-Aesar. Selenium powder (Se, 99.99%), Na2MoO4 (99.99%), hydrazine hydrate (N2H4·H2O, 50 wt% in water), N,N-dimethylformamide (DMF), ethanol, 98% H2SO4, 30% H2O2, KMnO4, NaNO3, and 37% HCl were provided by Sinopharm Chemical Reagent Co. Ltd. All aqueous solutions were prepared with doubly distilled (DI) water.
Fabrication of free-standing GwC membranes
The synthesis process of GwC membranes is schematically shown in Scheme 1. PAN nanofibrous membranes with controlled thicknesses were first prepared through a reciprocating single-nozzle electrospinning technique using a commercial electrospinning system (UCALERY Beijing Co., Ltd, China). Typically, a homogeneous solution containing 0.1 g mL−1 PAN was prepared by dissolving PAN powder into DMF under magnetic stirring at 80 °C for 5 h. The freshly obtained precursor solution was then loaded into a 5 mL plastic syringe and injected with a feeding rate of 0.3 mm min−1 through a No. 21 stainless steel needle connected to a high-voltage DC power supply. A rotating aluminum drum was set as the collector with a distance of 15 cm to the needle tip. After 30 min electrospinning under a fixed voltage of 20 kV, PAN nanofibrous membranes were deposited on the aluminum drum. After a 12 h vacuum drying to remove any residual solvents, PAN membranes were then pre-oxidized in air atmosphere at 250 °C for 2 h with a heating rate of 1 °C min−1.Graphite oxide was synthesized by the Hummers method38 and exfoliated to give a brown dispersion of graphene oxide (GO) under ultrasonication. Then, the tailored oPAN membranes (2 × 3 cm2) were immersed in the GO suspension (2 mg mL−1) at room temperature. After 48 h of soaking to ensure sufficient contact and interactions between GO sheets and oPAN nanofibers, the resulting GO/oPAN membranes were rinsed with absolute ethanol to remove residual GO and water. Finally, the dried GO/oPAN membranes were carbonized in a 900 °C tube furnace for 1 h to yield the self-standing GwC membranes.
Synthesis of GwC–MoSe2 composites
MoSe2 nanosheets were grown on GwC membranes via a simple solvothermal method according to our previous report.39 Briefly, a 6 mg mL−1 Se solution was first prepared in a flask by adding a certain amount of Se powder into N2H4·H2O. The colorless solution soon turned dark brown after 1 h of magnetic stirring at 80 °C in an oil bath. In a 40 mL teflon-lined autoclave, the vertically placed GwC membrane (10 mg) was immersed in 10 mL of DMF solution containing a stoichiometric amount of Na2MoO4. Then, 10 mL of Se solution was added dropwise into the above solution with a final Mo:Se molar ratio of 1:2. Afterwards, the mixture was heated at 180 °C for 12 h to grow MoSe2 on GwC membranes. After rinsing and drying, the GwC–MoSe2 composite was annealed in N2 at 450 °C for 2 h with a ramp rate of 5 °C min−1 to yield a crystalized GwC–MoSe2 composite. Different concentrations of Se solution (1 mg mL−1, 3 mg mL−1 and 6 mg mL−1) were prepared to adjust the loading amount of MoSe2, with the corresponding products denoted as GwC–MoSe2-1, GwC–MoSe2-3 and GwC–MoSe2-6, respectively. For comparison, MoSe2 loaded CNF (denoted as CNF–MoSe2) membranes and pure MoSe2 were also produced via the above method.
Characterization
Morphology of the samples was investigated using a field emission scanning electron microscope (FESEM, Zeiss) at an acceleration voltage of 5 kV. Transmission electron microscopy (TEM) was performed under an acceleration voltage of 200 kV with a Tecnai G2 20 TWIN TEM. Fourier transform infrared spectra (FT-IR) were recorded on a Nicolet 6700 FT-IR spectrometer. X-ray diffraction (XRD) experiments were conducted from 2θ = 10° to 80° on an X'Pert Pro X-ray diffractometer with CuKα radiation (λ = 0.1542 nm) with a voltage of 40 kV and a current of 40 mA. X-ray photoelectron spectroscopy (XPS) analyses were made with an RBD upgraded PHI-5000C ESCA system (Perkin Elmer) with K (1486.6 eV) as an X-ray source. All XPS spectra were corrected using a C 1s line at 284.6 eV. Curve fitting and background subtraction were accomplished using XPS PEAK41 software. The water contact angles were measured using an automatic video contact-angle testing apparatus (Model OCA 40, Dataphysics). The electrical conductivity of the samples was determined using a Keithley 4200 semi-conductor system at room temperature.Electrochemical measurements
All electrochemical measurements were conducted with a CHI 660D electrochemical workstation (Chenhua instrument Co., Shanghai, China) at room temperature. The electrochemical HER tests of the GwC–MoSe2 composite were performed in an electrolyte solution of 0.5 M H2SO4 and 1.0 M KOH, respectively. A graphite rod and a saturated calomel electrode (SCE) were used as the counter electrode and the reference electrode, respectively. The working electrode was prepared by pasting a small piece of a GwC–MoSe2 membrane (3 mm in diameter) onto the polished glassy carbon electrode (GCE) using 5 μL of Nafion solution (5 wt% in ethanol). Pure MoSe2 modified GCE was prepared via dropping 10 μL of MoSe2 slurry (1 mg mL−1 in DI water) onto GCE and left to dry. Linear sweep voltammetry (LSV) measurements were conducted with a scan rate of 5 mV s−1. In all measurements, the SCE reference electrode was calibrated with respect to the reversible hydrogen electrode (RHE) according to E(RHE) = E(SCE) + 0.281 V (in 0.5 M H2SO4), and E(RHE) = E(SCE) + 1.068 V (in 1.0 M KOH). Electrochemical impedance spectroscopy (EIS) was recorded in the frequency ranging from 0.01 Hz to 100 kHz at an amplitude of 5 mV under operating conditions (i.e., at a cathodic bias that drives rapid hydrogen evolution) according to the literature,40 and in our work the initial electric potential was set as −0.3 V vs. RHE for direct comparison. The onset potential was determined based on the beginning of the linear region in the Tafel plot without iR compensation being applied for all the electrochemical measurements.Results and discussion
Surface-induced assembly of GwC membranes
Pre-oxidized PAN membranes, rather than the as-spun PAN membranes, are intentionally used to prepare GwC membranes based on the considerations that the pre-oxidation process will introduce tertiary amino groups onto oPAN chains, which can efficiently form hydrogen bonds with carboxyl groups and hydroxyl groups on the edge and surface of GO sheets, thus realizing the assembly of GO sheets on oPAN nanofibers. As shown in Fig. S1,† the contact angle of the PAN membrane decreases from 117° to 33° after the pre-oxidation treatment, indicating a great improvement in hydrophilicity of the oPAN membrane. To yield a high-strength and stable CNF membrane, pre-oxidation is also indispensable to convert the linear PAN chains into aromatic ladder structures, thus rendering oPAN nanofibers with non-meltable characteristics to be prevented from fusing together during carbonization.35 As shown in Fig. 1A, two characteristic peaks at 2239 and 1447 cm−1 are attributed to the –C![[triple bond, length as m-dash]](https://www.rsc.org/images/entities/char_e002.gif) N stretching vibration and –CH2 scissoring vibration of PAN according to previous reports.41 The intensity of both peaks decreases sharply after pre-oxidation due to the cyclization and dehydrogenation of PAN during heat treatment. No peaks can be observed at 3000–3500 cm−1, excluding the existence of primary or secondary amino groups in oPAN. Besides, three new peaks at 1593, 1254 and 795 cm−1 emerge in the curve of oPAN, which can be assigned to the C
N stretching vibration and –CH2 scissoring vibration of PAN according to previous reports.41 The intensity of both peaks decreases sharply after pre-oxidation due to the cyclization and dehydrogenation of PAN during heat treatment. No peaks can be observed at 3000–3500 cm−1, excluding the existence of primary or secondary amino groups in oPAN. Besides, three new peaks at 1593, 1254 and 795 cm−1 emerge in the curve of oPAN, which can be assigned to the C![[double bond, length as m-dash]](https://www.rsc.org/images/entities/char_e001.gif) N, C–C and C–N stretching vibrations, and a C–H out-of-plane wagging vibration, respectively, confirming the introduction of tertiary amino groups into oPAN during the pre-oxidation reaction.
N, C–C and C–N stretching vibrations, and a C–H out-of-plane wagging vibration, respectively, confirming the introduction of tertiary amino groups into oPAN during the pre-oxidation reaction.
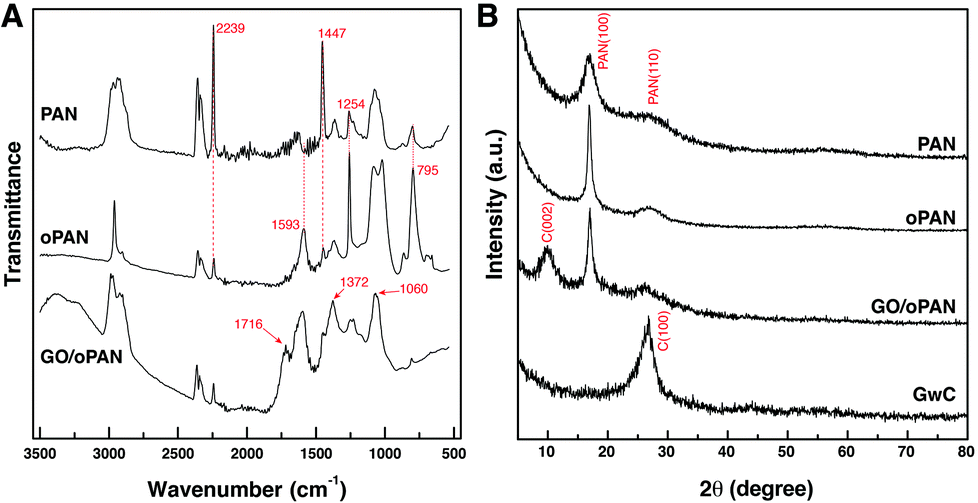 | ||
| Fig. 1 (A) FTIR spectra of PAN, oPAN and GO/oPAN membranes, (B) XRD curves of PAN, oPAN, GO/oPAN and GwC membranes. | ||
The existence of interconnected macroporous structures within the oPAN nanofibrous membrane (Fig. S2†) is highly desirable for the infiltration and diffusion of GO sheets in an aqueous medium, which would benefit the uniform assembly of GO on oPAN nanofibers. The FTIR spectrum of the GO/oPAN membrane indicates the presence of C–O (1060 cm−1), C–OH (1226 cm−1) and CO (1716 cm−1) groups of GO (Fig. 1A).42 The XRD curve (Fig. 1B) of the GO/oPAN membrane confirms the existence of a C(002) peak of GO, while the other two peaks at 2θ = 17° and 29.5° are assigned to the improved crystallite structure of oPAN after pre-oxidation. Furthermore, the C(100) peak occurs at 2θ = 27° (Fig. 1B) when the GO/oPAN membrane is finally carbonized into GwC at 900 °C, with oPAN nanofibers converted into carbon nanofibers while GO is simultaneously reduced to form reduced graphene oxide (hereinafter referred to as graphene). Interestingly, a sharp contrast can be observed in Fig. 2A and B that the smooth surface of CNF nanofibers becomes rough and irregular after the assembly of graphene sheets. A zoom-in observation in Fig. 2C reveals the unique configuration of graphene-wrapped carbon nanofibers, confirming that every single fiber is evenly wrapped by corrugated graphene sheets. The cross section of one single fiber shows that graphene sheets are peeled off during the fracture process (as indicated by the white arrow in Fig. 2D), indicating the successful wrapping of graphene on carbon nanofibers. It is also obvious that the flexibility of CNF is perfectly retained by the GwC membrane (insets of Fig. 2A and B). TEM images in Fig. 2E and F further reveal the novel structure of GwC, confirming that one carbon nanofiber is enveloped by multiple layers of graphene sheets. The tightly wrapped graphene layers serving as the conductive casing will definitely improve the electrical conductivity of the carbon nanofibers.
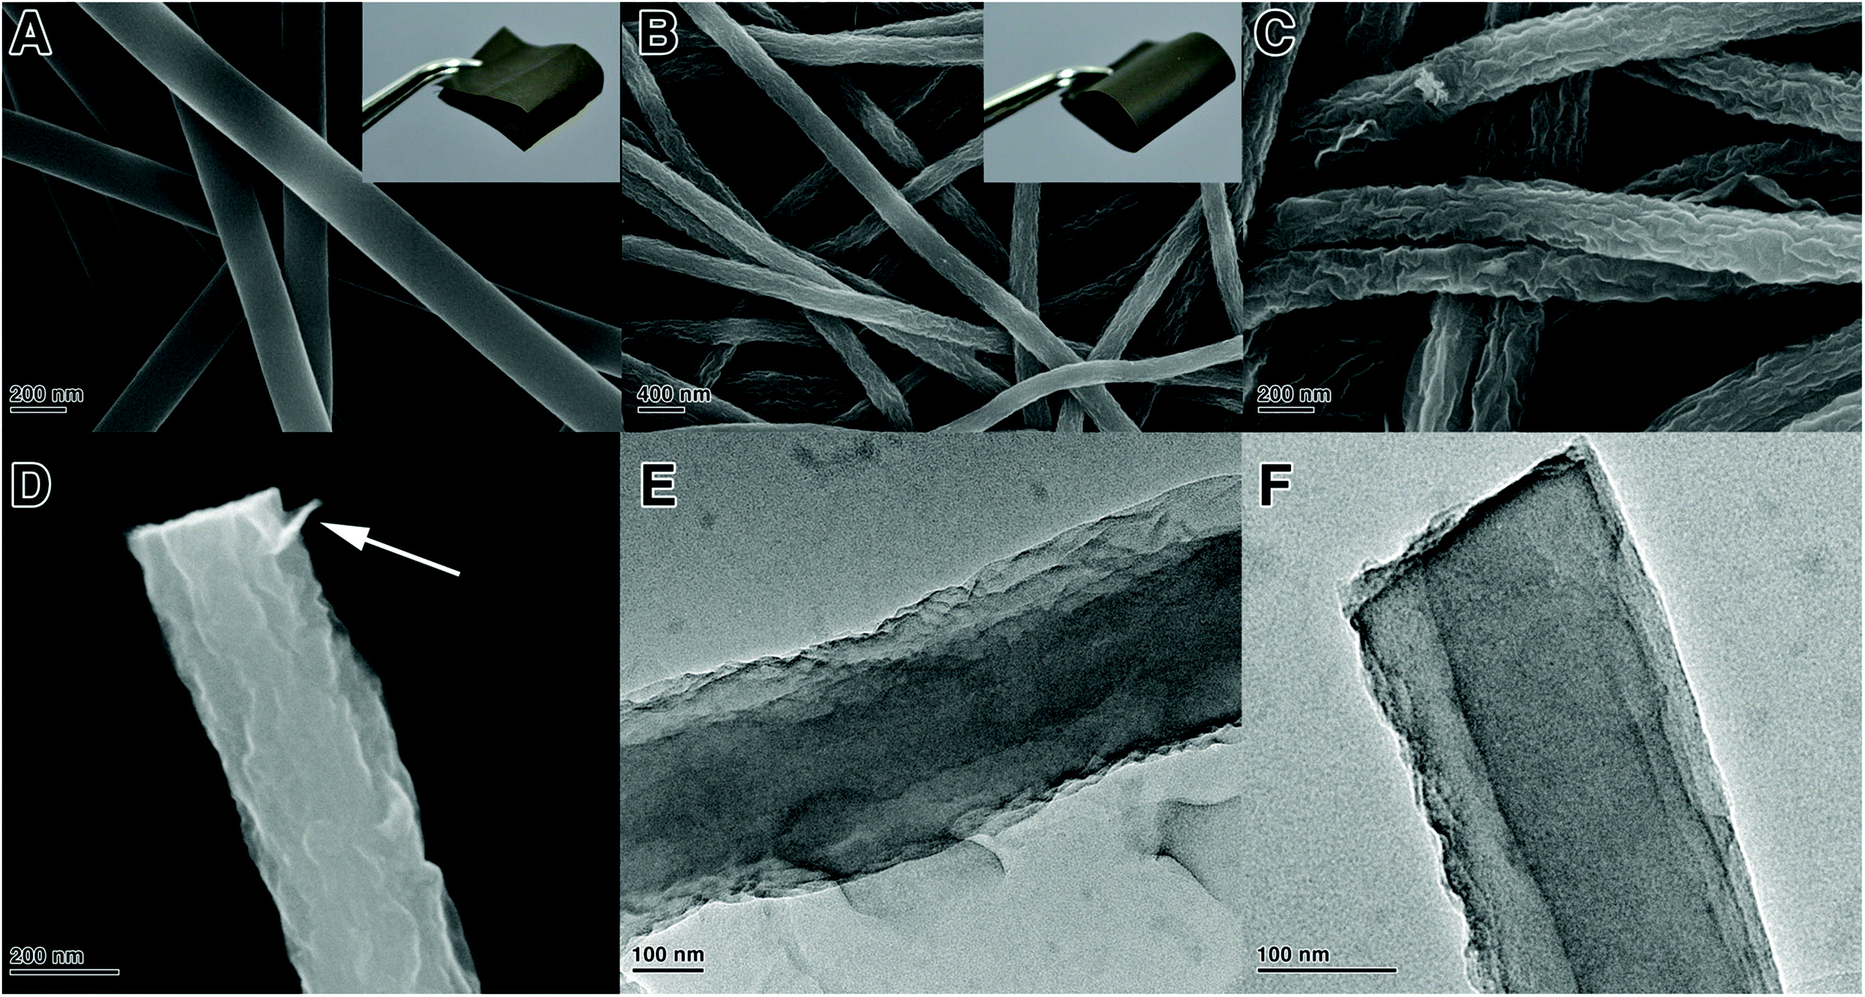 | ||
| Fig. 2 FESEM images of (A) bare CNF, and (B–D) GwC membranes under different magnifications. (E and F) TEM images of the GwC membrane showing the effective wrapping of graphene on the surface of CNF. The insets of (A and B) demonstrate the flexibility of both bare CNF and GwC membranes. | ||
The cross-section SEM images of the GwC membrane are provided in Fig. 3 to further probe the distribution of graphene along the Z-axis of the GwC membrane. The thickness of the self-standing GwC membrane is about 45 μm (Fig. 3A). High-resolution SEM images (Fig. 3B–D) focused on different regions (marked by red rectangles in Fig. 3A) indicate that graphene sheets are uniformly distributed in full depth along the Z-axis of the GwC membrane, confirming that GO sheets are able to diffuse throughout the oPAN membrane by virtue of the interconnected pores of electrospun nanofiber membranes. All these pieces of evidence indicate the successful wrapping of graphene on electrospun CNF membranes and highlight the feasibility of our protocol to integrate low-dimensional carbonaceous materials together.
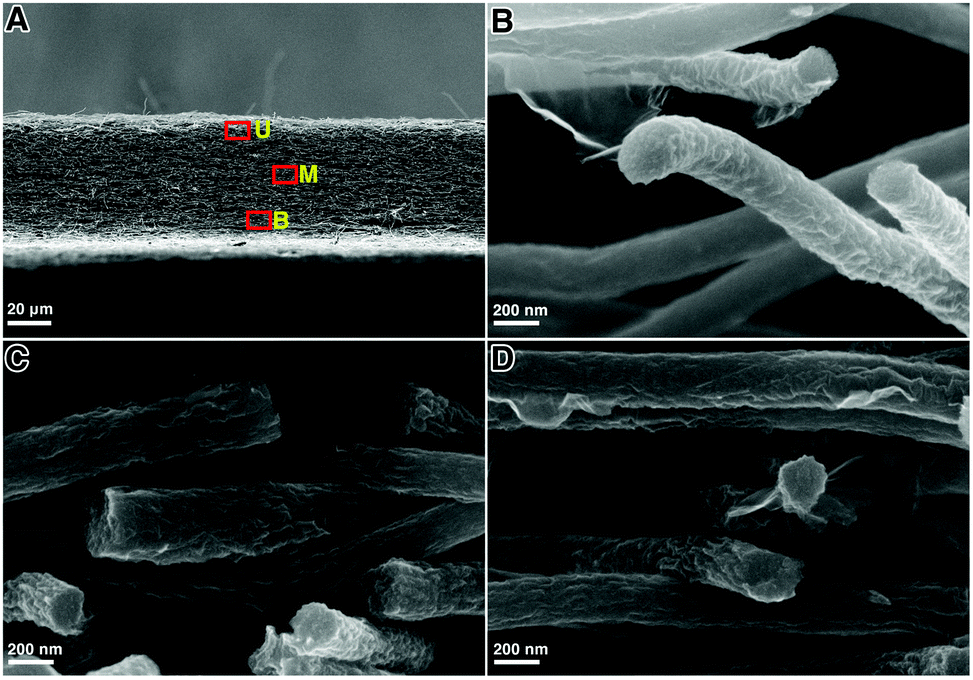 | ||
| Fig. 3 (A) Cross-sectional image of the GwC nanofibrous membrane and the corresponding magnified images from (B) upper region U, (C) middle region M, and (D) bottom region B. | ||
Based on the above characterization, a two-step surface-induced assembly process is proposed in the preparation of GwC (Scheme 2). In the first step, GO sheets penetrate into the oPAN nanofiber network in an aqueous medium and interact with oPAN fibers through hydrogen bonds between the oxygen-containing groups on GO and tertiary amino groups on oPAN, thus resulting in the surface-induced assembly of GO sheets till the interaction becomes too weak to support the process. Thus the obtained GO-wrapped oPAN nanofibers are subsequently treated at a high temperature to yield GwC membranes, with the hydrogen-bonded GO sheets synchronously converted to physically wrapped graphene.
 | ||
| Scheme 2 Schematic illustration showing the two-step assembly processes during the preparation of GwC membrane. | ||
Structure of GwC–MoSe2 composites
The GwC membranes can be used as self-standing substrates for the immobilization of various electrochemically active materials owing to their porosity, large surface area and operability. Hence, a facile low-temperature solvothermal process combined with post annealing treatment was utilized to deposit crystalline MoSe2 nanosheets on GwC membranes. As shown in Fig. 4A, only a few inconspicuous MoSe2 whiskers are scattered on the surface of GwC fibers under low Se dosage. For GwC–MoSe2-3 composites (Fig. 4B and C), MoSe2 subunits with a curled shape and perpendicular orientation are evenly distributed on the surfaces of graphene-wrapped carbon nanofibers, which also interconnect with each other to form a unique open network architecture. This can provide numerous exposed active edges and fast pathways for ion and electron transfer, thus potentially leading to an enhanced electrocatalytic activity. Further increasing the Se concentration to 6 mg mL−1 (Fig. 4D), MoSe2 nanosheets tend to agglomerate and block the porous structure of the GwC membrane, which deteriorates the overall electrochemical performance. The TEM image in Fig. 4E shows a well-defined core–shell structure of the GwC–MoSe2-3 composite. The high-resolution TEM image (Fig. 4F) indicates that MoSe2 nanosheets in the composite are composed of multiple MoSe2 single layers with the interlayer spacing of 0.65 nm, in good accordance with the (002) lattice spacing of MoSe2. All these morphological characterization methods give a visual confirmation on the successful synthesis of few-layered MoSe2 nanosheets on GwC membranes. A MoSe2 decorated CNF membrane was also prepared (with the absence of graphene wrapping) under the same Se concentration as the GwC–MoSe2-3 composite, which shows an identical morphology as shown in Fig. S3.†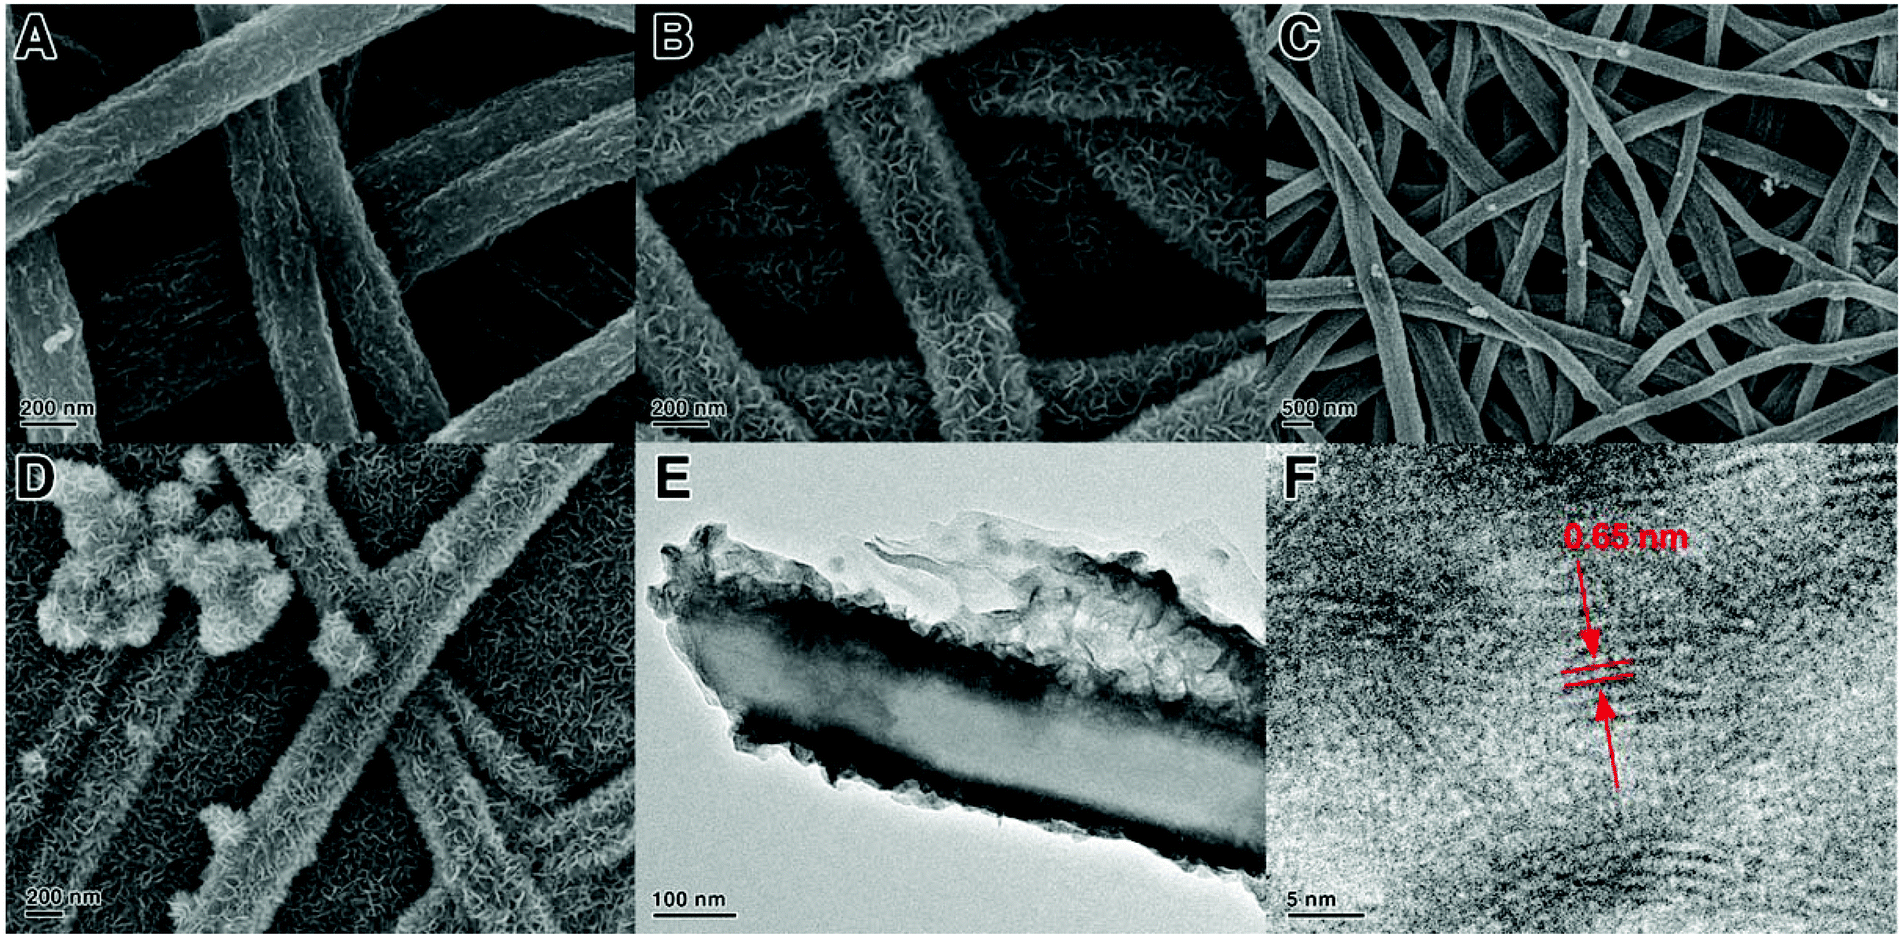 | ||
| Fig. 4 FESEM images of (A) GwC–MoSe2-1, (B and C) GwC–MoSe2-3, (D) GwC–MoSe2-6 composites. (E and F) TEM images of GwC–MoSe2-3 composite under different magnifications. | ||
The crystal structure of the GwC–MoSe2-3 composite was studied using XRD as shown in Fig. 5A. The diffraction peaks at 2θ = 13.7°, 26.4°, 32.2°, 37.3°, 54.1° and 56.6° can be respectively indexed to the (002), (004), (100), (103), (106) and (008) diffraction planes of the hexagonal 2H–MoSe2 phase (JCPDF card, no. 87-2419), revealing the high crystallinity of few-layered MoSe2 nanosheets on GwC. XPS analysis was conducted to further analyze the chemical composition and valence states of the GwC–MoSe2-3 composite. As shown in Fig. 5B, the high-resolution spectrum of Mo 3d exhibits two peaks at 228.9 and 232.1 eV assigned to Mo 3d5/2 and Mo 3d3/2 orbitals, respectively, confirming the formation of Mo4+. Binding energies of Se 3p3/2 and Se 3p1/2 at 160.8 and 166.6 eV indicate the chemical oxidation state of Se2− (Fig. 5C). Additionally, a detailed compositional analysis reveals that the surface atomic ratio of Mo:Se is 10:22, which is close to the formula of MoSe2.
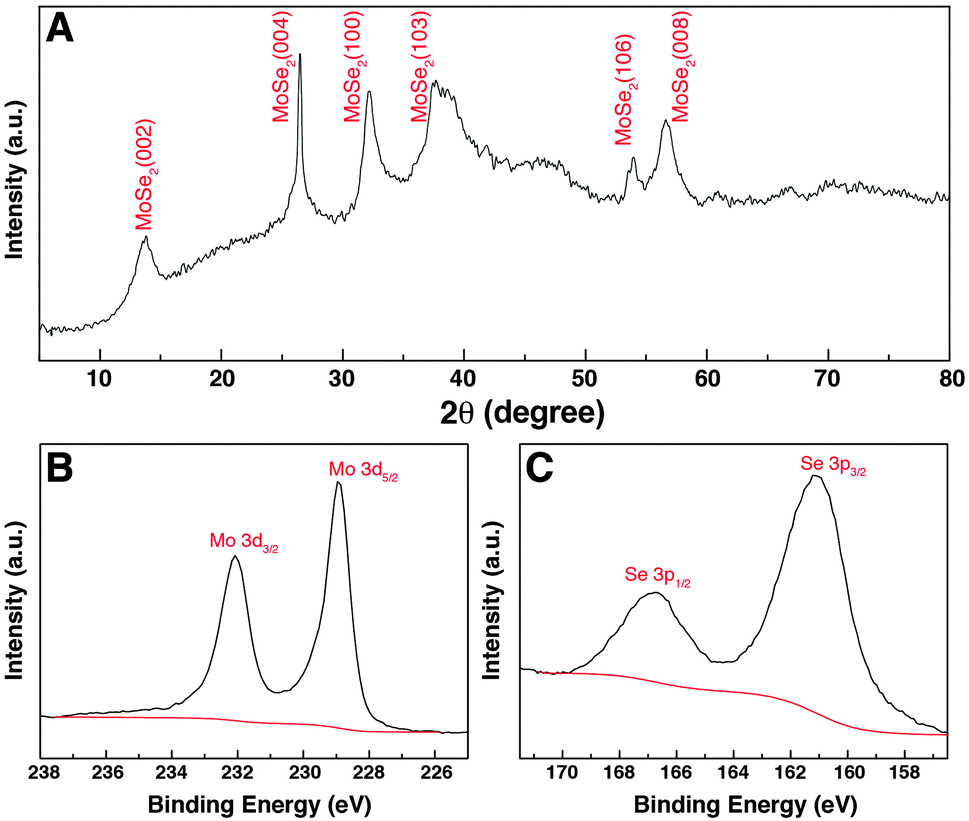 | ||
| Fig. 5 (A) XRD pattern and (B and C) XPS spectra of GwC–MoSe2-3 composite. | ||
Electrochemical evaluation of HER catalyst
The electrocatalytic HER activity of the GwC–MoSe2 composite modified GCE was first investigated in an acidic medium of 0.5 M H2SO4 solution using a typical three-electrode setup. As shown in Fig. 6A, Pt exhibits an extremely high HER catalytic activity with a near zero onset potential and a large current density. In contrast, the bare GwC membrane modified GCE shows almost no HER activity with a near flat line within the potential window. Pure MoSe2 exhibits a noteworthy HER activity owing to the intrinsic electrocatalytic activity of LTMD, but with a much lower anodic current and a more negative onset potential (−0.16 V vs. RHE) compared with those of GwC–MoSe2 composites, which is ascribed to the intrinsic low electrical conductivity and severely decreased active sites of agglomerated MoSe2 spheres (Fig. S4†). The GwC–MoSe2-1 composite shows obviously enhanced HER activity even with a minor MoSe2 loading, indicating the essential role of the GwC membrane as an advanced catalyst support. For the GwC–MoSe2-3 composite modified electrode, the LSV curve shows greatly improved current intensity and more positive onset potential of −0.08 V vs. RHE, which outperforms most of the previously reported MoS2- or MoSe2-based HER catalysts including exfoliated MoS2 nanosheets (−0.12 V),43 few-layered MoS2 nanosheets obtained by the chemical vapor deposition method (−0.15 V),44 and S-doped MoSe2 nanosheets (−0.1 V)45. However, the HER activity of GwC–MoSe2-3 is still inferior to that (−0.05 V) of the MoSe2/graphene hybrid due to its higher electrical conductivity of a pure graphene support.46 With respect to the GwC–MoSe2-6 composite modified GCE, the LSV curve negatively shifts with decreased activity. Possible reasons for the different HER electrocatalytic activities can be concluded from the morphological difference as shown in Fig. 3A–C. The GwC–MoSe2-3 composite shows an optimized hierarchical structure with a more uniform distribution of MoSe2 nanosheets and more exposed active edges compared with the GwC–MoSe2-1 and GwC–MoSe2-6 composites, which can provide more reaction sites for the HER process and facilitate fast ion/electron transfer, thus leading to better HER catalytic activity. Moreover, the CNF–MoSe2 composite exhibits inferior HER performance in terms of low current intensity and negatively shifted onset potential (−0.12 V vs. RHE) with respect to GwC–MoSe2-3 composites, further confirming the great importance of graphene wrapping in the enhancement of electrochemical behavior.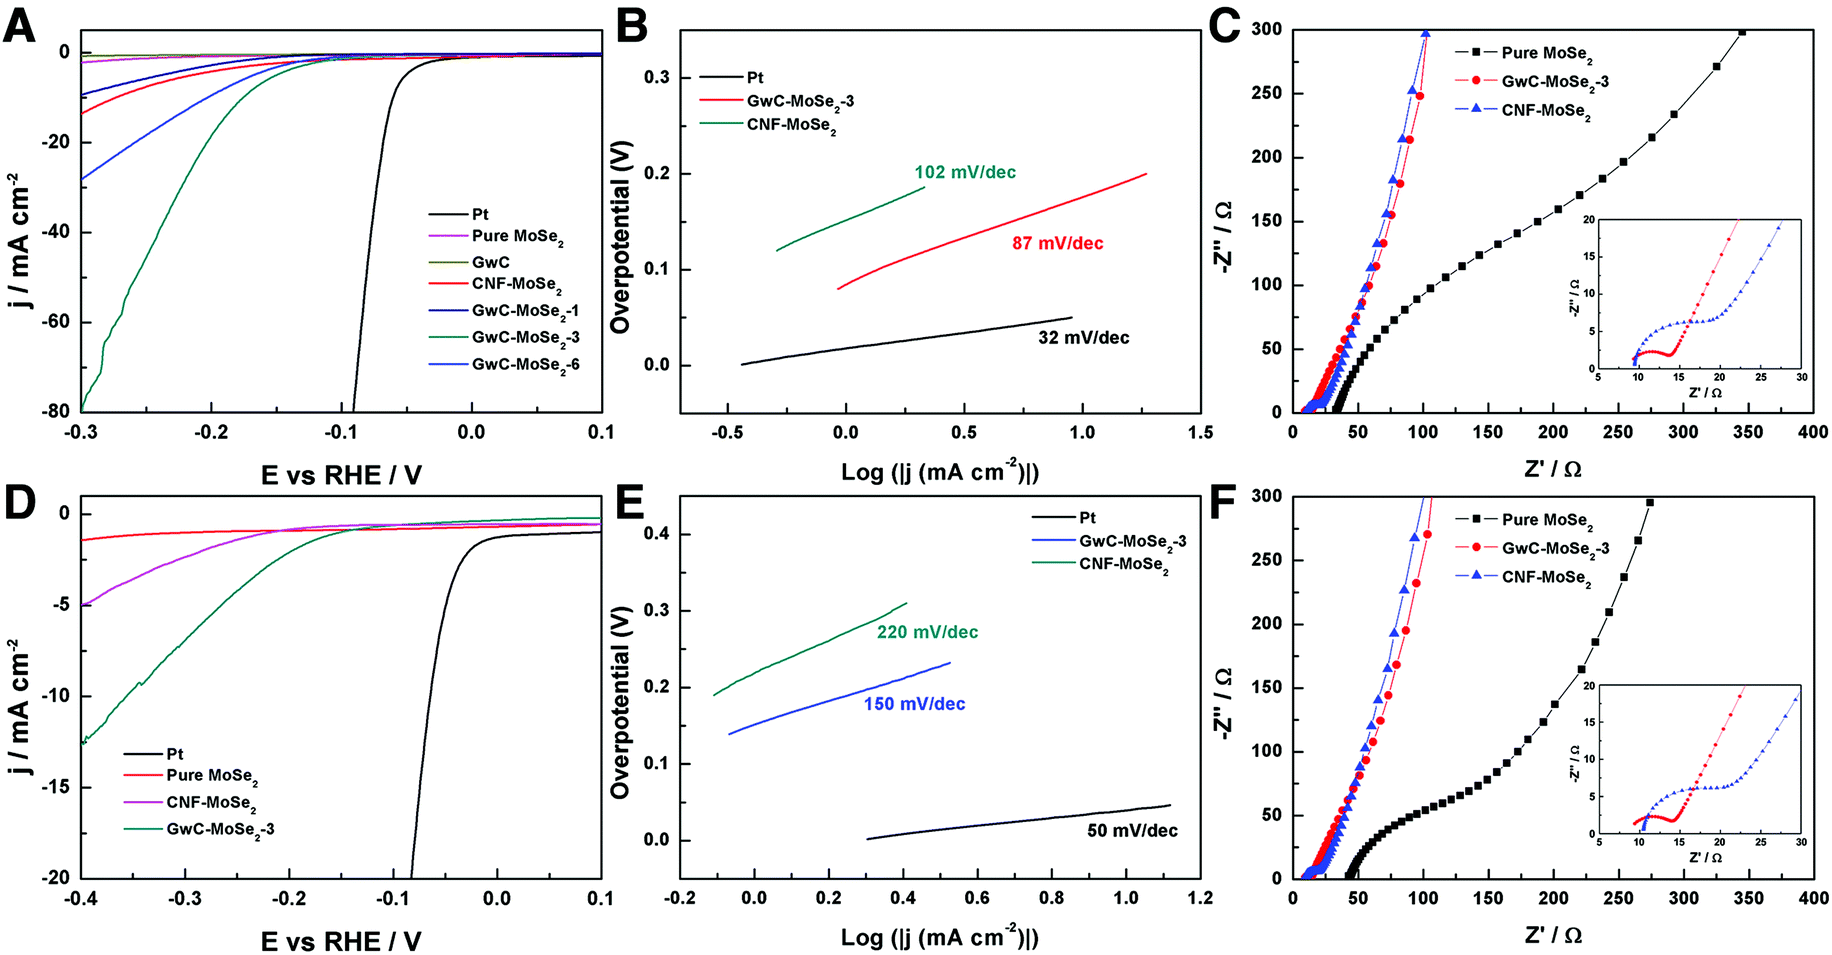 | ||
| Fig. 6 Electrochemical HER activity tests on different sample modified GCEs in (A–C) 0.5 M H2SO4 and (D–F) 1.0 M KOH: (A and D) LSV polarization curves for Pt, pure MoSe2 spheres, GwC, GwC–MoSe2 and CNF–MoSe2 composites, (B and E) the corresponding Tafel plots, and (C and F) EIS spectra of pure MoSe2 spheres, GwC–MoSe2-3 and CNF–MoSe2 composites. | ||
The corresponding Tafel plots in Fig. 6B show that the Tafel slopes for Pt, GwC–MoSe2-3 and CNF–MoSe2 composites are 32, 87 and 102 mV per decade, respectively (obtained from the Tafel equation η = blog(j) + a, where η is the overpotential, j is the current density and b is the Tafel slope). The small Tafel slope of the GwC–MoSe2-3 composite indicates a faster increase of the HER rate with increasing overpotential, which is favorable for practical applications. EIS measurements for pure MoSe2, GwC–MoSe2-3 and CNF–MoSe2 composites are performed to understand their electrochemical behavior during the HER process. As shown in Fig. 6C, both the charge transfer resistance (Rct, the visible semicircles in high frequency region) and series resistance (Rs, the x-intercept of Nyquist plots) of MoSe2 decrease dramatically after growing on CNF and GwC membranes, indicating that both CNF and GwC nanofibrous supports can serve as conductive backbones to accelerate the ion diffusion and charge transfer. Additionally, the enlarged high frequency region in the inset of Fig. 6C reveals a smaller Rct of the GwC–MoSe2-3 composite with respect to the CNF–MoSe2 composite, demonstrating that the wrapped graphene layers can largely improve the electrical conductivity (12.90 S m−1) of the GwC membrane compared with that (0.39 S m−1) of the CNF membrane.
Furthermore, the HER performance of the GwC–MoSe2-3 composite is also evaluated under alkaline conditions. As shown in Fig. 6D and E, GwC–MoSe2-3 modified GCE shows the best alkaline HER activity with an onset potential of −0.138 V vs. RHE and a Tafel slope of 150 mV per decade compared with pure MoSe2 (onset potential of ∼−0.3 V vs. RHE) and the CNF–MoSe2 composite (onset potential of −0.19 V vs. RHE and a Tafel slope of 220 mV per decade), which is also comparable to the behaviors of most reported advanced HER catalysts in basic media, such as bulk MoB,47 Co-embedded nitrogen-rich carbon nanotubes (CNTs),48 and CoP coated carbon cloth.49 The EIS results under alkaline conditions are identical to those in acidic media, despite the Rct of the GwC–MoSe2-3 electrode slightly increasing, implying better HER performance of GwC–MoSe2-3 in an acidic medium. To assess the stability of the GwC–MoSe2-3 composite during the HER process, time-dependent current density curves were respectively collected under acidic and alkaline conditions for 5000 s at the static overpotentials (−0.16 V in 0.5 M H2SO4, and −0.28 V in 1 M KOH) (Fig. 7A and B), both of which demonstrate excellent long-term stability of the GwC–MoSe2-3 electrode at a constant high current density. The remarkable electrochemical HER performance of the GwC–MoSe2-3 composite is attributed to the synergistic effects between graphene reinforced CNF and HER active MoSe2 nanosheets. The GwC membrane can direct the uniform distribution of MoSe2 and offer conductive networks for a fast charge transfer while perpendicularly oriented few-layered MoSe2 nanosheets with numerous exposed active edges provide sufficient electrochemical sites for efficient HER reaction. This electrochemical evidence further highlight the novel design of this fascinating GwC composite membrane as an electrically reinforced catalyst support, which is envisioned to be applied in the fabrication of various energy-related devices including supercapacitors, fuel cells, Li-ion batteries, etc.
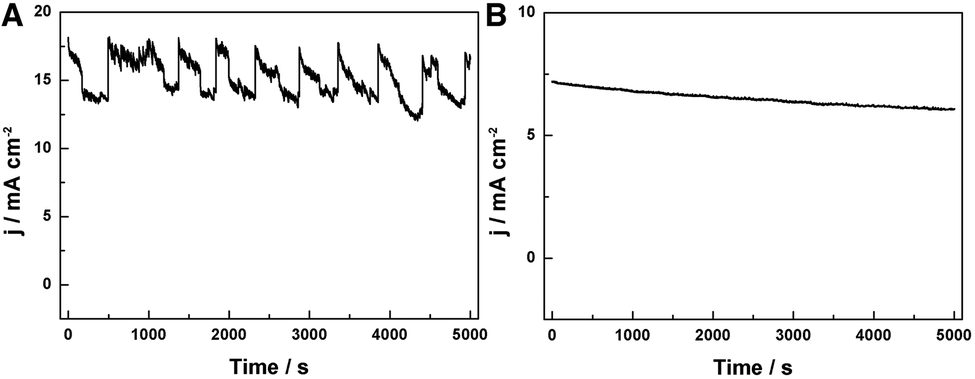 | ||
| Fig. 7 Time-dependent current density curves at static overpotentials of (A) −0.16 V in 0.5 M H2SO4 and (B) −0.28 V in 1.0 M KOH, respectively. | ||
Conclusions
In summary, we have developed a versatile and additive-free hydrogen bonding directed assembly approach for the uniform wrapping of graphene sheets on electrospun carbon nanofibers to obtain a GwC composite. By combining the advantages of both carbonaceous materials, the GwC composite membrane demonstrates to be a superior catalyst support for electrochemical HER. Surprisingly, the as-obtained GwC–MoSe2 composites exhibit greatly enhanced electrochemical HER performance in both acidic and alkaline solutions with respect to the MoSe2 anchored CNF composite, which is mainly ascribed to the improved electrical conductivity of GwC and evenly distributed few-layered MoSe2 nanosheets. Furthermore, such a facile surface-induced assembly strategy opens a new avenue for the reconstruction of conventional electrospun CNF membranes towards high-performance energy storage and conversion applications.Acknowledgements
The authors are grateful for the financial support from the National Natural Science Foundation of China (51125011, 51373037, 51433001).Notes and references
- K. S. Novoselov, A. K. Geim, S. V. Morozov, D. Jiang, Y. Zhang, S. V. Dubonos, I. V. Grigorieva and A. A. Firsov, Science, 2004, 306, 666–669 CrossRef CAS PubMed.
- C. G. Lee, X. D. Wei, J. W. Kysar and J. Hone, Science, 2008, 321, 385–388 CrossRef CAS PubMed.
- R. R. Nair, P. Blake, A. N. Grigorenko, K. S. Novoselov, T. J. Booth, T. Stauber, N. M. R. Peres and A. K. Geim, Science, 2008, 320, 1308–1308 CrossRef CAS PubMed.
- Y. J. Gong, S. B. Yang, Z. Liu, L. L. Ma, R. Vajtai and P. M. Ajayan, Adv. Mater., 2013, 25, 3979–3984 CrossRef CAS PubMed.
- D. B. Kong, H. Y. He, Q. Song, B. Wang, W. Lv, Q. H. Yang and L. J. Zhi, Energy Environ. Sci., 2014, 7, 3320–3325 CAS.
- G. Z. Sun, J. Q. Liu, X. Zhang, X. W. Wang, H. Li, Y. Yu, W. Huang, H. Zhang and P. Chen, Angew. Chem., Int. Ed., 2014, 53, 12576–12580 CAS.
- H. Xia, C. Hong, B. Li, B. Zhao, Z. X. Lin, M. B. Zheng, S. V. Savilov and S. M. Aldoshin, Adv. Funct. Mater., 2015, 25, 627–635 CrossRef CAS.
- Z. Y. Yin, S. X. Wu, X. Z. Zhou, X. Huang, Q. C. Zhang, F. Boey and H. Zhang, Small, 2010, 6, 307–312 CrossRef CAS PubMed.
- H. X. Chang, L. H. Tang, Y. Wang, J. H. Jiang and J. H. Li, Anal. Chem., 2010, 82, 2341–2346 CrossRef CAS PubMed.
- M. R. Gao, X. Cao, Q. Gao, Y. F. Xu, Y. R. Zheng, J. Jiang and S. H. Yu, ACS Nano, 2014, 8, 3970–3978 CrossRef CAS PubMed.
- D. U. Lee, B. J. Kim and Z. W. Chen, J. Mater. Chem. A, 2013, 1, 4754–4762 CAS.
- J. J. Duan, S. Chen, B. A. Chambers, G. G. Andersson and S. Z. Qiao, Adv. Mater., 2015, 27, 4234–4241 CrossRef CAS PubMed.
- L. P. Jia, X. Sun, Y. M. Jiang, S. J. Yu and C. M. Wang, Adv. Funct. Mater., 2015, 25, 1814–1820 CrossRef CAS.
- Y. G. Li, H. L. Wang, L. M. Xie, Y. Y. Liang, G. S. Hong and H. J. Dai, J. Am. Chem. Soc., 2011, 133, 7296–7299 CrossRef CAS PubMed.
- Y. P. Huang, H. Y. Lu, H. H. Gu, J. Fu, S. Y. Mo, C. Wei, Y. E. Miao and T. X. Liu, Nanoscale, 2015, 7, 18595–18602 RSC.
- M. Bazhban, M. Nouri and J. Mokhtari, Chin. J. Polym. Sci., 2013, 31, 1343–1351 CrossRef CAS.
- A. Greiner and J. H. Wendorff, Angew. Chem., Int. Ed., 2007, 46, 5670–5703 CrossRef CAS PubMed.
- D. Li and Y. N. Xia, Adv. Mater., 2004, 16, 1151–1170 CrossRef CAS.
- Z. Y. Xiong, X. Y. Kong, Z. X. Guo and J. Yu, Chin. J. Polym. Sci., 2015, 33, 1234–1244 CrossRef CAS.
- M. Inagaki, Y. Yang and F. Kang, Adv. Mater., 2012, 24, 2547–2566 CrossRef CAS PubMed.
- Z. Y. Zhang, X. H. Li, C. H. Wang, S. W. Fu, Y. C. Liu and C. L. Shao, Macromol. Mater. Eng., 2009, 294, 673–678 CrossRef CAS.
- Y. E. Miao, Y. P. Huang, L. S. Zhang, W. Fan, F. L. Lai and T. X. Liu, Nanoscale, 2015, 25, 11093–11101 RSC.
- Y. Z. Wu, M. V. Reddy, B. V. R. Chowdari and S. Ramakrishna, ACS Appl. Mater. Interfaces, 2013, 5, 12175–12184 CAS.
- G. J. Wei, M. H. Jing, X. Z. Fan, J. G. Liu and C. W. Yan, J. Power Sources, 2015, 287, 81–86 CrossRef CAS.
- C. Flox, C. Fabrega, T. Andreu, A. Morata, M. Skoumal, J. Rubio-Garcia and J. R. Morante, RSC Adv., 2013, 3, 12056–12059 RSC.
- A. Ghosh, E. J. Ra, M. H. Jin, H. K. Jeong, T. H. Kim, C. Biswas and Y. H. Lee, Adv. Funct. Mater., 2011, 21, 2541–2547 CrossRef CAS.
- X. Li, X. B. Zang, Z. Li, X. M. Li, P. X. Li, P. Z. Sun, X. Lee, R. J. Zhang, Z. H. Huang, K. L. Wang, D. H. Wu, F. Y. Kang and H. W. Zhu, Adv. Funct. Mater., 2013, 23, 4862–4869 CAS.
- M. Y. Li, G. Y. Han and B. S. Yang, Electrochem. Commun., 2008, 10, 880–883 CrossRef CAS.
- J. H. Park, Y. W. Ju, S. H. Park, H. R. Jung, K. S. Yang and W. J. Lee, J. Appl. Electrochem., 2009, 39, 1229–1236 CrossRef CAS.
- Y. P. Huang, Y. E. Miao, S. S. Ji, W. W. Tjiu and T. X. Liu, ACS Appl. Mater. Interfaces, 2014, 6, 12449–12456 CAS.
- S. G. Wang, Z. T. Cui and M. H. Cao, Chem. – Eur. J., 2015, 21, 2165–2172 CrossRef CAS PubMed.
- W. X. Yang, Y. Q. Zhang, C. Y. Liu and J. B. Jia, J. Power Sources, 2015, 274, 595–603 CrossRef CAS.
- L. Gu, N. Y. Cui, L. Cheng, Q. Xu, S. Bai, M. M. Yuan, W. W. Wu, J. M. Liu, Y. Zhao, F. Ma, Y. Qin and Z. L. Wang, Nano Lett., 2013, 13, 91–94 CrossRef CAS PubMed.
- F. Zhang, C. Z. Yuan, J. J. Zhu, J. Wang, X. G. Zhang and X. W. Lou, Adv. Funct. Mater., 2013, 23, 3909–3915 CrossRef CAS.
- H. O. Pierson, Handbook of Carbon, Graphite, Diamond, and Fullerenes: Properties, Processing, and Applications, Noyes Publications, 1993 Search PubMed.
- Q. H. Guo, X. P. Zhou, X. Y. Li, S. L. Chen, A. Seema, A. Greiner and H. Q. Hou, J. Mater. Chem., 2009, 19, 2810–2816 RSC.
- Y. Wang, J. G. Tang, S. Q. Xie, J. X. Liu, Z. C. Xin, X. L. Liu and L. A. Belfiore, RSC Adv., 2015, 5, 42174–42177 RSC.
- W. S. Hummers and R. E. Offeman, J. Am. Chem. Soc., 1958, 80, 1339–1339 CrossRef CAS.
- Y. P. Huang, Y. E. Miao, J. Fu, S. Y. Mo, C. Wei and T. X. Liu, J. Mater. Chem. A, 2015, 3, 16263–16271 CAS.
- M. S. Faber, R. Dziedzic, M. A. Lukowski, N. S. Kaiser, Q. Ding and S. Jin, J. Am. Chem. Soc., 2014, 136, 10053–10061 CrossRef CAS PubMed.
- J. Mittal, O. P. Bahl, R. B. Mathur and N. K. Sandle, Carbon, 1994, 32, 1133–1136 CrossRef CAS.
- X. G. Mei and J. Y. Ouyang, Carbon, 2011, 49, 5389–5397 CrossRef CAS.
- S. S. Ji, Z. Yang, C. Zhang, Z. Y. Liu, W. W. Tjiu, I. Y. Phang, Z. Zhang, J. S. Pan and T. X. Liu, Electrochim. Acta, 2013, 109, 269–275 CrossRef CAS.
- M. A. Lukowski, A. S. Daniel, F. Meng, A. Forticaux, L. S. Li and S. Jin, J. Am. Chem. Soc., 2013, 135, 10274–10277 CrossRef CAS PubMed.
- C. Xu, S. J. Peng, C. L. Tan, H. X. Ang, H. T. Tan, H. Zhang and Q. Y. Yan, J. Mater. Chem. A, 2014, 2, 5597–5601 CAS.
- H. Tang, K. P. Dou, C. C. Kaun, Q. Kuang and S. H. Yang, J. Mater. Chem. A, 2014, 2, 360–364 CAS.
- H. Vrubel and X. L. Hu, Angew. Chem., Int. Ed., 2012, 124, 12875–12878 CrossRef.
- X. X. Zou, X. X. Huang, A. Goswami, R. Silva, B. R. Sathe, E. Mikmeková and T. Asefa, Angew. Chem., Int. Ed., 2014, 126, 4461–4465 CrossRef.
- J. Q. Tian, Q. Liu, A. M. Asiri and X. P. Sun, J. Am. Chem. Soc., 2014, 136, 7587–7590 CrossRef CAS PubMed.
Footnote |
| † Electronic supplementary information (ESI) available: Contact angle measurements of PAN and oPAN nanofibrous membranes; SEM images of oPAN nanofibers, CNF–MoSe2 composites and pure MoSe2 aggregates. See DOI: 10.1039/c6qi00101g |
| This journal is © the Partner Organisations 2016 |