High photodegradation efficiency of phenol by mixed-metal–organic frameworks†
Mohammad Yaser
Masoomi‡
a,
Minoo
Bagheri‡
a,
Ali
Morsali
*a and
Peter C.
Junk
*b
aDepartment of Chemistry, Faculty of Sciences, Tarbiat Modares University, Tehran, Islamic Republic of Iran. E-mail: morsali_a@modares.ac.ir; Tel: (+98) 21-82883449
bCollege of Science, Technology & Engineering, James Cook University, Townsville, Queensland 4811, Australia. E-mail: peter.junk@jcu.edu.au
First published on 25th April 2016
Abstract
Four MOFs, [Zn(oba)(4-bpdh)0.5]n·1.5DMF (TMU-5), [Cd0.15Zn0.85(oba)(4-bpdh)0.5]n·1.5DMF (TMU-5(Cd 15%)), [Cd0.3Zn0.7(oba)(4-bpdh)0.5]n·1.5DMF (TMU-5(Cd 30%)) and [Cd(oba)(4-bpdh)]n·1DMF (TMU-7) were synthesized using non-linear dicarboxylate and linear N-donor ligands, 4,4′-oxybis(benzoic acid) (H2oba) and 2,5-bis(4-pyridyl)-3,4-diaza-2,4-hexadiene (4-bpdh), respectively, and characterized by single-crystal X-ray crystallography. These MOFs were studied for phenol degradation from aqueous solutions under UV and/or visible light irradiation without auxiliary oxidants such as H2O2. Degradation efficiency in the presence of Zn-based MOFs is higher than that of the Cd-based MOF (TMU-7). Moreover, the high percentage degradation of phenol in the presence of TMU-5(30% Cd) is largely greater than that in other studies on MOF-5 and Degussa P-25 TiO2. The photocatalytic degradation of phenol in solution obeys first-order reaction kinetics.
Introduction
Recently, environmental pollution has become a great challenge for the scientific world that needs to be addressed effectively. Photocatalytic technology, as a “green” method, has been widely used to treat polluted air and water.1–3 However, the degradation performance is not so satisfactory in the process of actual pollutant treatment due to the low catalytic efficiency and poor visible light activity. Thus, the design of photocatalysts mainly concentrates on the following two aspects. First is how to restrain the recombination of photoinduced carriers and improve the efficiency of photocatalyst. Another is how to expand the absorption edge to absorb visible and even infrared light.2,4,5Metal–organic frameworks (MOFs), as a new class of porous materials, can be designed by carefully selecting organic ligands in combination with inorganic secondary building units (SBUs).6–10 Recent studies have shown that MOFs can act as attractive semiconducting materials when exposed to light, implying that they are potentially useful as photocatalysts.11–14 In many reports, an auxiliary oxidant such as H2O2 was used for generation of OH˙ species resulting in progress of the photocatalytic reaction.15
Considering the many examples of MOFs that have been reported, mixed-metal–organic frameworks are relatively scarce.16–19 Mixed-metal MOFs can be assembled in different ways. One method is via a stepwise manner through use of metalloligands.20–22 Another approach is using more than one type of metal centre in the synthesis procedure, wherein the original structure may not be maintained.23–25 Postsynthetic modification by substituting some of the metal centres in a preformed MOF by a second metal has also been examined.26 In some cases, mixed-valence state MOFs with one metal centre in two different oxidation states can also be prepared.27–29
Of the many ligands that have been employed for the preparation of MOF structures, the use of a combination of functionalized dicarboxylic acids and N-donor ligands can lead to MOFs with desired properties.30–33
After synthesising the MOF, [Zn(oba)(4-bpdh)0.5]n·1.5DMF (TMU-5), using non-linear dicarboxylate and linear N-donor ligands, 4,4′-oxybis(benzoic acid) (H2oba) and 2,5-bis(4-pyridyl)-3,4-diaza-2,4-hexadiene (4-bpdh),34 we explore the possibility of synthesizing mixed-metal MOFs with the same structure. In this study, we synthesized two new mixed-metal MOFs, with the same structure as TMU-5 by simultaneously using Zn(II) and Cd(II) salts. Moreover, another new Cd(II) based MOF with the same components was obtained using only the Cd(II) salt; in this the framework differs from all three previous MOFs. Moreover, photocatalytic efficiency of these MOFs for degradation of phenol under UV-Vis light without auxiliary oxidant was investigated. Furthermore, kinetics of photocatalytic degradation were studied.
Experimental section
Materials and physical techniques
All reagents for the synthesis and analysis were commercially available from Aldrich and Merck Company and used as received. The ligand 4-bpdh was prepared by the reported method.35 Melting points were measured on an Electrothermal 9100 apparatus. IR spectra were obtained using a Thermo Nicolet IR 100 FT-IR spectrometer. The samples were characterized with a field emission scanning electron microscope (FE-SEM) ZEISS SIGMA VP (Germany) with gold coating.The thermal behaviour was measured with a PL-STA 1500 apparatus with a heating rate of 10 °C min−1 in a static atmosphere of nitrogen. Simultaneous inductively coupled plasma–optical emission spectrometry (ICP–OES, Varian Vista-PRO, Springvale, Australia) with a radial torch coupled to a concentric nebulizer and Scott spray chamber and equipped with a charge coupled device (CCD) detector was used for ICP measurements. X-ray powder diffraction (XRD) measurements were performed using a Philips X'pert diffractometer with monochromated Cu-Kα radiation. Elemental analyses were performed on a CHNS Thermo Scientific Flash 2000 elemental analyzer.
Crystallographic measurements were made at 293(1) K for TMU-5(Cd 15%) and TMU-5(Cd 30%) using a Bruker X8 Apex II CCD (Mo-Kα radiation, λ = 0.71073 Å). Data collection for TMU-7 was performed on a Bruker SMART APEX II X-ray diffractometer with graphite-monochromated Mo-Kα radiation (λ = 0.71073 Å), operating at 50 kV and 30 mA over the 2θ range of 4.32°–52.00°. No significant decay was observed during the data collection. The structures were solved by direct methods and refined by refinement of F2 against all reflections. Structure solution and refinement were accomplished using SIR97, SHELXL97 and WinGX.36
[Zn(oba)(4-bpdh) 0.5 ] n ·1.5DMF (TMU-5), was synthesized according to a previously published study.34
Synthesis of [Cd(oba)(4-bpdh)] n ·(DMF)x(TMU-7), wherein x varies depending on the synthetic methodology used for mechanosynthesis: x = 0; for conventional heating: x = 1.
Conventional heating
Single crystals of TMU-7 suitable for X-ray diffraction were preapared by mixing Cd(NO3)2·4H2O (0.280 g, 0.9 mmol), H2oba (0.251 g, 1 mmol) and 4-bpdh (0.182 g, 0.75 mmol) in 30 mL of DMF. This mixture was sonicated until all solids were uniformly dispersed (∼3 min) and then heated at 80 °C. After 3 days, yellow crystals of TMU-7 were collected; yield: 71%. d.p. >300 °C. IR data (KBr pellet, ν/cm−1): 507(vw), 572(w), 660(m), 778(s), 833(s), 870(s), 1013(m), 1092(m), 1157(s), 1233(vs), 1301(s), 1392(vs-br), 1500(s), 1551(s), 1601(vs), 1671(vs), 2925(m), 3063(w) and 3421(w-br). Elemental analysis (%) calculated for [Cd(C14O5H8)(C14H14N4)]·(C3NOH7): C: 54.7, H: 4.3, N: 10.3; Found: C: 54.3, H: 3.9, N: 9.9.Mechanochemical synthesis
TMU-7 was isolated after grinding Cd(OAc)2·2H2O (0.266 g, 1 mmol), H2oba (0.257 g, 1 mmol) and 4-bpdh (0.238 g, 1 mmol) by hand for 20 minutes. The resulting powders were washed with DMF several times in order to remove any unreacted starting material and then dried at 100 °C.Yield: 87%. d.p. >300 °C. IR data (KBr pellet, ν/cm−1): 512(vw), 574(w), 659(w), 780(w), 830(w), 873(w), 1012(vw), 1096(vw), 1160(w), 1237(vs), 1299(w), 1395(vs-br), 1548(vs), 1601(vs), 1669(w), 2928(m) and 3420(w-br). Elemental analysis (%) calculated for [Cd(C14O5H8)(C14H14N4)]: C: 55.4, H: 3.6, N: 9.2; Found: C: 55.1, H: 3.2, N: 8.9.
Activation method
All samples were heated in an oven at 140 °C for 48 hours under vacuum. The structure remains intact upon removal of guest DMF molecules.Determination of Zn2+ and Cd2+ contents
Powder samples of TMU-5(Cd15%) and TMU-5(Cd30%) (10 mg) were digested by NaOH and the resulting clear solution diluted to 10 mL and adjusted to pH 7. The concentrations of Zn2+ and Cd2+ were determined using ICP as 102 (expected 99.7) and 26.4 (expected 30.2) ppm, respectively, for TMU-5(Cd 15%) and 82 (expected 80.5) and 56.7 (expected 59.3) ppm, respectively, for TMU-5(Cd 30%).Photocatalytic activity evaluation
The photocatalytic activity was carried out in a standard photocatalytic reactor that consists of two parts: a cylindrical quartz UV reactor (200 mL) with an outer jacket and a UV lamp (30 W, UV-C, λ = 253.7 nm, 4.89 eV, Philips, The Netherlands) and/or a 300 W Xe lamp (PLS-SXE300, Beijing Changtuo Co., Ltd, China) as a white light source and visible light using a 420 nm cut-off filter to remove ultraviolet light placed perpendicular to the reactor as light sources while the distance between light source and reaction mixture was almost 15 cm. All the experiments were conducted at ambient pressure and the reaction temperature was maintained at 25 ± 1 °C by the continuous circulation of water through the jacket around the reactor. Air was blown into the reaction mixture by an air compressor, to maintain oxygen saturation in the solution during the course of reaction. The typical procedure was as follows. A suspension of 25 mg MOF powder and 50 mL of a 50 and 25 ppm aqueous phenol solution without auxiliary oxidant such as H2O2 was sonicated until well mixed and subsequently stirred in the dark for certain durations of darkness time (depending on the type of samples and their darkness time found based on the absorption experiments) to establish the adsorption/desorption equilibrium on the MOF surface before UV and/or visible light irradiation. 5 mL samples were collected from the suspension and were immediately centrifuged at 6000 rpm for 10 min to remove the particles and then further analyzed through monitoring their absorbance at 270 nm using a UV-Vis spectrophotometer (Shimadzu UV 2100). The concentration of phenol in each degraded sample was determined at λmax = 270 nm, using the calibration curve. With this method, the percentage removal of phenol could be determined at different intervals. The percentage removal was calculated by the following equation:| % Removal = (Ci − Ct)/Ci × 100 | (1) |
The chemical oxygen demand (COD) test is extensively employed as an effective technique to measure organic strength of wastewater. This test allows measurement of waste in terms of total quantity of oxygen required for oxidation of organic matter to CO2 and water. In the present study, the open reflux method was used for COD determination.37
To detect photogenerated OH radicals, 25 mg of the photocatalyst in a basic terephthalic acid solution (4 × 10⁻⁴ M of terephthalic acid and 2 × 10⁻³ M NaOH) was irradiated under the abovementioned conditions for photocatalytic activity. The fluorescence of generated 2-hydroxyterephthalic acid was recorded on a Perkin Elmer-LS55 fluorescence spectrometer at room temperature with an excitation wavelength of 320 nm.
Results and discussion
Characterization
Single crystals of all MOFs were obtained by mixing the oxygen donor ligand, H2oba, metal salts, Zn(NO3)2·6H2O or Cd(NO3)2·4H2O (with different ratios) and the N-donor ligand, 4-bpdh, in DMF solvent at 80 °C for 3–4 days. The IR spectra of all four MOFs produced by conventional heating show the symmetric νsym(COO) and asymmetric νas(COO) vibrations of the carboxylate groups at around 1400 cm−1 and 1600 cm−1, respectively. Moreover, the characteristic absorption peak (νC![[double bond, length as m-dash]](https://www.rsc.org/images/entities/char_e001.gif) O = 1674 cm−1) of DMF molecules is present in the IR spectra of all four MOFs (Fig. S1†). In addition, TMU-7 was prepared by mechanochemical reaction of a mixture of Cd(OAc)2·2H2O, H2oba and 4-bpdh for 20 minutes (Fig. S2†). Comparison between experimental and simulated powder X-ray diffraction (PXRD) patterns reveals that the mechanosynthesized TMU-7 is structurally identical to TMU-7 prepared via conventional heating (Fig. 1).
O = 1674 cm−1) of DMF molecules is present in the IR spectra of all four MOFs (Fig. S1†). In addition, TMU-7 was prepared by mechanochemical reaction of a mixture of Cd(OAc)2·2H2O, H2oba and 4-bpdh for 20 minutes (Fig. S2†). Comparison between experimental and simulated powder X-ray diffraction (PXRD) patterns reveals that the mechanosynthesized TMU-7 is structurally identical to TMU-7 prepared via conventional heating (Fig. 1).
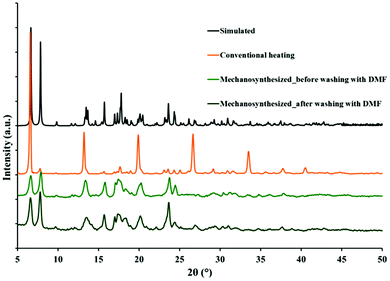 | ||
| Fig. 1 Comparison of PXRD patterns for TMU-7: simulated; solvothermal synthesis; mechanosynthesized before and after washing with DMF to remove any unreacted metal salt or ligands. | ||
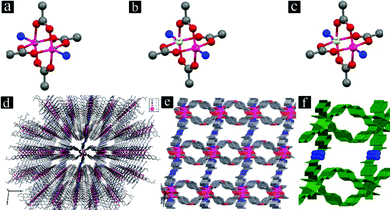
The 3D framework of [Zn(oba)(4-bpdh)0.5]n·1.5DMF (TMU-5) is built up from a Zn2(oba)4 paddle-wheel secondary building unit (SBU) (Fig. 2a). Each SBU is linked by oba to form a distorted 44 two-dimensional (2D) network. The 4-bpdh acts as a linker between the paddle-wheel units from two adjacent layers to yield a 3D framework (Fig. 2d). This framework shows narrow channels (aperture size: 4.4 × 6.2 Å, 34.6% void space per unit cell)38 running parallel to the b axis; however, these are interconnected along all three dimensions (Fig. 2e).34
For the synthesis of mixed Zn(II)/Cd(II) MOFs, we examined various ratios of metal salts of Zn(II) and Cd(II). Using both metal salts, Zn(NO3)2·6H2O and Cd(NO3)2·4H2O, with different ratios results in production of two mixed-metal MOFs. Interestingly, mixed-metal MOFs, [Cd0.15Zn0.85(oba)(4-bpdh)0.5]n·1.5DMF (TMU-5(Cd 15%)) and [Cd0.3Zn0.7(oba)(4-bpdh)0.5]n·1.5DMF (TMU-5(Cd 30%), (Table S1†) are isostructural with TMU-5. Similar to TMU-5, these new mixed-metal MOFs are also based on binuclear paddlewheel Zn(II) or Cd(II) units (Fig. 2b and c), in which four carboxylate O atoms from four adjacent oba ligands form an approximate equatorial square plane (Zn–O or Cd–O carboxylate distances: 2.028–2.038 Å and 2.049–2.077 Å, respectively). The coordination environment of each Zn(II) or Cd(II) center is completed by one N atom from 4-bpdh in the axial position (mean Zn–N and Cd–N distances: 2.026 Å and 2.06 Å, respectively). The separation of the Zn(II) or Cd(II) centers within the paddle-wheel units are 2.930 Å and 2.969 Å, respectively. As in TMU-5, the orientation of the non-linear (C–O–C = 118.57° and 117.85° in TMU-5(Cd 15%) and TMU-5(Cd 30%), respectively, Table S2†) dicarboxylate oba ligands around the paddle-wheel Zn(II) or Cd(II) units leads to the formation of 2D layers pillared by 4-bpdh ligands to yield a 3D framework (Fig. 2d). TMU-5(Cd 15%) and TMU-5(Cd 30%), also possess narrow channels (aperture sizes 4.5 × 6.3 Å and 4.6 × 6.4 Å, taking into account the van der Waals radii, with 34.6% and 35.7% void spaces per unit cell, respectively)38 running parallel to the b axis; however, again these are interconnected along the three directions (Fig. 2e). In all three MOFs, the surfaces of pores are functionalized with azine groups (Fig. 2f shown in blue). The N2 adsorption data at 77 K shows that TMU-5(Cd 15%) and TMU-5(Cd 30%) are porous to N2 with Brunauer–Emmett–Teller (BET) surface areas of 447.3 and 547.9 m2 g−1, respectively (Fig. S3†).
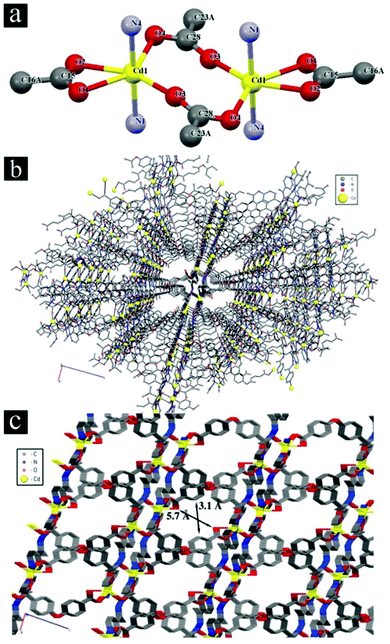
When Cd(NO3)2·4H2O was the only metal salt used, a new MOF was obtained in which the structure was different from the three previous isostructural MOFs. The structure of [Cd(oba)(4-bpdh)]n·1DMF (TMU-7) is built up from a binuclear cadmium(II) unit, Cd2(CO2)4N4, with both metal centers having distorted octahedral geometry and coordinated to four carboxylate O atoms (O1, O2, O3, and O4 with Cd–Ocarboxylate distances of 2.531 Å, 2.283 Å, 2.239 Å and 2.249 Å, respectively) from three adjacent oba ligands and two N atoms (N1 and N4 with Cd–N distances of 2.307 Å and 2.314 Å, respectively) from two 4-bpdh ligands (Fig. 3a). Each non-linear (C–O–C = 116.60(15)°) dicarboxylate oba ligand binds three consecutive Cd(II) centers from two different units where one carboxylate group of an oba ligand adopts a chelating bidentate mode, whereas the other adopts a bridging bidentate mode. The V-shaped coordination of the oba ligand in cooperation with the linear 4-bpdh results in a three-dimensional framework (Fig. 3b) containing nano-channels (aperture size: 3.1 × 5.7 Å, taking into account the van der Waals radii, with 23.5% void space per unit cell)38 running parallel to the b axis (Fig. 3c). The N2 adsorption isotherm collected at 77 K of the mechanosynthesized TMU-7 shows a BET surface area of 243.6 m2 g−1 (Fig. S3d†).
To examine the thermal stability of all MOFs thermogravimetric analyses (TGA) were carried out between 25 and 600 °C. The TGA curves of TMU-5, TMU-5(Cd 15%) and TMU-5(Cd 30%) each show a plateau in the range of 25–100 °C followed by a continuous weight loss of 18%, 19.7% and 18.8%, respectively, (expected: 19.9%, 19.6% and 19.3%, respectively) up to 238 °C, which can be ascribed to removal of guest DMF molecules (Fig. S4a†). TG data suggests that there are 1.5 DMF guest molecules present in both TMU-5(Cd 15%) and TMU-5(Cd 30%). TMU-5 and TMU-5(Cd 15%) are thermally stable up to 290 °C, above which they begin to decompose. TMU-5(Cd 30%) is stable up to 340 °C and decomposes above this point. The TGA curve of TMU-7 shows a continuous weight loss of 10.7% (expected: 10.7%) up to 242 °C, which can be ascribed to removal of guest DMF molecules. TMU-7 is thermally stable up to 284 °C and then begins to decompose (Fig. S4b†).
The absorption property is one of the most important properties to characterize the optical property of the semiconductor. The UV-Vis diffuse reflectance spectra of MOFs are shown in Fig. S5† and Table 1. It can be observed that TMU-5 has an absorption edge occurring at about 585 nm. The substitution of certain percentages of Cd has no significant effect on the absorption edge, so that negligible shift to longer wavelength is observed. For TMU-7 shift to longer wavelength is observed, inducing additional broadening of the visible region.
| MOF | T dark (min) | Adsorption (%) | UV | Visible | Band gap (eV) | Void space (%) | BET (m2 g−1) | ||
|---|---|---|---|---|---|---|---|---|---|
| T Removal (min) | % Removala | T Removal (min) | % Removala | ||||||
| a % Removal = the percentage removal at which the photocatalyst shows a maximum removal after adsorption. b BET value for mechanosynthesized TMU-7. | |||||||||
| TMU-5 | 30 | 31.5 | 120 | 80.4 | 120 | 69.3 | 2.12 | 34.6 | 400.8 |
| TMU-5(Cd 15%) | 30 | 33.3 | 120 | 82.5 | 120 | 73.5 | 2.13 | 34.6 | 447.3 |
| TMU-5(Cd 30%) | 30 | 33.5 | 120 | 87.6 | 120 | 78 | 2.14 | 35.7 | 547.9 |
| TMU-7 | 25 | 9.1 | 120 | 33.3 | 120 | 15.5 | 2.08 | 23.5 | 243.6b |
Water stability test of the MOFs
Similar to TMU-5,39 the as-synthesized TMU-5(Cd 15%), TMU-5(Cd 30%) and TMU-7 were soaked in water to evaluate their stability in water. The XRD patterns are consistent confirming that the structure has a high water-stability (Fig. S6†).Evaluation of photocatalytic activity
The influence of initial concentration of the phenol solution on the photocatalytic degradation is a significant aspect of the study. The initial concentrations of phenol are selected in the ranges of 25–100 ppm and 10–70 ppm under UV and visible light, respectively, in the presence of TMU-5, TMU-5(Cd 30%) and TMU-7 for 2 h (Fig. S7†). The experiments were undertaken relative to a blank (without catalyst but in the presence of light), which showed no change in the concentration of phenol. Under UV light, photocatalytic efficiencies of TMU-5 and TMU-5(Cd 30%) are 2.6 times greater than that of TMU-7. The percentage degradation of phenol decreases as the initial concentration of pollutant solution increases. Because of acceptable efficiencies of TMU-5 and TMU-5(Cd 30%) in the presence of 50 ppm phenol, further experiments were carried out on this concentration under UV light. Under visible light, for 10 ppm of phenol solution, only adsorption occurs. The maximum percentage degradation of phenol is observed in the presence of 25 ppm of pollutant. The percentage degradation starts to decrease in the presence of 40–70 ppm of phenol. As the initial concentration of pollutant increases, more and more organic substances are adsorbed on the surface of the MOF. The scarcity of active sites in the photocatalyst system cause little adsorption of hydroxyl ions, which leads to a decrease in the generation of hydroxyl radicals. Moreover, the photons get intercepted before they can reach the catalyst surface. Consequently, percentage degradation is reduced.In the following, photodegradation of phenol is conducted as a function of the irradiation time over various MOFs at natural pH (ca. 6.5) with initial phenol concentration (50 ppm) in the presence of 0.5 g L−1 of photocatalyst under UV light (Fig. 4 and Table 1). As shown, there is no significant change in the concentration curve with time when the photocatalyst is absent, which means phenol is very stable without photocatalysis even under UV light. The adsorption degrees of the three MOFs, including TMU-5, TMU-5(Cd 15%) and TMU-5(Cd 30%), are almost similar, whereas TMU-7 it is approximately 3.5 times lower than these. For TMU-5, the maximum percentage degradation of phenol is about 80.4% under UV light irradiation for 120 min. Substitution of Cd instead of Zn in two other MOFs leads to increase in their photocatalytic efficiencies under the same conditions. The maximum percentage degradation of phenol in the presence of TMU-7 is 33.3%, i.e., 2.6 times lower than that for the best photocatalyst (TMU-5(Cd 30%)) (Table 1). There is negligible change in the phenol concentration in solution with TMU-7 by increasing the irradiation time up to 180 min.
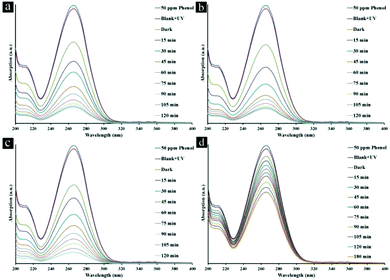 | ||
| Fig. 4 Absorption spectra of a solution of 50 ppm phenol in the presence of (a) TMU-5, (b) TMU-5(Cd 15%) (c) TMU-5(Cd 30%) and d) TMU-7 under UV light irradiation for 120 min. | ||
The photocatalytic efficiency of MOFs in the presence of 25 ppm phenol under visible light irradiation for 2 h was also investigated (Fig. S8† and Table 1). TMU-5(Cd 30%) has the best efficiency among the three MOFs at about 78% for 2 h.
The results indicate that the highest percentage degradations of 87.6% (87.6 mg g−1, 0.92 mmol g−1) and 78% (78 mg g−1, 0.83 mmol g−1) are observed for the TMU-5 photocatalyst containing 30% Cd after 120 min under UV and visible irradiations, respectively. In comparison, MOF-5 and Degussa P-25 TiO2 can degrade a maximum of 10 mg g−1 (0.11 mmol g−1) and 4.2 mg g−1 (0.05 mmol g−1) of phenol after 180 min, respectively.40
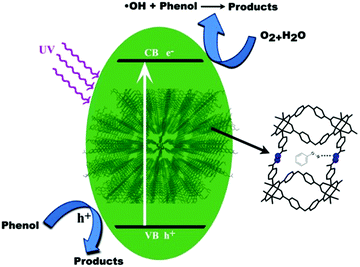
Photocatalytic performance could be attributed to the adsorptive affinity dependent on the surface area and pore volume, the value of the band gap and the difference in the rate of recombination.41–43 The general mechanism involved for degradation of phenol in the presence of the four MOFs could be explained by considering the HOMO, the filled d-orbital (d10 in Zn2+ and Cd2+), and the lowest LUMO, the free s-orbital, as well as LUMOs of the organic linkers.44 Upon light irradiation, electrons on the VB composed of O, C and N 2p orbitals jump to the CB and produce holes (h+) in the VB. Positive holes could either oxidize the adsorbed organic contaminants directly or produce very reactive hydroxyl radicals (OH˙). The electron in the CB reduces the adsorbed oxygen on the photocatalyst. The formed superoxide radicals further react with pollutant, leading to the final products.40,44,45
Formation of hydroxyl radicals was confirmed by the photoluminescence method.46–48 Terephthalic acid as the probe molecule captures hydroxyl radicals and produces highly fluorescent 2-hydroxyterephthalic acid, which emits at 425 nm upon UV excitation (Fig. S9†).
Regarding the structures of MOFs and the results obtained from crystallography, DRS UV-Vis shows that the structures of TMU-5, TMU-5(Cd 15%) and TMU-5(Cd 30%) are almost similar. Therefore, the similarity of photocatalytic efficiency of the three MOFs (TMU-5 and its Cd derivatives) is probably attributed to the similarity in their structural properties, including void spaces, surface areas, band gaps and pores decorated with basic azine groups of the 4-bpdh ligand. These basic pore walls cause increasing adsorptive affinity of the acidic pollutant by creating an interaction between HO- of phenol with the azine group that finally leads to greater photocatalytic efficiency. In the case of TMU-7, the lower value of void space and BET surface area and the inaccessibility of azine groups decreases the adsorptive affinity and photocatalytic efficiency (Scheme 1).
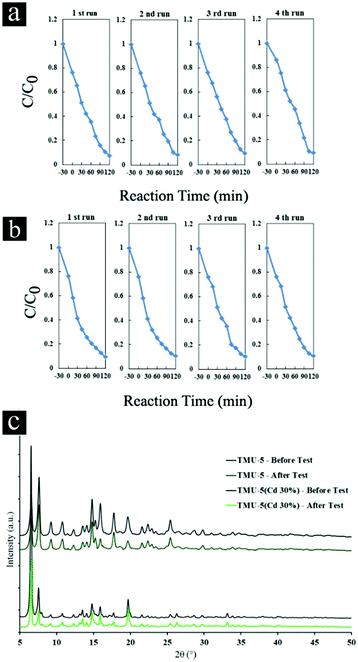
In addition to photocatalytic efficiency, stability of photocatalysts is also very important for practical applications. The circulating runs in the photocatalytic degradation of phenol were carried out in presence of TMU-5 and TMU-5(Cd 30%) under UV light (Fig. 5a and b). It was found that the photocatalytic activity of TMU-5 and TMU-5(Cd 30%) do not exhibit a significant loss after four recycles for the photodegradation of phenol, confirming that these MOFs are photostable during the photocatalytic oxidation of pollutant molecules. XRD patterns of the MOF photocatalysts before and after repeating the reaction for four cycles obviously prove the structure of the photocatalyst remains intact (Fig. 5c).
To determine the kinetics of photocatalytic degradation of phenol in the solutions suspended on the four MOFs, different types of kinetics orders are attempted expressing the reaction kinetics under UV and visible light (Tables S3, S4 and Fig. S10†). Each correlation coefficient was calculated from the kinetics equation, where R0, R1 and R2 represent the correlation coefficients of zero-, first- and second-order rate equations, respectively. Comparison between these correlation coefficients shows that the Langmuir–Hinshelwood (L–H) model is successfully used to describe the relationship between the photocatalytic degradation rate and the initial concentration of organic pollutant in the photocatalytic degradation. First-order rate constants, evaluated from the slopes of the ln(Ct/C0) vs. time plots and the half-life of the degraded organic compounds can then be easily calculated by  .
.
Moreover, the order of k1 values and t1/2 are in good agreement with the results of photocatalytic degradation of phenol in Table 1.
Kinetics of the total mineralization of phenol have been followed using the chemical oxygen demand (COD) technique for the best photocatalyst (TMU-5(Cd 30%)). The COD value of the initial phenol solution significantly decreased after 5 h (86% of the initial phenol), indicating the high potential of TMU-5(Cd 30%) in the photodegradation process (Fig. S11†).
These MOFs were immersed in water for 7 days for evaluation of Cd2+ ion toxicity. ICP study shows that the concentrations of Cd2+ in water were 2, 5 and 30 ppb for TMU-5(Cd 15%), TMU-5(Cd 30%) and TMU-7, respectively. This may be attributed to the release of unreacted metal ions that may be trapped in the MOFs.
Conclusions
Three new MOFs, [Cd0.15Zn0.85(oba)(4-bpdh)0.5]n·1.5DMF (TMU-5(Cd 15%)), [Cd0.3Zn0.7(oba)(4-bpdh)0.5]n·1.5DMF (TMU-5(Cd 30%)) and [Cd(oba)(4-bpdh)]n·1DMF (TMU-7) were successfully synthesized. The two mixed-metal MOFs have the same structure as TMU-5, which has been previously reported. These MOFs were obtained by simultaneously using Zn(II) and Cd(II) salts, while another new Cd(II)-based MOF with the same components but a different framework was obtained using only Cd(II) salt. It can be noted that these MOFs were applied as UV- and/or visible light-driven photocatalysts and show good stability to photocatalysis. Furthermore, Zn-based MOFs (TMU-5, TMU-5(Cd 15%) and TMU-5(Cd 30%)) are photocatalytically more active than the Cd-based MOF (TMU-7) because of their greater surface area, accessibility of azine groups and more adsorptive affinity, which is promising for applications in water detoxification. In addition, phenol degradation in the solution obeys first-order reaction kinetics.Acknowledgements
Support of this investigation by Tarbiat Modares University and Iran National Science Foundation (INSF) is gratefully acknowledged.Notes and references
- T. Zhang and W. Lin, Chem. Soc. Rev., 2014, 43, 5982–5993 RSC.
- T. Toyao, M. Saito, Y. Horiuchi, K. Mochizuki, M. Iwata, H. Higashimura and M. Matsuoka, Catal. Sci. Technol., 2013, 3, 2092–2097 CAS.
- C. G. Silva, A. Corma and H. Garcia, J. Mater. Chem., 2010, 20, 3141–3156 RSC.
- Z.-T. Yu, Z.-L. Liao, Y.-S. Jiang, G.-H. Li and J.-S. Chen, Chem. – Eur. J., 2005, 11, 2642–2650 CrossRef CAS PubMed.
- K. G. M. Laurier, F. Vermoortele, R. Ameloot, D. E. De Vos, J. Hofkens and M. B. J. Roeffaers, J. Am. Chem. Soc., 2013, 135, 14488–14491 CrossRef CAS PubMed.
- M. Eddaoudi, D. B. Moler, H. Li, B. Chen, T. M. Reineke, M. O'Keeffe and O. M. Yaghi, Acc. Chem. Res., 2001, 34, 319–330 CrossRef CAS PubMed.
- B. Moulton and M. J. Zaworotko, Chem. Rev., 2001, 101, 1629–1658 CrossRef CAS PubMed.
- E. G. Tulsky and J. R. Long, Chem. Mater., 2001, 13, 1149–1166 CrossRef CAS.
- S. Kitagawa, R. Kitaura and S.-I. Noro, Angew. Chem., Int. Ed., 2004, 43, 2334–2375 CrossRef CAS PubMed.
- N. Stock and S. Biswas, Chem. Rev., 2011, 112, 933–969 CrossRef PubMed.
- A. Kuc, A. Enyashin and G. Seifert, J. Phys. Chem. B, 2007, 111, 8179–8186 CrossRef CAS PubMed.
- M. C. Das, H. Xu, Z. Wang, G. Srinivas, W. Zhou, Y.-F. Yue, V. N. Nesterov, G. Qian and B. Chen, Chem. Commun., 2011, 47, 11715–11717 RSC.
- C.-F. Zhang, L.-G. Qiu, F. Ke, Y.-J. Zhu, Y.-P. Yuan, G.-S. Xu and X. Jiang, J. Mater. Chem. A, 2013, 1, 14329–14334 CAS.
- M. Y. Masoomi, M. Bagheri and A. Morsali, RSC Adv., 2016, 6, 13272–13277 RSC.
- L. Ai, C. Zhang, L. Li and J. Jiang, Appl. Catal., B, 2014, 148–149, 191–200 CrossRef CAS.
- D. L. Murphy, M. R. Malachowski, C. F. Campana and S. M. Cohen, Chem. Commun., 2005, 5506–5508 RSC.
- A. D. Burrows, CrystEngComm, 2011, 13, 3623–3642 RSC.
- J. He, J. Yu, Y. Zhang, Q. Pan and R. Xu, Inorg. Chem., 2005, 44, 9279–9282 CrossRef CAS PubMed.
- S. Nayak, K. Harms and S. Dehnen, Inorg. Chem., 2011, 50, 2714–2716 CrossRef CAS PubMed.
- A. D. Burrows, C. G. Frost, M. F. Mahon, P. R. Raithby, C. L. Renouf, C. Richardson and A. J. Stevenson, Chem. Commun., 2010, 46, 5067–5069 RSC.
- S. R. Caskey and A. J. Matzger, Inorg. Chem., 2008, 47, 7942–7944 CrossRef CAS PubMed.
- S. R. Halper, L. Do, J. R. Stork and S. M. Cohen, J. Am. Chem. Soc., 2006, 128, 15255–15268 CrossRef CAS PubMed.
- M.-H. Zeng, B. Wang, X.-Y. Wang, W.-X. Zhang, X.-M. Chen and S. Gao, Inorg. Chem., 2006, 45, 7069–7076 CrossRef CAS PubMed.
- C. Livage, P. M. Forster, N. Guillou, M. M. Tafoya, A. K. Cheetham and G. Férey, Angew. Chem., Int. Ed., 2007, 46, 5877–5879 CrossRef CAS PubMed.
- Y. Wang, B. Bredenkotter, B. Rieger and D. Volkmer, Dalton Trans., 2007, 689–696 RSC.
- S. Das, H. Kim and K. Kim, J. Am. Chem. Soc., 2009, 131, 3814–3815 CrossRef CAS PubMed.
- G. Férey, F. Millange, M. Morcrette, C. Serre, M.-L. Doublet, J.-M. Grenèche and J.-M. Tarascon, Angew. Chem., Int. Ed., 2007, 46, 3259–3263 CrossRef PubMed.
- L. Xie, S. Liu, C. Gao, R. Cao, J. Cao, C. Sun and Z. Su, Inorg. Chem., 2007, 46, 7782–7788 CrossRef CAS PubMed.
- J. H. Yoon, S. B. Choi, Y. J. Oh, M. J. Seo, Y. H. Jhon, T.-B. Lee, D. Kim, S. H. Choi and J. Kim, Catal. Today, 2007, 120, 324–329 CrossRef CAS.
- A. Corma, H. García and F. X. Llabrés i Xamena, Chem. Rev., 2010, 110, 4606–4655 CrossRef CAS PubMed.
- R. Kitaura, K. Seki, G. Akiyama and S. Kitagawa, Angew. Chem., Int. Ed., 2003, 42, 428–431 CrossRef CAS PubMed.
- P. Mahata, M. Prabu and S. Natarajan, Cryst. Growth Des., 2009, 9, 3683–3691 CAS.
- M. Y. Masoomi, S. Beheshti and A. Morsali, J. Mater. Chem. A, 2014, 2, 16863–16866 CAS.
- M. Y. Masoomi, K. C. Stylianou, A. Morsali, P. Retailleau and D. Maspoch, Cryst. Growth Des., 2014, 14, 2092–2096 CAS.
- D. M. Ciurtin, Y.-B. Dong, M. D. Smith, T. Barclay and H.-C. zur Loye, Inorg. Chem., 2001, 40, 2825–2834 CrossRef CAS PubMed.
- G. M. Sheldrick, SHELX97 program for Crystal Structure Solution and Refinement, University of Göttingen, Göttingen, Germany, 1997 Search PubMed.
- Chemical Oxygen Demand (COD), in Open Reflux Method, American Public Health Association, 1997, vol. 5220, p. 12 Search PubMed.
- A. L. Spek, J. Appl. Crystallogr., 2003, 36, 7–13 CrossRef CAS.
- E. Tahmasebi, M. Y. Masoomi, Y. Yamini and A. Morsali, Inorg. Chem., 2015, 54, 425–433 CrossRef CAS PubMed.
- M. Alvaro, E. Carbonell, B. Ferrer, F. X. Llabrés i Xamena and H. Garcia, Chem. – Eur. J., 2007, 13, 5106–5112 CrossRef CAS PubMed.
- Y. Hou, L. Wu, X. Wang, Z. Ding, Z. Li and X. Fu, J. Catal., 2007, 250, 12–18 CrossRef CAS.
- Q. Zhang, Y. Li, E. A. Ackerman, M. Gajdardziska-Josifovska and H. Li, Appl. Catal., A, 2011, 400, 195–202 CrossRef CAS.
- H. Li, S. Yin, Y. Wang and T. Sato, Appl. Catal., B, 2013, 132–133, 487–492 CrossRef CAS.
- J. Gascon, M. D. Hernández-Alonso, A. R. Almeida, G. P. M. van Klink, F. Kapteijn and G. Mul, ChemSusChem, 2008, 1, 981–983 CrossRef CAS PubMed.
- G. Crini, Bioresour. Technol., 2006, 97, 1061–1085 CrossRef CAS PubMed.
- K.-I. Ishibashi, A. Fujishima, T. Watanabe and K. Hashimoto, Electrochem. Commun., 2000, 2, 207–210 CrossRef CAS.
- Z. Shen, S. Sun, W. Wang, J. Liu, Z. Liu and J. C. Yu, J. Mater. Chem. A, 2015, 3, 3285–3288 CAS.
- F. Wang, W. K. H. Ng, J. C. Yu, H. Zhu, C. Li, L. Zhang, Z. Liu and Q. Li, Appl. Catal., B, 2012, 111–112, 409–414 CrossRef CAS.
Footnotes |
| † Electronic supplementary information (ESI) available. CCDC 1007257–1007259. For ESI and crystallographic data in CIF or other electronic format see DOI: 10.1039/c6qi00067c |
| ‡ These authors contributed equally to this work. |
| This journal is © the Partner Organisations 2016 |

