3d transition metal complexes with a julolidine–quinoline based ligand: structures, spectroscopy and optical properties†
Daniel J.
Fanna
a,
Yingjie
Zhang
*b,
Li
Li
a,
Inna
Karatchevtseva
b,
Nicholas D.
Shepherd
ab,
Abdul
Azim
a,
Jason R.
Price
c,
Janice
Aldrich-Wright
a,
Jason K.
Reynolds
a and
Feng
Li
*a
aSchool of Science and Health, Western Sydney University, Locked Bag 1797, Penrith, NSW 2751, Australia. E-mail: feng.li@westernsydney.edu.au
bAustralian Nuclear Science and Technology Organisation, Locked Bag 2001, Kirrawee DC, NSW 2232, Australia. E-mail: yzx@ansto.gov.au
cAustralian Synchrotron, 800 Blackburn Road, Clayton, VIC 3168, Australia
First published on 7th December 2015
Abstract
A Schiff base type ligand with the combination of the julolidine and the quinoline groups has been reported as a potential chemosensor in detecting the cobalt(II) ion among other heavy and transition metal ions in solution. However, no crystal structure of such a ligand with any metal ions has been reported. In this work, its complexation with 3d transition metal ions (Mn(II), Co(II), Ni(II), Cu(II) and Zn(II)) has been investigated with five new complexes being synthesised, and spectroscopically and structurally characterised. [Mn2L2(CH3OH)2(CH3COO)2]·CH3OH (1) {HL (C22H21N3O) = ((E)-9-((quinolin-8-ylimino)methyl)-1,2,3,5,6,7-hexahydropyrido[3,2,1-ij]quinolin-8-ol)} shows a dinuclear structure with two Mn![[thin space (1/6-em)]](https://www.rsc.org/images/entities/char_2009.gif) :
:![[thin space (1/6-em)]](https://www.rsc.org/images/entities/char_2009.gif) L
L![[thin space (1/6-em)]](https://www.rsc.org/images/entities/char_2009.gif) :
:![[thin space (1/6-em)]](https://www.rsc.org/images/entities/char_2009.gif) acetate (1
acetate (1![[thin space (1/6-em)]](https://www.rsc.org/images/entities/char_2009.gif) :
:![[thin space (1/6-em)]](https://www.rsc.org/images/entities/char_2009.gif) 1
1![[thin space (1/6-em)]](https://www.rsc.org/images/entities/char_2009.gif) :
:![[thin space (1/6-em)]](https://www.rsc.org/images/entities/char_2009.gif) 1) units bridged by two methanol molecules. [CoL2(NO3)]·CH3OH·H2O (2) and [NiL2]·H2O (3) exhibit mononuclear structures with a Co
1) units bridged by two methanol molecules. [CoL2(NO3)]·CH3OH·H2O (2) and [NiL2]·H2O (3) exhibit mononuclear structures with a Co![[thin space (1/6-em)]](https://www.rsc.org/images/entities/char_2009.gif) :
:![[thin space (1/6-em)]](https://www.rsc.org/images/entities/char_2009.gif) L or Ni
L or Ni![[thin space (1/6-em)]](https://www.rsc.org/images/entities/char_2009.gif) :
:![[thin space (1/6-em)]](https://www.rsc.org/images/entities/char_2009.gif) L ratio of 1
L ratio of 1![[thin space (1/6-em)]](https://www.rsc.org/images/entities/char_2009.gif) :
:![[thin space (1/6-em)]](https://www.rsc.org/images/entities/char_2009.gif) 2. [CuL(CH3COO)]·1/3CH3OH (4) demonstrates a mononuclear structure and the Cu ion has a square planar coordination polyhedron with a L ligand and a highly non-symmetrical acetate anion. [Zn2L2(CH3COO)2]·CH3OH (5) has two types of dinuclear units, both with two ZnL units bridged by two acetate anions but in three different bridging coordination modes. Their vibrational modes, absorption and photoluminescence properties have also been investigated.
2. [CuL(CH3COO)]·1/3CH3OH (4) demonstrates a mononuclear structure and the Cu ion has a square planar coordination polyhedron with a L ligand and a highly non-symmetrical acetate anion. [Zn2L2(CH3COO)2]·CH3OH (5) has two types of dinuclear units, both with two ZnL units bridged by two acetate anions but in three different bridging coordination modes. Their vibrational modes, absorption and photoluminescence properties have also been investigated.
Introduction
In the last few decades, colorimetric supramolecular chemistry has attracted considerable attention due to the promise of optical property based applications in new technological fields, e.g. chemosensors, fluorescent probes, biomedical imaging, dye-sensitised solar cells, and phase-change optical data storage.1 The success of these applications is fundamentally reliant on the interactions between colorimetric molecules and external stimuli, such as guest molecules, temperature, pressure, and/or light.2 Exploration of the systems controlling these interactions is vital for an in-depth understanding of how molecular forces mediate the characteristics within a supramolecular system.3 Subsequently, this knowledge has the potential to be utilised in future syntheses to accurately design a supramolecular system for targeted applications, through directed self-assembly techniques.4The julolidine functional group is well known for its visible and fluorescence optical properties, while acting as a strong signal unit.5 Consequently, it has become a popular functional group in the colorimetric studies of metallo-supramolecular systems. The versatility of julolidine has been observed in many chemosensor systems which exhibit selective molecular recognition often for a metal ion6 or anion.7 In addition, julolidine exhibits fluorescence properties in nature which can be explored in the application of fluorescence sensors.8,9
Despite strong research effort into julolidine systems, only limited examples of material characterisation involving solid state techniques such as single crystal X-ray diffraction, electron microscopy and vibrational spectroscopy have been utilised.10
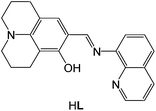
The Schiff base ligand, HL (see below), consisting of 8-hydroxyjulolidine-9-carboxylaldehyde with 8-aminoquinoline, has been reported by Kim and coworkers.11 Previous studies have demonstrated that such a ligand has the potential as a Co(II) chemosensor, and a complex of CoL2 in solution was confirmed by electrospray ionisation-mass spectroscopy (ESI-MS).11 However, no crystal structure for any metals with HL is currently available. Clearly there is an urgent need to fill an important niche of structural investigations between solution and solid state studies. More importantly, the structural knowledge will, in turn, provide direct input into the ligand design for future chemosensors towards the potential detection of transition and heavy metal ions.
![[thin space (1/6-em)]](https://www.rsc.org/images/entities/char_2009.gif) :
:![[thin space (1/6-em)]](https://www.rsc.org/images/entities/char_2009.gif) L/Ni
L/Ni![[thin space (1/6-em)]](https://www.rsc.org/images/entities/char_2009.gif) :
:![[thin space (1/6-em)]](https://www.rsc.org/images/entities/char_2009.gif) L ratio of 1
L ratio of 1![[thin space (1/6-em)]](https://www.rsc.org/images/entities/char_2009.gif) :
:![[thin space (1/6-em)]](https://www.rsc.org/images/entities/char_2009.gif) 2 for [CoL2(NO3)]·CH3OH·H2O (2) and [NiL2]·H2O (3); a mononuclear structure in the form of Cu(L)(OAc) for [CuL(CH3COO)]·1/3CH3OH (4); and two types of dinuclear units, both with pairs of Zn(L)(OAc) units bridged by the two acetate anions but in three different bridging coordination modes for [Zn2L2(CH3COO)2]·CH3OH (5).
2 for [CoL2(NO3)]·CH3OH·H2O (2) and [NiL2]·H2O (3); a mononuclear structure in the form of Cu(L)(OAc) for [CuL(CH3COO)]·1/3CH3OH (4); and two types of dinuclear units, both with pairs of Zn(L)(OAc) units bridged by the two acetate anions but in three different bridging coordination modes for [Zn2L2(CH3COO)2]·CH3OH (5).
Experimental section
Materials
All reagents were purchased from commercial sources and used without further purification.Physical measurements
The 1H NMR spectrum was recorded on a Bruker 300 MHz spectrometer. Scanning electron microscopy-electron dispersive spectroscopy (SEM-EDS) was conducted using a Zeiss Ultra Plus SEM (Carl Zeiss NTS GmbH, Oberkochen, Germany) under an accelerating voltage of 20 kV. Electrospray ionisation high resolution mass spectroscopy (ESI-HRMS) analysis was conducted utilising a Waters Xevo QToF/nanoaquity UPLC in positive ion mode. Raman spectra were recorded on a Bruker Senterra using the OPUS software and excitation laser 785 nm in the range of 2000–100 cm−1. Absorption spectra were collected using an Agilent Cary 100 spectrophotometer. Fluorescent emission measurements were conducted on a Shimadzu RF-5301PC instrument with a Xenon lamp and an excitation wavelength of 470 nm. Solid state fluorescence emission spectra were recorded on an Olympus FluoView™ FV1000 Confocal Laser Scanning Microscope, with an external Argon Ion laser (488 nm).Ligand synthesis
The synthesis of ligand (HL) involved Schiff base condensations using an optimisation of a literature method.11 8-Hydroxyjulolidine-9-carboxaldehyde (500 mg, 2.3 mmol) was dissolved in 15 mL acetonitrile. To this solution, an acetonitrile solution of 8-aminoquinoline (330 mg, 2.3 mmol) in 15 mL was added dropwise. After that, a few milligrams of p-toluenesulfonic acid was added as a catalyst. This reaction was conducted under reflux conditions and a nitrogen atmosphere for 18 hours. Once reflux had concluded, the solution underwent a hot filtration to remove any solid impurities. The filtrate was left to evaporate, additional CH3CN was added and a yellow precipitate was collected. This process was repeated three times, with an approximately 60% yield. 1H NMR (300 MHz, CDCl3): δ 9.01 (q, 1H), 8.36 (s, 1H), 8.13 (q, 1H), 7.54 (d, 3H), 7.44 (q, 1H), 6.74 (s, 1H), 3.26(t, 4H, julolidine – aliphatic ring), 3.85 (t, 2H, julolidine – aliphatic ring), 2.65 (t, 2H, julolidine – aliphatic ring), 1.95 (m, 4H, julolidine – aliphatic ring). ESI-HRMS (positive-ion detection, MeOH): m/z = 344.1767 (calc. 344.1763 for [HL + H]+).Complex synthesis
The complexation of HL with Mn(II), Co(II), Ni(II), Cu(II) and Zn(II) ions was carried out using metal acetates. As the procedures for preparing the five complexes are essentially the same, the general preparation of complexes 1–5 is detailed below.HL (100 mg, 0.29 mmol) was dissolved in 15 mL of methanol. The required metal (Mn(II), Co(II), Ni(II), Cu(II) and Zn(II)) acetate (0.145 mmol) in 15 mL of methanol was slowly added to the above ligand solution. The mixture was then heated at 70 °C for 90 minutes. Hot filtration was immediately conducted to remove any solid impurities. The products 1–5 were obtained by slow evaporation. The single crystals of 1, 3–5 used for X-ray crystallography were obtained by slow diffusion of diethyl ether vapour into the resulting complexes in MeOH. Unfortunately, the single crystal of complex 2 in the acetate form can't be obtained, although several crystallisation methods have been performed. While a single crystal of 2 was successfully obtained using Co(II) nitrate instead of acetate with the addition of triethylamine for deprotonation of HL.
1: Yield: 62%. UV/Vis (MeOH): λmax/nm = 468, Raman (solid state, laser = 785 nm): 1563, 1494, 1467, 1371, 1302, 1224, 1090, 807 cm−1. ESI-HRMS (positive-ion detection, MeOH): m/z = 739.2599 (calc. 739.2593 for [MnL2]+); 397.1007 (calc. 397.0987 for [MnL]+).
2: Yield: 40%. UV/Vis (MeOH): λmax/nm = 495, Raman (solid state, laser = 785 nm): 1615, 1563, 1493, 1467, 1371, 1302, 1220, 1090, 520, cm−1; ESI-HRMS (positive-ion detection, MeOH): m/z = 743.2559 (calc. 743.2545 for [CoL2]+); 401.0951 (calc. 401.0938 for [CoL]+).
3: Yield: 73%. UV/Vis (MeOH): λmax/nm = 480, Raman (solid state, laser = 785 nm): 1617, 1564, 1490, 1463, 1418, 1372, 1298, 1264, 1233, 1088, 1020, 960, 803, 502 cm−1. ESI-HRMS (positive-ion detection, MeOH): m/z = 743.2646 (calc. 743.2644 for [NiL2 + H]+); 400.0950 (calc. 400.0960 for [NiL]+).
4: Yield: 46%. UV/Vis (MeOH): λmax/nm = 468, Raman (solid state, laser = 785 nm): 1567, 1494, 1467, 1376, 1320, 1298, 1273, 1232, 1093, 1027, 961, 807, 519, 490 cm−1. ESI-HRMS (positive-ion detection, MeOH): m/z = 405.0913 (calc. 405.0902 for [CuL]+).
5: Yield: 66%. UV/Vis (MeOH): λmax/nm = 468, Raman (solid state, laser = 785 nm): 1565, 1494, 1466, 1428, 1373, 1301, 1236, 1091, 1065, 969, 896, 829, 806, 635, 505, 442, 316 cm−1. ESI-HRMS (positive-ion detection, MeOH): m/z = 406.0902 (calc. 406.0898 for [ZnL]+).
Single crystal X-ray diffraction
The single crystal X-ray diffraction measurements for complexes 1–5 were carried out on the MX1 beamline at the Australian Synchrotron. The diffraction data were collected using Si<111> monochromated synchrotron X-ray radiation (λ = 0.71074) at 100(2) K with BlueIce software12 and were corrected for Lorentz and polarization effects using the XDS software.13 An empirical absorption correction was then applied using SADABS.14 The structures were solved by direct methods and the full-matrix least-squares refinements were carried out using a suite of the SHELX program15via the Olex2 interface.16 All non-hydrogen atoms were located from the electron density maps and refined anisotropically. Hydrogen atoms bound to carbon atoms were added in the ideal positions and refined using a riding model. The refinement of 4 revealed that one (Cu3) of the three distinguished monomeric units has a carbon atom at the julolidine side disordered in two equal positions. In addition, the carboxylate O atom occupying one of the square positions deviates from the plane. Consequently, the relatively higher negative residue density at Cu3 causes several alerts at the B level. Furthermore, the data completeness for 4 is a bit low due to its crystallization in the low symmetry space group and the crystal suffered gradual radiation damage which only allows one circle data collection possible. All potential hydrogen bonds were calculated using PLATON.17Results and discussion
Synthesis and characterization
Ligand HL was prepared by optimising a literature procedure.11 The 1H NMR spectrum (Fig. S1, ESI†) and electrospray ionization high resolution mass spectrometry (ESI-HRMS) (Fig. S2, ESI†) results were consistent with the proposed structure of HL. Complexes 1–5 were prepared by reactions of metal acetates and HL in methanol in a ratio of 1![[thin space (1/6-em)]](https://www.rsc.org/images/entities/char_2009.gif) :
:![[thin space (1/6-em)]](https://www.rsc.org/images/entities/char_2009.gif) 2. Although the extra ligand has been applied for all reactions, only Ni(II) and Co(III) complexes can be obtained in the formula of ML2 in the solid state. In solution, the ESI-HRMS results (Fig. S3, 6, 9, 12 and 14, ESI†) easily revealed major peaks of ML2 for complexes 1, 2 and 3, and ML for complexes 3, 4 and 5. A few minor fragments of ML for 1 and 2 were also identified (Fig. S3 and 6, ESI†). The appropriate isotope patterns for their complexes were observed (Fig. S4, 5, 7, 8, 10, 11, 13 and 15, ESI†) and the isotopic distributions for ML or ML2 are in great agreement with their calculated patterns. In addition, SEM-EDS analysis confirmed the presence of C, N, O and Mn in 1; C, N, O, and Co in 2; C, N, O and Ni in 3; C, N, O, and Cu in 4; and C, N, O, and Zn in 5 (Fig. S16–S20, ESI†).
2. Although the extra ligand has been applied for all reactions, only Ni(II) and Co(III) complexes can be obtained in the formula of ML2 in the solid state. In solution, the ESI-HRMS results (Fig. S3, 6, 9, 12 and 14, ESI†) easily revealed major peaks of ML2 for complexes 1, 2 and 3, and ML for complexes 3, 4 and 5. A few minor fragments of ML for 1 and 2 were also identified (Fig. S3 and 6, ESI†). The appropriate isotope patterns for their complexes were observed (Fig. S4, 5, 7, 8, 10, 11, 13 and 15, ESI†) and the isotopic distributions for ML or ML2 are in great agreement with their calculated patterns. In addition, SEM-EDS analysis confirmed the presence of C, N, O and Mn in 1; C, N, O, and Co in 2; C, N, O and Ni in 3; C, N, O, and Cu in 4; and C, N, O, and Zn in 5 (Fig. S16–S20, ESI†).
Structure description and discussion
The crystal data and refinement details for complexes 1–5 are summarized in Table 1 and selected bond lengths of the metal coordination polyhedron are listed in Table 2. The asymmetric unit of 1 contains a Mn(II) ion coordinated by a tridentate L ligand, a monodentate acetate and a methanol molecule. The expansion by symmetry suggests that the structure of 1 is constructed with two Mn(L)(OAc) units linked by two bridging methanol molecules forming a dinuclear complex (Fig. 1a). The Mn(II) ion is six-fold coordinated with a chelating L [2.051(2) Å for Mn1–N1, 1.999(2) Å for Mn1–N2 and 1.881(2) Å for Mn1–O1], a monodentate acetate [2.182(2) Å for Mn1–O2] and two bridging methanol molecules [1.896(2) and 2.258(2) Å for Mn1–O4 and Mn1–O4′] making a slightly distorted octahedral coordination environment for the Mn metal centre. The Mn–Mn distance within the dinuclear complex is 3.222(1) Å. The L ligand adopts fairly flat conformation (Fig. 1b). Strong π–π interactions between dinuclear units (Fig. 1b) lead to the formation of one dimensional (1D) columns along the crystallographic c-axis (Fig. 1c). The free terminal carboxylate O atom of the acetate anion is involved in hydrogen bonding with the lattice methanol molecule (Table 3).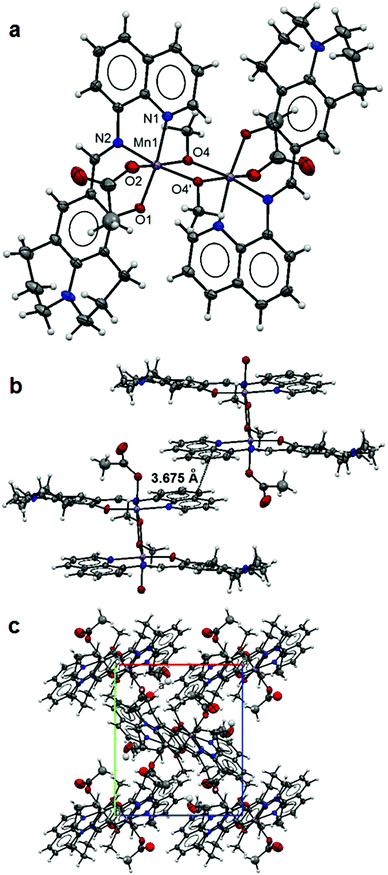 | ||
| Fig. 1 Structure of 1: an ellipsoidal plot (50% probability) of the dinuclear structure (a), π–π interactions between dimer units (b) and a crystal packing view along the c-axis (c). | ||
| Complex | 1 | 2 | 3 | 4 | 5 |
|---|---|---|---|---|---|
| a R 1 = ∑||Fo| − |Fc||/|Fo|. b wR2 = {∑[w(Fo2 − Fc2)2]/∑[w(Fo2)2]}1/2. | |||||
| Formula | C50H53N6O9Mn2 | C45H44N7O6Co | C44H42N6O3Ni | C73H73N9O10Cu3 | C49H50N6O7Zn2 |
| Formula weight | 991.86 | 837.80 | 761.54 | 1427.02 | 965.73 |
| Crystal system | Monoclinic | Monoclinic | Monoclinic | Monoclinic | Triclinic |
| Space group | P21/n | P21/n | C2/c | P21/c |
P![[1 with combining macron]](https://www.rsc.org/images/entities/char_0031_0304.gif) |
| a (Å) | 10.460(2) | 21.900(4) | 20.534(4) | 8.9270(18) | 12.804(3) |
| b (Å) | 12.325(2) | 18.010(4) | 13.565(3) | 23.859(5) | 17.462(3) |
| c (Å) | 18.253(4) | 23.630(5) | 15.695(3) | 29.072(6) | 19.515(4) |
| α (°) | 90 | 90 | 90 | 90 | 87.20(3) |
| β (°) | 94.73(3) | 101.89(3) | 125.65(3) | 98.29(3) | 88.48(3) |
| γ (°) | 90 | 90 | 90 | 90 | 89.90(3) |
| Volume (Å3) | 2345.2(8) | 9120(3) | 3552.3(16) | 6127(2) | 4356.5(15) |
| Z/μ (mm−1) | 2/0.602 | 8/0.429 | 4/0.599 | 4/1.105 | 4/1.162 |
| Min/Max θ [°] | 2.239/30.164 | 1.155/27.924 | 2.005/27.914 | 1.653/25.499 | 1.045/30.069 |
| d calcd (g cm−3) | 1.405 | 1.220 | 1.424 | 1.547 | 1.472 |
| GOF | 1.038 | 1.104 | 1.082 | 1.075 | 1.085 |
Final R1![[thin space (1/6-em)]](https://www.rsc.org/images/entities/char_2009.gif) a [I > 2σ(I)] a [I > 2σ(I)] |
0.0638 | 0.0808 | 0.0340 | 0.0763 | 0.0620 |
Final wR2![[thin space (1/6-em)]](https://www.rsc.org/images/entities/char_2009.gif) b [I > 2σ(I)] b [I > 2σ(I)] |
0.1797 | 0.2523 | 0.0859 | 0.2068 | 0.1658 |
| 1 | |||
| Mn1–O1 | 1.881(2) | Mn1–N1 | 2.051(2) |
| Mn1–N2 | 1.999(2) | Mn1–O2 | 2.182(2) |
| Mn1–O4 | 1.896(2) | Mn1–O4′ | 2.258(2) |
| 2 | |||
| Co1–O1 | 1.881(2) | Co1–N1 | 1.946(3) |
| Co1–N2 | 1.904(3) | Co1–O2 | 1.874(2) |
| Co1–N4 | 1.935(3) | Co1–N5 | 1.907(3) |
| Co2–O3 | 1.878(2) | Co2–N7 | 1.940(3) |
| Co2–N8 | 1.905(3) | Co2–O4 | 1.879(2) |
| Co2–N10 | 1.941(3) | Co2–N11 | 1.900(3) |
| 3 | |||
| Ni1–O1 | 2.028(2) | Ni1–N1 | 2.094(2) |
| Ni–N2 | 2.021(2) | ||
| 4 | |||
| Cu1–O1 | 1.895(3) | Cu1–N1 | 1.985(4) |
| Cu1–N2 | 1.944(4) | Cu1–O2 | 1.948(3) |
| Cu1–O3 | 2.678(4) | Cu2–O4 | 1.896(3) |
| Cu2–N4 | 1.999(3) | Cu2–N5 | 1.939(4) |
| Cu2–O5 | 1.950(4) | Cu2–O6 | 2.763(3) |
| Cu3–O7 | 1.842(4) | Cu3–N7 | 1.992(4) |
| Cu3–N8 | 1.977(4) | Cu3–O8 | 1.962(4) |
| Cu3–O9 | 2.677(4) | ||
| 5 | |||
| Zn1A–O1A | 1.974(2) | Zn1A–N1A | 2.134(3) |
| Zn1A–N2A | 2.052(2) | Zn1A–O1AA | 2.070(2) |
| Zn1A–O1BB | 2.108(2) | Zn1B–O1B | 2.007(2) |
| Zn1B–N1B | 2.181(3) | Zn1B–N2B | 2.042(2) |
| Zn1C–O1C | 1.998(2) | Zn1C–N1C | 2.185(3) |
| Zn1C–N2C | 2.030(2) | Zn1C–O2CC | 2.011(2) |
| Zn1C–O1DD | 2.007(2) | Zn1D–O1D | 1.988(2) |
| Zn1D–N1D | 2.150(3) | Zn1D–N2D | 2.060(3) |
| Donor–H⋯acceptor | d(D–H) | d(H⋯A) | d(D⋯A) | ∠(DHA) |
|---|---|---|---|---|
| 1 | ||||
| O5–H5A⋯O3 | 0.82 | 2.16 | 2.682(8) | 122 |
| 2 | ||||
| O1A–H1A⋯O1B3 | 0.82 | 2.54 | 2.8221 | 102 |
| O2A–H2A⋯O2B2 | 0.82 | 2.18 | 2.7902 | 132 |
| 3 | ||||
| O1W–H1W⋯O1 | 0.89 | 2.03 | 2.820(2) | 149 |
| 4 | ||||
| O1S–H1S⋯O6 | 0.82 | 1.90 | 2.719(7) | 176 |
| 5 | ||||
| O1S–H1S⋯O2CC | 0.82 | 1.91 | 2.725(4) | 170 |
| O2S–H2S⋯O2BB | 0.82 | 1.90 | 2.717(4) | 173 |
Complex 2 has two 1![[thin space (1/6-em)]](https://www.rsc.org/images/entities/char_2009.gif) :
:![[thin space (1/6-em)]](https://www.rsc.org/images/entities/char_2009.gif) 2 monomeric structures (Fig. 2a and b) in the asymmetric unit with two Co(III) ions each six-fold coordinated by two L ligands [1.946(3) Å for Co1–N1, 1.904(3) Å for Co1–N2 and 1.881(2) Å for Co1–O1; 1.935(3) Å for Co1–N4, 1.907(3) Å for Co1–N5 and 1.874(2) Å for Co1–O2; 1.940(3) Å for Co2–N7, 1.905(3) Å for Co2–N8 and 1.878(2) Å for Co2–O3; 1.941(3) Å for Co2–N10, 1.900(3) Å for Co2–N11 and 1.879(2) Å for Co2–O4] making octahedral coordination environments for the Co metal centres. The L ligands have fairly flat conformations leading to parallel packing in the crystal lattice (Fig. 2c). The lattice methanol molecules and nitrate anions are involved in hydrogen bonding (Table 3). Although Kim and co-workers11 have reported the preparation of ligand (HL) and its use as a Co(II) chemosensor, no X-ray structure of the corresponding cobalt complex was presented. In their studies, the majority of the evidence suggested that the complex was a Co(II) species; the ESI-MS result was in conflict with this in that it was in accord with the presence of Co(III). In this study, the Co(III) structure determined indicates that the aerial oxidation of the initial cobalt(II) complex formed in solution does happen during the crystallization process which started in 10 hours.
2 monomeric structures (Fig. 2a and b) in the asymmetric unit with two Co(III) ions each six-fold coordinated by two L ligands [1.946(3) Å for Co1–N1, 1.904(3) Å for Co1–N2 and 1.881(2) Å for Co1–O1; 1.935(3) Å for Co1–N4, 1.907(3) Å for Co1–N5 and 1.874(2) Å for Co1–O2; 1.940(3) Å for Co2–N7, 1.905(3) Å for Co2–N8 and 1.878(2) Å for Co2–O3; 1.941(3) Å for Co2–N10, 1.900(3) Å for Co2–N11 and 1.879(2) Å for Co2–O4] making octahedral coordination environments for the Co metal centres. The L ligands have fairly flat conformations leading to parallel packing in the crystal lattice (Fig. 2c). The lattice methanol molecules and nitrate anions are involved in hydrogen bonding (Table 3). Although Kim and co-workers11 have reported the preparation of ligand (HL) and its use as a Co(II) chemosensor, no X-ray structure of the corresponding cobalt complex was presented. In their studies, the majority of the evidence suggested that the complex was a Co(II) species; the ESI-MS result was in conflict with this in that it was in accord with the presence of Co(III). In this study, the Co(III) structure determined indicates that the aerial oxidation of the initial cobalt(II) complex formed in solution does happen during the crystallization process which started in 10 hours.
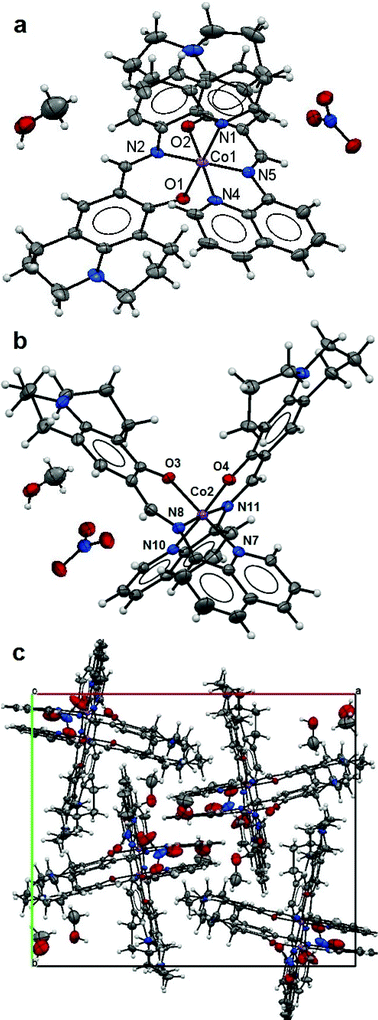 | ||
| Fig. 2 Structure of 2: the ellipsoidal plots (50% probability) of the mononuclear structures (a and b) and a crystal packing along the c-axis (c). | ||
The asymmetric unit of 3 has half of a Ni(II) ion on a centre symmetry coordinated by a tridentate L ligand with half a lattice water molecule. The expansion by symmetry suggests that 3 has a 1![[thin space (1/6-em)]](https://www.rsc.org/images/entities/char_2009.gif) :
:![[thin space (1/6-em)]](https://www.rsc.org/images/entities/char_2009.gif) 2 monomeric structure (Fig. 3a) with a Ni(II) ion six-fold coordinated by two L ligands [2.028(2) Å for Ni1–N1, 2.094(2) Å for Ni1–N2 and 2.028(2) Å for Ni1–O1] making an octahedral coordination environment for the Ni metal centre. The L ligand has a slightly twisted boat conformation (Fig. 3a). The lattice water molecule forms a hydrogen bond with both L ligands (O1 and O1#) (Fig. 2a) (Table 3). The monomers in the butterfly shape are packed in the crystal lattice (Fig. 3b).
2 monomeric structure (Fig. 3a) with a Ni(II) ion six-fold coordinated by two L ligands [2.028(2) Å for Ni1–N1, 2.094(2) Å for Ni1–N2 and 2.028(2) Å for Ni1–O1] making an octahedral coordination environment for the Ni metal centre. The L ligand has a slightly twisted boat conformation (Fig. 3a). The lattice water molecule forms a hydrogen bond with both L ligands (O1 and O1#) (Fig. 2a) (Table 3). The monomers in the butterfly shape are packed in the crystal lattice (Fig. 3b).
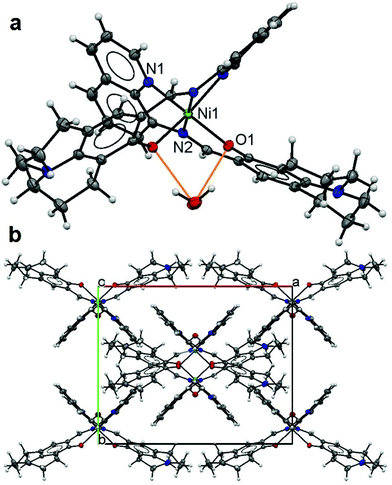 | ||
| Fig. 3 Structure of 3: an ellipsoidal plot (50% probability) of the mononuclear structure (a) with hydrogen bonds in orange and a crystal packing along the c-axis (b). | ||
The asymmetric unit of 4 contains three distinguished monomeric structures, each was made up of a Cu(II) ion five-fold coordinated by a L ligand [1.985(4) to 1.999(3) Å for Cu–N1/N4/N7; 1.939(4) to 1.977(4) Å for Cu–N2/N5/N8 and 1.842(4) to 1.896(3) Å for Cu–O1/O4/O7] and a chelating acetate anion [1.948(4) to 1.962(3) Å Cu–O2/O5/O8 and 2.677(4) to 2.763(3) Å Cu–O3/O6/O9] making square planar coordination polyhedra for the Cu metal centres (Fig. 4a) as Cu–O3/O6/O9 weak bonding represents an intermediate coordination mode of acetate between mono- and bidentate. Extensive π–π interactions (Fig. 4b) between monomers lead to the parallel crystal packing in the crystal lattice (Fig. 4c). A free terminal carboxylate O atom (O6) from one of the acetate anions is involved in hydrogen bonding with the lattice methanol molecule (Table 3).
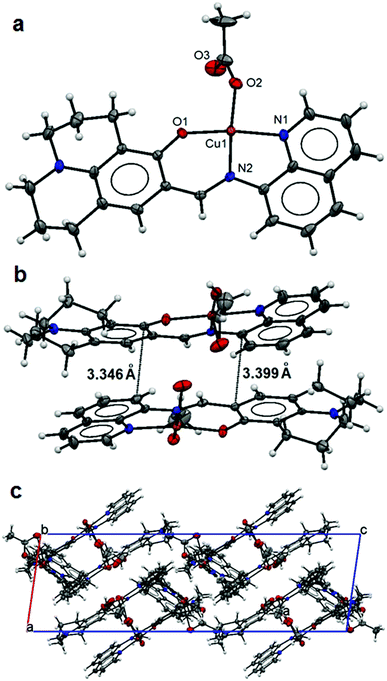 | ||
| Fig. 4 Structure of 4: an ellipsoidal plot (50% probability) of the mononuclear structure (a), π–π interactions between monomers (b) and a crystal packing view along the c-axis (c). | ||
The structure of 5 is composed of two dinuclear units (Fig. 5a and b) in the asymmetric unit. Each dimer unit has two pairs of ZnL units bridged by two acetate anions. In the dimer unit 1 (Fig. 5a), both Zn(II) ions are five-fold coordinated with a chelating L [2.134(3) Å for Zn1A–N1A, 2.052(3) Å for Zn1A–N2A, 1.974(3) Å for Zn1A–O1A; 2.181(3) Å for Zn1B–N1B, 2.042(3) Å for Zn1B–N2B, 2.007(2) Å for Zn1B–O1B] and two bridging acetates [2.070(2) Å for Zn1A–O1AA, 2.108(2) Å for Zn1A–O1BB; 2.014(2) Å for Zn1B–O1AA, 2.022(2) Å for Zn1B–O2BB] making slightly distorted trigonal bipyramidal coordination environments for both Zn metal centres. The two bridging acetate anions adopt different coordination modes: one bridges through only one carboxylate O and the other bridges through both carboxylate O atoms in the cis-arrangement. In the case of dimer unit 2 (Fig. 5b), both Zn(II) ions are coordinated with one chelating L [2.185(3) Å for Zn1C–N1C, 2.030(3) Å for Zn1C–N2C, 1.998(2) Å for Zn1C–O1C; 2.150(3) Å for Zn1D–N1D, 2.060(3) Å for Zn1D–N2D, 1.988(2) Å for Zn1D–O1D] and two bridging acetates [2.007(2) Å for Zn1C–O1DD, 2.011(2) Å for Zn1C–O2CC; 2.129(2) Å for Zn1D–O1CC, 2.120(2) Å for Zn1D–O1DD, 2.480(2) Å for Zn1D–O2DD]. Again the two acetate anions have different coordination modes: one bridges through both carboxylate O atoms in the cis-arrangement whilst the other one chelates to one metal centre and then bridges to the other via one carboxylate O atom making five-fold coordination of Zn1C in a trigonal bipyramidal polyhedron and six-fold coordination of Zn1D in an octahedral polyhedron. The Zn–Zn distances within the dimer units range from 3.625(4) Å for Zn1A–Zn1B to 3.701(4) Å for Zn1C–Zn1D. The L ligands adopt very flat conformations (Fig. 5c) leading to isolated dimers packing along the crystallographic c-axis (Fig. 5c). Carboxylate O atoms (O2BB and O2CC) are involved in hydrogen bonding with the lattice methanol molecules (Table 3).
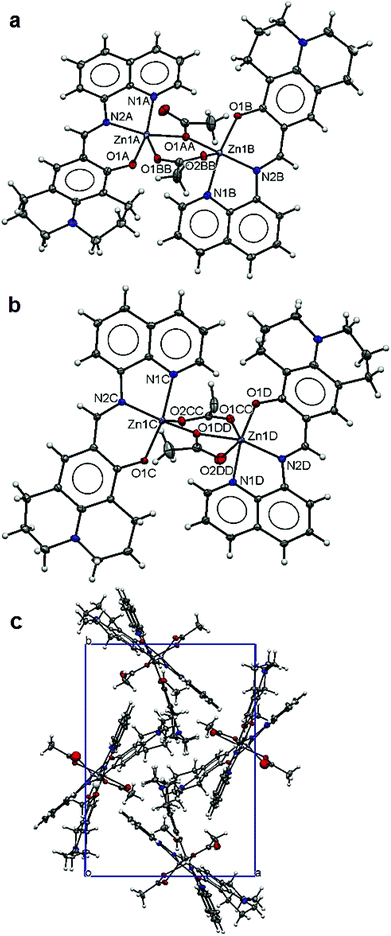 | ||
| Fig. 5 Structure of 5: ellipsoidal plots (50% probability) of dinuclear unit 1 (a), unit 2 (b) and a crystal packing view along the c-axis (c). | ||
Three structural types, e.g. 1![[thin space (1/6-em)]](https://www.rsc.org/images/entities/char_2009.gif) :
:![[thin space (1/6-em)]](https://www.rsc.org/images/entities/char_2009.gif) 1 monomer (4); 1
1 monomer (4); 1![[thin space (1/6-em)]](https://www.rsc.org/images/entities/char_2009.gif) :
:![[thin space (1/6-em)]](https://www.rsc.org/images/entities/char_2009.gif) 2 monomer (2 and 3); and 2
2 monomer (2 and 3); and 2![[thin space (1/6-em)]](https://www.rsc.org/images/entities/char_2009.gif) :
:![[thin space (1/6-em)]](https://www.rsc.org/images/entities/char_2009.gif) 2 dimer (1 and 5), have been identified in this study. The coordination of HL to Cu(II) produced a square planar polyhedron in 4 where a tridentate L and an acetate anion were bound to the metal centre with the acetate in a highly non-symmetrical fashion. It is interesting to observe one normal carboxylate O bonding to the Cu(II) ion with an average bond length of 1.951(3) Å for Cu1–O2/O5/O8 whilst the other with a much longer average Cu–O bond, average 2.704(3) Å for Cu1–O3/O6/O9. This represents an intermediate coordination mode between mono- and bidentate with the second oxygen atom weakly interacting with the metal centre. Such acetate bonding to the Cu(II) ion has been observed in early studies.18 The mononuclear structure with a metal to ligand ratio of 1
2 dimer (1 and 5), have been identified in this study. The coordination of HL to Cu(II) produced a square planar polyhedron in 4 where a tridentate L and an acetate anion were bound to the metal centre with the acetate in a highly non-symmetrical fashion. It is interesting to observe one normal carboxylate O bonding to the Cu(II) ion with an average bond length of 1.951(3) Å for Cu1–O2/O5/O8 whilst the other with a much longer average Cu–O bond, average 2.704(3) Å for Cu1–O3/O6/O9. This represents an intermediate coordination mode between mono- and bidentate with the second oxygen atom weakly interacting with the metal centre. Such acetate bonding to the Cu(II) ion has been observed in early studies.18 The mononuclear structure with a metal to ligand ratio of 1![[thin space (1/6-em)]](https://www.rsc.org/images/entities/char_2009.gif) :
:![[thin space (1/6-em)]](https://www.rsc.org/images/entities/char_2009.gif) 2 exhibiting an octahedral coordination geometry was found for both Co(III) in 2 and Ni(II) in 3. In the literature, many complexes of Mn(II), Fe(II)/(III), Co(II)/(III), Ni(II) and Zn(II) ions with Schiff base ligands in the similar tridentate (N, N, O) geometry result in similar 1
2 exhibiting an octahedral coordination geometry was found for both Co(III) in 2 and Ni(II) in 3. In the literature, many complexes of Mn(II), Fe(II)/(III), Co(II)/(III), Ni(II) and Zn(II) ions with Schiff base ligands in the similar tridentate (N, N, O) geometry result in similar 1![[thin space (1/6-em)]](https://www.rsc.org/images/entities/char_2009.gif) :
:![[thin space (1/6-em)]](https://www.rsc.org/images/entities/char_2009.gif) 2 complexes due to the preferred metal octahedral coordination polyhedra.19 Although Mn(II) ions in 1 also adopt octahedral coordination geometry, its structure was not consistent with that observed for Co(III) and Ni(II). Instead, two MnL(OAc) units were bridged together by two methanol molecules forming a dimer with two monodentate acetate anions. This dimer structure was quite unique not only because a 1
2 complexes due to the preferred metal octahedral coordination polyhedra.19 Although Mn(II) ions in 1 also adopt octahedral coordination geometry, its structure was not consistent with that observed for Co(III) and Ni(II). Instead, two MnL(OAc) units were bridged together by two methanol molecules forming a dimer with two monodentate acetate anions. This dimer structure was quite unique not only because a 1![[thin space (1/6-em)]](https://www.rsc.org/images/entities/char_2009.gif) :
:![[thin space (1/6-em)]](https://www.rsc.org/images/entities/char_2009.gif) 2 coordination arrangement was not formed but also due to the fact that the dimer was bridged through methanol molecules. A slightly different dimer structure has been identified in 5 with acetate anions bridging in three different coordination modes. In fact, the acetate anions are present as monodentate in 1 and 4, and bridging in 5. It is apparent that the crystal structures obtained in this study have been controlled by two main factors. One is the metal preferred coordination geometry and the other is the competition of additional ligands, e.g. acetate anion and methanol solvent in the case of 1 and 5. It is also observed that the L ligand can adopt flexible, from fairly flat (1, 2, 4 and 5) to bending (3) conformations. The flat ligand conformations present in 1, 2, 4 and 5 lead to closely parallel packing of ligands in the crystal lattice. Consequently, π–π interactions are very common in their crystal structures.
2 coordination arrangement was not formed but also due to the fact that the dimer was bridged through methanol molecules. A slightly different dimer structure has been identified in 5 with acetate anions bridging in three different coordination modes. In fact, the acetate anions are present as monodentate in 1 and 4, and bridging in 5. It is apparent that the crystal structures obtained in this study have been controlled by two main factors. One is the metal preferred coordination geometry and the other is the competition of additional ligands, e.g. acetate anion and methanol solvent in the case of 1 and 5. It is also observed that the L ligand can adopt flexible, from fairly flat (1, 2, 4 and 5) to bending (3) conformations. The flat ligand conformations present in 1, 2, 4 and 5 lead to closely parallel packing of ligands in the crystal lattice. Consequently, π–π interactions are very common in their crystal structures.
Raman spectroscopy
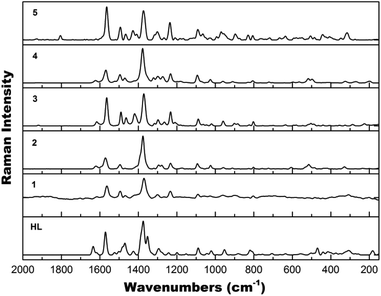
The vibrational modes of the five complexes have been examined using Raman spectroscopy. All Raman spectra of complexes 1–5 (Fig. 6) resemble each other quite well and are similar to the Raman spectrum of HL (Fig. 6) due to the presence of the same ligand. Common features mainly from the quinoline functional group20 include: ν(C![[double bond, length as m-dash]](https://www.rsc.org/images/entities/char_e001.gif) C) at 1564 cm−1; ν(C
C) at 1564 cm−1; ν(C![[double bond, length as m-dash]](https://www.rsc.org/images/entities/char_e001.gif) N) at 1494 cm−1; ν(CC) + ν(CN) at 1466 and 1321–1300 cm−1; ν(C–C) at 1370 cm−1; ν(C–N) + δ(CH), in-plane bending at 1234 cm−1; δ(CH), in-plane bending + δ(CNC) at 1093 cm−1; ν(CNCH) at 965 cm−1; δ(CH), out-of-plane bending + δ(CCC) + δ(CCN) at 806 cm−1.
N) at 1494 cm−1; ν(CC) + ν(CN) at 1466 and 1321–1300 cm−1; ν(C–C) at 1370 cm−1; ν(C–N) + δ(CH), in-plane bending at 1234 cm−1; δ(CH), in-plane bending + δ(CNC) at 1093 cm−1; ν(CNCH) at 965 cm−1; δ(CH), out-of-plane bending + δ(CCC) + δ(CCN) at 806 cm−1.
Absorption and photoluminescence
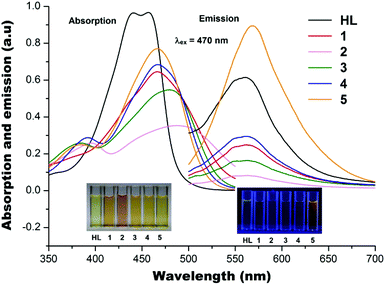
The absorption spectra of the five metal acetates [Mn(II), Co(II), Ni(II), Cu(II) and Zn(II)] and HL in methanol solutions with a metal to ligand ratio of 1![[thin space (1/6-em)]](https://www.rsc.org/images/entities/char_2009.gif) :
:![[thin space (1/6-em)]](https://www.rsc.org/images/entities/char_2009.gif) 2 are shown in Fig. 7. HL gives double absorption maxima at ∼435 and ∼445 nm and the corresponding complexes have the absorption maxima slightly shifted to ∼468 nm upon complexation, with a further shift to ∼480 nm for 3. The Co(III) ion gives a very similar absorption spectrum to that of Ni(II) but with a bit further shift towards ∼495 nm, consistent with the earlier observation.11 After excitation at 470 nm, HL and 1–4 have the fluorescence emission maxima at ∼560 nm with the exception of 5 which has the fluorescence emission maxima shifted to ∼575 nm (Fig. 7). It is also evident that the Mn(II) ion in 1, Co(III) ion in 2, Ni(II) ion in 3 and Cu(II) ion in 4 quench the ligand fluorescence emission whilst the Zn(II) ion in 5 has enhanced the ligand fluorescence emission. It has been well documented that paramagnetic metal ions quench fluorescence in systems of the present type. On the other hand, Zn(II) with its full-shell electronic configuration (d10) does not profit from ligand field effects. In addition, the Zn(II) ion is photophysically inactive, as it does not display any one-electron redox activity and cannot be involved in the electronic transfer process. However, the Zn(II) ion can exert an indirect effect on the emitting activity of a proximate fluorophore, which may lead to fluorescence regeneration or enhancement,21 as observed in the present study.
2 are shown in Fig. 7. HL gives double absorption maxima at ∼435 and ∼445 nm and the corresponding complexes have the absorption maxima slightly shifted to ∼468 nm upon complexation, with a further shift to ∼480 nm for 3. The Co(III) ion gives a very similar absorption spectrum to that of Ni(II) but with a bit further shift towards ∼495 nm, consistent with the earlier observation.11 After excitation at 470 nm, HL and 1–4 have the fluorescence emission maxima at ∼560 nm with the exception of 5 which has the fluorescence emission maxima shifted to ∼575 nm (Fig. 7). It is also evident that the Mn(II) ion in 1, Co(III) ion in 2, Ni(II) ion in 3 and Cu(II) ion in 4 quench the ligand fluorescence emission whilst the Zn(II) ion in 5 has enhanced the ligand fluorescence emission. It has been well documented that paramagnetic metal ions quench fluorescence in systems of the present type. On the other hand, Zn(II) with its full-shell electronic configuration (d10) does not profit from ligand field effects. In addition, the Zn(II) ion is photophysically inactive, as it does not display any one-electron redox activity and cannot be involved in the electronic transfer process. However, the Zn(II) ion can exert an indirect effect on the emitting activity of a proximate fluorophore, which may lead to fluorescence regeneration or enhancement,21 as observed in the present study.
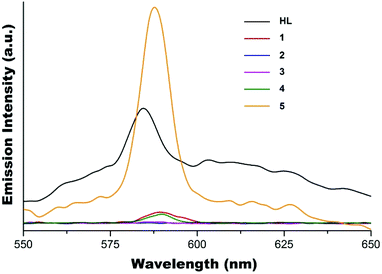
The solid state fluorescence emission spectra of complexes 1–5 together with ligand HL are shown in Fig. 8. Similar to the observation from the solution study, the fluorescence of HL is completely quenched in complexes 2 and 3 which have the metal to ligand ratio of 1![[thin space (1/6-em)]](https://www.rsc.org/images/entities/char_2009.gif) :
:![[thin space (1/6-em)]](https://www.rsc.org/images/entities/char_2009.gif) 2, and partially quenched in complexes 1 and 4 which have the metal to ligand ratio of 1
2, and partially quenched in complexes 1 and 4 which have the metal to ligand ratio of 1![[thin space (1/6-em)]](https://www.rsc.org/images/entities/char_2009.gif) :
:![[thin space (1/6-em)]](https://www.rsc.org/images/entities/char_2009.gif) 1, with emission maxima at ∼588 nm. As expected, the enhancement of solid state fluorescence emission of HL in the presence of Zn(II) in 5 is obvious with the emission maximum shifted to ∼588 nm compared to ∼585 nm for ligand HL.
1, with emission maxima at ∼588 nm. As expected, the enhancement of solid state fluorescence emission of HL in the presence of Zn(II) in 5 is obvious with the emission maximum shifted to ∼588 nm compared to ∼585 nm for ligand HL.
Conclusions
Five new complexes with structures ranging from monomers with a metal to ligand ratio of 1![[thin space (1/6-em)]](https://www.rsc.org/images/entities/char_2009.gif) :
:![[thin space (1/6-em)]](https://www.rsc.org/images/entities/char_2009.gif) 1 or 1
1 or 1![[thin space (1/6-em)]](https://www.rsc.org/images/entities/char_2009.gif) :
:![[thin space (1/6-em)]](https://www.rsc.org/images/entities/char_2009.gif) 2 to dimers bridged by either acetate anions or methanol molecules have been synthesised and characterised. Octahedral coordination geometry is favored in Mn(II), Co(III) and Ni(II) complexes with a dimer structure for Mn(II) via unique methanol bridging instead of acetate bridging. Co(III) and Ni(II) ions adopt mononuclear structures with the metal to ligand ratio of 1
2 to dimers bridged by either acetate anions or methanol molecules have been synthesised and characterised. Octahedral coordination geometry is favored in Mn(II), Co(III) and Ni(II) complexes with a dimer structure for Mn(II) via unique methanol bridging instead of acetate bridging. Co(III) and Ni(II) ions adopt mononuclear structures with the metal to ligand ratio of 1![[thin space (1/6-em)]](https://www.rsc.org/images/entities/char_2009.gif) :
:![[thin space (1/6-em)]](https://www.rsc.org/images/entities/char_2009.gif) 2 with a flat ligand conformation for the Co(III) complex and a twisted boat ligand conformation for the Ni(II) complex. The Cu(II) complex shows a 1
2 with a flat ligand conformation for the Co(III) complex and a twisted boat ligand conformation for the Ni(II) complex. The Cu(II) complex shows a 1![[thin space (1/6-em)]](https://www.rsc.org/images/entities/char_2009.gif) :
:![[thin space (1/6-em)]](https://www.rsc.org/images/entities/char_2009.gif) 1 mononuclear structure with a square planar coordination polyhedron consisting of a L ligand and a highly non-symmetrical bonded acetate anion. Such a structural arrangement is dominated by the preferred coordination geometry of the Cu(II) ion. The Zn(II) complex has two types of dimer structures with pairs of ZnL units bridged by two acetates in three different coordination modes. Consequently, both five-fold in trigonal bipyramidal and six-fold in octahedral coordination environments are present within one compound, which is a rare observation. The formation of the ligand and the corresponding metal complexes has been confirmed by ESI-HRMS, SEM-EDS and Raman spectroscopy. In addition, the complexation of HL with 3d metal ions results in slightly red shifts of the absorption maxima. As expected, the presence of Mn(II), Co(II)/Co(III), Ni(II) and Cu(II) ions quenches the ligand fluorescence emission to some extent whilst the presence of Zn(II) has shown ligand fluorescence enhancement with a further red-shift of the emission maximum. Further studies on different anions and rare earth metal ions with such a ligand are ongoing and will be reported in due course.
1 mononuclear structure with a square planar coordination polyhedron consisting of a L ligand and a highly non-symmetrical bonded acetate anion. Such a structural arrangement is dominated by the preferred coordination geometry of the Cu(II) ion. The Zn(II) complex has two types of dimer structures with pairs of ZnL units bridged by two acetates in three different coordination modes. Consequently, both five-fold in trigonal bipyramidal and six-fold in octahedral coordination environments are present within one compound, which is a rare observation. The formation of the ligand and the corresponding metal complexes has been confirmed by ESI-HRMS, SEM-EDS and Raman spectroscopy. In addition, the complexation of HL with 3d metal ions results in slightly red shifts of the absorption maxima. As expected, the presence of Mn(II), Co(II)/Co(III), Ni(II) and Cu(II) ions quenches the ligand fluorescence emission to some extent whilst the presence of Zn(II) has shown ligand fluorescence enhancement with a further red-shift of the emission maximum. Further studies on different anions and rare earth metal ions with such a ligand are ongoing and will be reported in due course.
Acknowledgements
DJF acknowledges the Western Sydney University Postgraduate Research Award and LL thanks the receipt of an Australian Postgraduate Award and the Western Sydney University Top-up Award; NDS thanks the AINSE Honours Scholarship Program. The crystallographic data collection for complexes 1–5 was undertaken on the MX1 beamline at the Australian Synchrotron, Victoria, Australia, through a collaborative access program (AS143MXCAP8503).References
- (a) A. W. Czarnik, Acc. Chem. Res., 1994, 27, 302 CrossRef CAS; (b) A. P. de Silva, H. Q. N. Gunaratne, T. Gunnlaugsson, A. J. M. Huxley, C. P. McCoy, J. T. Rademacher and T. E. Rice, Chem. Rev., 1997, 97, 1515 CrossRef CAS PubMed; (c) S. K. Sahoo, D. Sharma, R. K. Bera, G. Crisponi and J. F. Callen, Chem. Soc. Rev., 2012, 41, 7195 RSC; (d) M. Wuttig and N. Yamada, Nat. Mater., 2007, 6, 824 CrossRef CAS PubMed; (e) M. Fernandez-Suarez and A. Y. Ting, Nat. Rev. Mol. Cell Biol., 2008, 9, 929 CrossRef CAS PubMed; (f) G. Wu, F. Kong, J. Li, W. Chen, C. Zhang, Q. Chen, X. Zhang and S. Dai, Synth. Met., 2013, 180, 9 CrossRef CAS; (g) H. Choi, J. K. Lee, K. H. Song, K. Song, S. O. Kang and J. Ko, Tetrahedron, 2007, 63, 1553 CrossRef CAS; (h) G. Wu, F. Kong, J. Li, X. Fang, Y. Li, S. Dai, Q. Chen and X. Zhang, J. Power Sources, 2013, 243, 131 CrossRef CAS; (i) M. A. Haidekker, T. Ling, M. Anglo, H. Y. Stevens, J. A. Frangos and E. A. Theodorakis, Chem. Biol., 2001, 8, 123 CrossRef CAS PubMed; (j) M. Horie, T. Sassa, D. Hashizume, Y. Suzaki, K. Osakada and T. Wada, Angew. Chem., Int. Ed., 2007, 46, 4983 CrossRef CAS PubMed.
- (a) J.-M. Lehn, Supramolecular chemistry, VCH, Weinheim, 1995 Search PubMed; (b) J. W. Steed, D. R. Turner and K. J. Wallace, Core concepts in supramolecular chemistry and nanochemistry, John Wiley & Sons, Hoboken, 2007 Search PubMed; (c) Z. Yang, J. Cao, Y. He, J. H. Yang, T. Kim, X. Peng and J. S. Kim, Chem. Soc. Rev., 2014, 43, 4563 RSC.
- (a) Z. Dinev and J. N. Lambert, Aust. J. Chem., 2001, 54, 625 CrossRef CAS; (b) L. J. Beeching, C. S. Hawes, D. R. Turner and S. R. Batten, CrystEngComm, 2014, 16, 6459 RSC; (c) T. W. Bell and N. M. Hext, Chem. Soc. Rev., 2004, 33, 589 CAS.
- (a) J.-M. Lehn, Science, 2002, 295, 2400 CrossRef CAS PubMed; (b) W. Jiang and C. A. Schalley, Proc. Natl. Acad. Sci. U. S. A., 2008, 106, 10425 CrossRef PubMed; (c) D. J. Cram, Angew. Chem., Int. Ed. Engl., 1986, 25, 1039 CrossRef.
- (a) J. M. Kauffman, S. J. Imbesi and M. A. Aziz, Org. Prep. Proced. Int., 2001, 33, 603 CrossRef CAS; (b) J. J. Holt, B. D. Calitree, J. Vincek, M. K. Gannon and M. R. Detty, J. Org. Chem., 2007, 72, 2690 CrossRef CAS PubMed; (c) P. A. S. Smith and T.-Y. Yu, J. Org. Chem., 1952, 17, 1281 CrossRef CAS.
- (a) D. Maity, A. K. Manna, D. Karthigeyan, T. K. Kundu, S. K. Pati and T. Govindaraju, Chem. – Eur. J., 2011, 17, 11152 CrossRef CAS PubMed; (b) K. B. Kim, G. J. Park, H. Kim, E. J. Song, J. M. Bae and C. Kim, Inorg. Chem. Commun., 2014, 46, 237 CAS; (c) Y. J. Na, I. H. Hwang, H. Y. Jo, S. A. Lee, G. J. Park and C. Kim, Inorg. Chem. Commun., 2013, 35, 342 CrossRef CAS; (d) J. Jun Lee, G. Jin Park, Y. Sung Kim, S. Young Lee, H. Ji Lee, I. Noh and C. Kim, Biosens. Bioelectron., 2015, 69, 226 CrossRef CAS PubMed.
- (a) T. G. Jo, Y. J. Na, J. J. Lee, M. M. Lee, S. Y. Lee and C. Kim, New J. Chem., 2015, 39, 2580 RSC; (b) J. H. Lee, S. H. Lee, Y. A. So, G. J. Park and C. Kim, Korean Chem. Soc., 2015, 36, 1618 CrossRef CAS; (c) T. G. Jo, Y. J. Na, J. J. Lee, M. M. Lee, S. Y. Lee and C. Kim, Sen. Actuators, B, 2015, 211, 498 CrossRef CAS.
- (a) Y. S. Kim, G. J. Park, J. J. Lee, S. Y. Lee, S. Y. Lee and C. Kim, RSC Adv., 2015, 5, 11229 RSC; (b) S. A. Lee, G. R. You, Y. W. Choi, H. Y. Jo, A. R. Kim, I. Noh, S.-J. Kim, Y. Kim and C. Kim, Dalton Trans., 2014, 43, 6650 RSC; (c) G. J. Park, I. H. Hwang, E. J. Song, H. Kim and C. Kim, Tetrahedron, 2014, 70, 2822 CrossRef CAS.
- J. Y. Noh, S. Kim, I. H. Hwang, G. Y. Lee, J. Kang, S. H. Kim, J. Min, S. Park, C. Kim and J. Kim, Dyes Pigm., 2013, 99, 1016 CrossRef CAS.
- (a) G. J. Park, D. Y. Park, K.-M. Park, Y. Kim, S.-J. Kim, P.-S. Chang and C. Kim, Tetrahedron, 2014, 70, 7429 CrossRef CAS; (b) J. Yang, Z.-L. Yuan, G.-Q. Yu, S.-L. He, Q.-H. Wu, B. Jiang and G. Wei, J. Fluoresc., 2015 DOI:10.1007/s10895-015-1710-2 , in press.
- G. J. Park, Y. J. Na, H. Y. Jo, S. A. Lee and C. Kim, Dalton Trans., 2014, 43, 6618 RSC.
- T. M. McPhillips, S. E. McPhillips, H. J. Chiu, A. E. Cohen, A. M. Deacon, P. J. Ellis, E. Garman, A. Gonzalez, N. K. Sauter, R. P. Phizackerley, S. M. Soltis and P. Kuhn, J. Synchrotron Radiat., 2002, 9, 401 CrossRef CAS PubMed.
- W. Kabsch, J. Appl. Crystallogr., 1993, 26, 795 CrossRef CAS.
- G. M. Sheldrick, SADABS: Empirical Absorption and Correction Software, University of Göttingen, Germany, 1996 Search PubMed.
- (a) G. M. Sheldrick, Acta Crystallogr., Sect. A: Fundam. Crystallogr., 2008, 64, 112 CrossRef CAS PubMed; (b) G. M. Sheldrick, Acta Crystallogr., Sect. A: Fundam. Crystallogr., 2015, 71, 3 CrossRef PubMed.
- O. V. Dolomanov, L. J. Bourhis, R. J. Gildea, J. A. K. Howard and H. Puschmann, J. Appl. Crystallogr., 2009, 42, 339 CrossRef CAS.
- A. L. Spek, Acta Crystallogr., Sect. D: Biol. Crystallogr., 2009, 65, 148 CrossRef CAS PubMed.
- (a) S. Meghdadi, M. Amirnasr, S. B. Hoda Moein Sadat, K. Mereiter and A. Amiri, Monatsh. Chem., 2014, 145, 1583 CrossRef CAS; (b) D. W. Boyce, D. J. Salmon and W. B. Tolman, Inorg. Chem., 2014, 53, 5788 CrossRef CAS PubMed; (c) V. M. Manikandamathavan, T. Weyhermuller, R. P. Parameswari, M. Sathishkumar, V. Subramanian and B. U. Nair, Dalton Trans., 2014, 43, 13018 RSC; (d) D. C. Sauer and H. Wadepohl, Polyhedron, 2014, 81, 180 CrossRef CAS.
- (a) A. Tissot, P. Fertey, R. Guillot, V. Briois and M.-L. Boillot, Eur. J. Inorg. Chem., 2014, 101 CrossRef CAS; (b) K. A. Gerling, N. M. Rezayee, A. L. Rheingold, D. B. Green and J. M. Fritsch, Dalton Trans., 2014, 43, 16498 RSC; (c) E. A. Buvaylo, V. N. Kokozay, K. Rubini, O. Yu. Vassilyeva and B. W. Skelton, J. Mol. Struct., 2014, 1072, 129 CrossRef CAS; (d) B. K. Koo, J. Korean Chem. Soc., 2013, 57, 859 CrossRef CAS; (e) Q.-Q. Zhang, Z.-H. Zhang, B.-H. Qu, Q. Chen and M.-Y. He, Inorg. Chim. Acta, 2014, 418, 59 CrossRef CAS; (f) P. Singh, D. P. Singh and V. P. Singh, Polyhedron, 2014, 81, 56 CrossRef CAS; (g) K. D. Murnaghan, C. Carbonera, L. Toupet, M. Griffin, M. M. Dirtu, C. Desplanches, Y. Garcia, E. Collet, J.-F. Letard and G. G. Morgan, Chem. – Eur. J., 2014, 20, 5613 CrossRef CAS PubMed; (h) D. Gong, B. Wang, X. Jia and X. Zhang, Dalton Trans., 2014, 43, 4169 RSC.
- (a) G. Socrates, Infrared and Raman Characteristic Group Frequencies: Tables and Charts, John Wiley & Sons Hoboken, New York, 3rd edn, 2004 Search PubMed; (b) V. Arjunan, S. Mohan, P. S. Balamourougane and P. Ravindran, Spectrochim. Acta, Part A, 2009, 74, 1215 CrossRef CAS PubMed; (c) A. E. Ozel, S. Celik and S. Akyuz, J. Mol. Struct., 2009, 924–926, 523 CrossRef CAS.
- (a) Z. Xu, J. Yoon and D. R. Spring, Chem. Soc. Rev., 2010, 39, 1996 RSC; (b) L. Fabbrizzi, M. Licchelli, P. Pallavicini, D. Sacchi and A. Taglietti, Analyst, 1996, 121, 1763 RSC.
Footnote |
| † Electronic supplementary information (ESI) available: 1H NMR, SEM-EDS and ESI-HRMS. CCDC 1430317 (1), 1438799 (2), 1430318 (3), 1430319 (4) and 1430320 (5). For ESI and crystallographic data in CIF or other electronic format see DOI: 10.1039/c5qi00200a |
| This journal is © the Partner Organisations 2016 |

