DOI:
10.1039/C5QI00175G
(Research Article)
Inorg. Chem. Front., 2016,
3, 86-91
TDDFT studies on the chiroptical properties of a chiral inorganic polythioanion Möbius strip†
Received
9th September 2015
, Accepted 25th October 2015
First published on 26th October 2015
Abstract
The electronic circular dichroism (ECD) spectra of chiral inorganic polythioanion Möbius strip [(Mo2S2O2)4(OH)6(C4O4) (Mo2O8)]4− (1a) and its 1e- and 2e-reduced forms were investigated by using the time-dependent density functional theory (TDDFT) method. The simulated UV spectra of 1a agree well with the experimental spectra, confirming that the CAM-B3LYP hybrid functional can accurately predict the excitation energies of a polythioanion. The shapes of the ECD bands for the reduced forms are similar to that of 1a, while the rotatory strengths clearly increase with the additional electrons. The peaks in the ECD spectra of 1a are mainly assigned to the charge transfer from the {C4O4} unit and S atoms to the Mo and terminal oxygen (Ot) atoms. The {C4O4} unit is the main chiroptical chromophore. For the reduced forms, the charge transfer from S atoms to Mo atoms significantly increases with the additional electrons. It is reasonable to assume that the transfer of chirality from the {C4O4} unit to the {Mo2S2O2} unit is generated during the reduction process.
Introduction
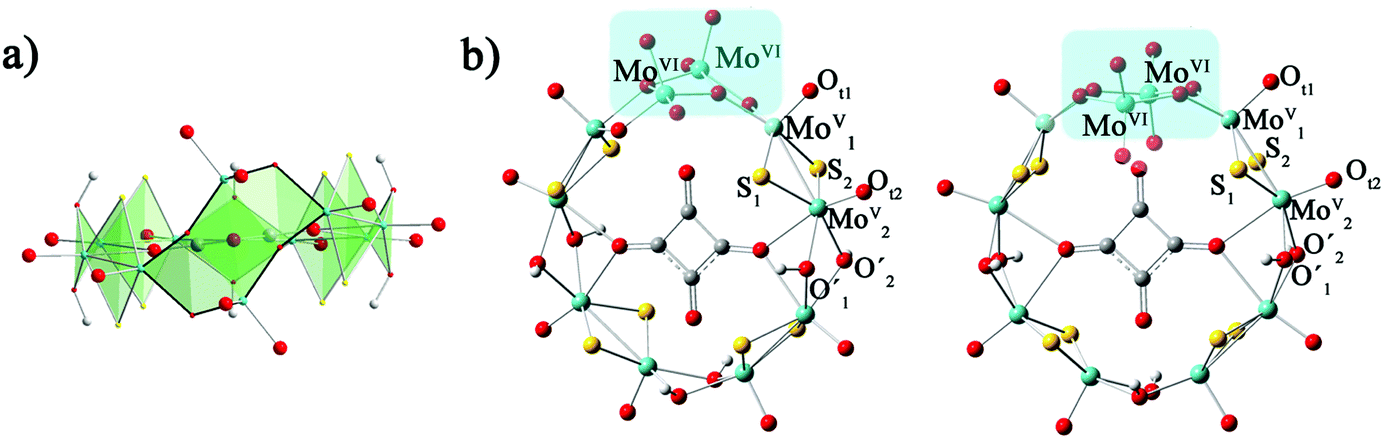
Chiral materials have attracted much attention, not only because of their potential applications in enantioselective catalysis, materials science, biology, and medicine, but also due to their intriguing variety of architectures and topologies.1,2 Various compounds including organic molecules,3 zeolites4 and polyoxoanions5 with chiral structures have been reported. In recent years, polyoxoanions of tungsten, molybdenum, and vanadium have been the subject of interest since their wide variety of compositions, structures, and properties give rise to numerous important applications.6 However, thiometalates are less common than oxometalates.7 Fortunately, synthetic approaches for the formation of thiopolyoxometalates (TPOMs) with sulfur-containing cationic building blocks {Mo2O2S2}2+ and {Mo3S4}4+ have been improved.8 Cronin and co-workers reported a chiral polythioanion ring cluster [(Mo2S2O2)4(OH)6(C4O4) (Mo2O8)]4− (1a) using [Mo2S2O2(H2O)6]2+ and squarate dianion.9 At the same time, the nonchiral cluster 1b could be obtained, which is an isomer of 1a. Intriguingly, the chiral cluster 1a was first produced in high yield, and 1b was crystallized in a much lower yield after 1a was separated from the mother liquor.9 It was noticed that four {MoV2O2S2} units in chiral cluster 1a are connected to each other by hydroxo double bridges, and the ring incorporates a {MoVI2O8} unit, resulting in the topology of a Möbius strip; this phenomenon does not occur for 1b. Apart from the synthesis strategy and novel structure of chiral cluster 1a, the further investigation of related properties is an especially attractive research prospect.
Chiral compounds or chiroptical properties are usually monitored by circular dichroism (CD) spectroscopy, which measures the differential absorption of left- and right-circularly polarized light10 and was first discovered by Cotton and co-workers in 1896.11 Chiral POM-based materials are often characterized by their CD spectra in the ultraviolet-visible (UV-vis) region, which provide evidence of electronic excitations and are therefore referred to as electronic CD (ECD) spectra. ECD spectra can provide information on the origin of optical activity and allow the elucidation of electronic structures, the assignment of transitions, and the determination of absolute configuration for chiral molecules.12–14 Nowadays, theoretical methods have become trusted for understanding chemistry. Theoretical investigations on the electronic and chiroptical properties of chiral compounds at the molecular scale are valuable from both the theoretical and the practical point of view. Previous studies have already shown that theoretical approaches are very helpful for explaining the ECD spectra of chiral isomers.15–17 Density functional theory (DFT), because of its accuracy and computational efficiency, has in recent years become a popular approach for studying optical activity. It has been applied to calculate the ECD spectra of a number of transition-metal complexes18–25 and POMs.26–29 In 2012, Zhongmin Su and co-workers reported that the chirality transfer from a chiral carbon atom to a POM cage increases as the polyanion is reduced, by studying the electronic transitions.27 These studies showed fair agreement between DFT and experimental ECD spectra.
In the present work, the time-dependent DFT (TD-DFT) method was applied to evaluate the ECD spectra of chiral polythioanion ring cluster [(Mo2S2O2)4(OH)6(C4O4) (Mo2O8)]4− (1a) and its one- and two-electron reduced forms, [1a]− and [1a]2−. We concerned ourselves with the following questions: (1) what are the origins of the ECD spectra for 1a and its reduced forms? (2) which is the chiroptical chromophore – {Mo2S2O2}, {Mo2O8} or {C4O4}? (3) does the chirality transfer occur when 1a is reduced? Therefore, the ECD spectra of 1a and its reduced forms were simulated, and the electronic structures and transitions as well as the origins of the ECD spectra were analyzed by using DFT and TD-DFT methods. At the same time, 1b was also studied for comparison with 1a.
Computational details
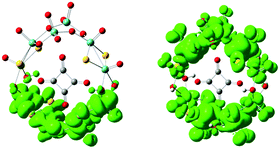
The calculation models are shown in Fig. 1. The geometry optimizations of all studied clusters were performed with the Gaussian 09 package30 at DFT level by means of the hybrid exchange–correlation PBE0 functional.31,32 Considering the relativistic effects for the transition metal ions, the LANL2DZ basis set containing the effective core potential (ECP) proposed by Hay and Wadt33 was applied for Mo atoms. The 6-31G* basis set34 was used for H, C, O and S atoms. The solvent effect was included during the geometry optimization in water by means of the polarizable continuum model (PCM)35 as implemented in Gaussian09. Geometry optimizations were carried out with symmetry constraints C2 and C2v for 1a and 1b, respectively.
 |
| | Fig. 1 The optimized structures of [(MoV2S2O2)4(OH)6(MoVI2O8)(C4O4)]4−: (a) side view of 1a; (b) top view of 1a (left) and 1b (right). | |
TDDFT is one of the most popular methods for calculating electron absorption spectra in quantum chemistry owing to its accuracy and efficiency.17,27,36 Our recent work confirmed that the CAM-B3LYP hybrid functional37 using a Coulomb-attenuating method is effective for describing the charge-transfer excitations and absorption properties for given excitation energies. Therefore, the TDDFT/CAM-B3LYP method and 6-31G*/LanL2DZ (6-31G* for C, H, O, and S atoms; LanL2DZ for Mo atoms) were employed to calculate the ECD spectra. The solvent effect was incorporated in the TDDFT calculations by PCM. Gaussian band shape with a bandwidth of 0.22 eV was used to simulate the UV-vis/ECD spectra.
Results and discussion
Geometric and electronic structure
From previous experimental results, the chiral cluster 1a was produced first in high yield, and 1b crystallized in a much lower yield after 1a was separated from the mother liquor.91a is composed of {MoV2O2S2} units, which are connected to each other by hydroxo double bridges, and {MoVI2O8} is also incorporated. The [MoVI2O8]4− unit adopts two distinct configurations in 1a and 1b, which results in the key difference between 1a and 1b. MoVI atoms are five-coordinated in 1a, while the MoVI atoms in 1b are four-coordinated. The symmetries for 1a and 1b are C2 and C2v, respectively. The total energies of 1a and 1b were calculated by different functionals (PBE0, B3LYP, and BP86) and basis sets (6-31G*, 6-31+G*, 6-31++G*/LanL2DZ). The relative energies defined by ΔE = E1a − E1b and collected in Table S1 (ESI†) indicate that the energy difference between 1a and 1b is small. This suggests that 1a and 1b are not thermodynamically controlled, which is in good agreement with experimental phenomena.9 The optimized bond lengths for the [MoVI2O8]4− unit in 1a and 1b are shown in Table 1, and the experimental X-ray parameters are also included. It can be seen that the experimental structures are well-reproduced by the present calculations.
Table 1 Experimental and theoretical optimized bond lengths for the {MoVI2O8} unit in 1a and 1b
| Bond length (Å) |
1a
|
1b
|
| Exp |
Cal |
Exp |
Cal |
| MoV1–MoV2 |
2.841 |
2.871 |
2.827 |
2.859 |
| MoV1–Ot1 |
1.682 |
1.687 |
1.681 |
1.686 |
| MoV2–Ot2 |
1.682 |
1.689 |
1.685 |
1.688 |
| MoV2–O′1 |
2.113 |
2.136 |
2.071 |
2.123 |
| MoV2–O′2 |
2.098 |
2.115 |
2.081 |
2.123 |
| MoV1–S1 |
2.325 |
2.348 |
2.304 |
2.347 |
| MoV1–S2 |
2.301 |
2.358 |
2.318 |
2.347 |
| MoV2–S1 |
2.328 |
2.340 |
2.304 |
2.328 |
| MoV2–S2 |
2.302 |
2.325 |
2.307 |
2.328 |
In order to examine the electronic properties of 1a and 1b, the frontier molecular orbitals (FMOs) were studied and are shown in Fig. 2. It can be clearly seen that the FMOs for 1a and 1b are different. The highest occupied molecular orbital (HOMO) in 1a is mainly delocalized over the {C4O4} unit, and the lowest unoccupied molecular orbital (LUMO) is localized on the two {MoV2O2S2} units most distant from the {MoVI2O8} unit. The HOMO of 1b is mainly localized on the {MoVI2O8} unit and the two {MoV2O2S2} units adjacent to it, and {C4O4} contributes slightly to the HOMO, while the LUMO is delocalized over the {MoVI2O8} and {MoV2O2S2} units. Although the distributions of the FMOs for 1a and 1b are different, the energy levels of the FMOs are similar. From the LUMO distribution of 1a, it is proposed that the one-electron reduced centre is located in the {MoV2O2S2} units most distant from the {MoVI2O8} unit.
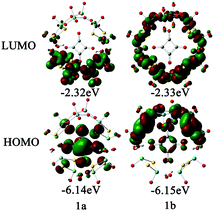 |
| | Fig. 2 Frontier molecular orbitals for 1a and 1b. | |
ECD spectra of 1a
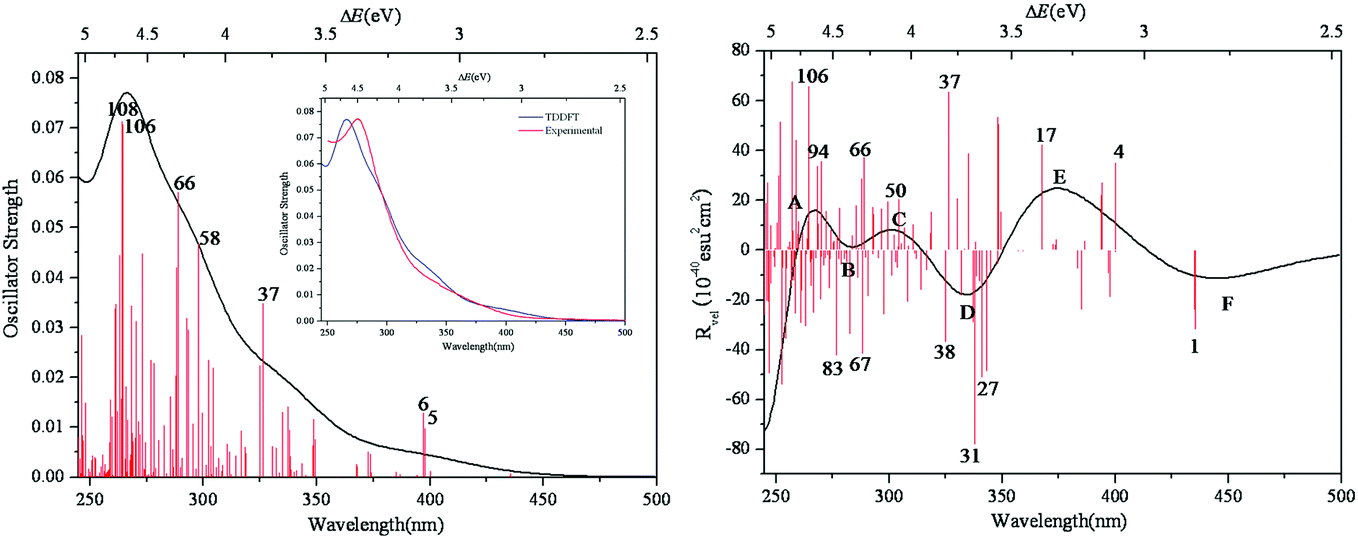
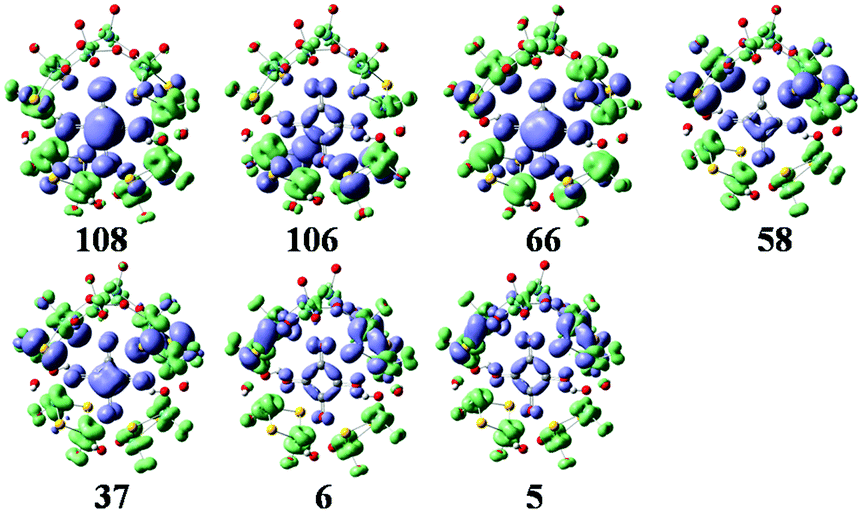
The simulated UV-vis spectrum of 1a is presented in Fig. 3 (left), and the comparison of simulated and experimental spectra is shown in Fig. 3 (inset). The simulated spectrum is in good agreement with the experimental one, confirming that the CAM-B3LYP hybrid functional and 6-31G*/LanL2DZ basis set used in this work are appropriate. Compared with the experimental data, the simulated maximum absorption for the UV-vis spectrum is bathochromically shifted by about 0.15 eV. At the same time, we have calculated the UV spectrum of 1b, which is shown in Fig S1.† The peaks of 1b are similar to those of 1a, while 1b has another peak at 3.5 eV. The main absorption band of 1a at ΔE ≈ 4.6 eV is mainly a result of some intimate excited states with uniform oscillator strengths, such as states 106 and 108 in Fig. 3 (left). These excited states are usually composed of many electron transitions, therefore an electron density difference map (EDDM) is used to analyze the molecular orbitals involved in the crucial electron transitions, as well as to assign the electron transition origins for the ECD spectrum. The EDDMs were calculated using the Gauss-Sum 2.2.3 software package.38 Electron densities move from the purple area to the green area in this work. The EDDMs for excited states 5, 6, 37, 58, 66, 106 and 108 of 1a are shown in Fig. 4. The EDDMs show that the UV-vis spectral peaks are mainly ascribed to the charge transfer (CT) transitions from the {C4O4} unit and S atoms to Mo atoms. For the low-lying UV-vis spectral region, CT transitions from the S atoms in the {MoV2O2S2} units close to {MoVI2O8} increase in comparison to the high-lying range.
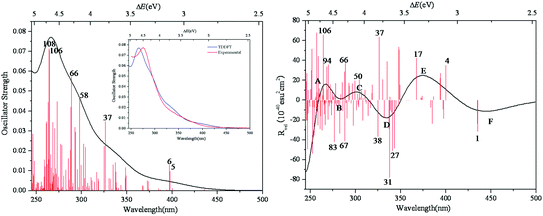 |
| | Fig. 3 Calculated UV–vis spectrum of 1a (left); experimental and simulated UV–vis spectra of 1a (inset); calculated ECD spectrum of 1a (right). The half bandwidth of σ = 0.22 eV. | |
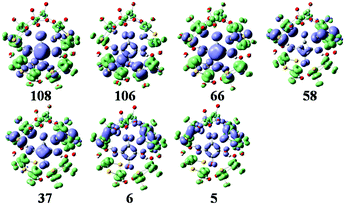 |
| | Fig. 4 The EDDMs for the main excited states that contribute to the UV–vis spectrum of 1a. Electron densities move from the purple area to the green area. | |
The simulated ECD spectrum for 1a is shown in Fig. 3 (right). The ECD bands were simulated by using a Gaussian band shape with a bandwidth of σ = 0.22 eV and are indicated by capital letters. From Fig. 3 (right), the simulated ECD spectrum of 1a shows six bands: a positive ECD band at ΔE ≈ 4.68 eV (band A), a weak negative ECD band at ΔE ≈ 4.47 eV (band B), a weak positive ECD band at ΔE ≈ 4.07 eV (band C), a negative ECD band at ΔE ≈ 3.66 eV (band D), a broad positive ECD band at ΔE ≈ 3.37 eV (band E), and a weak negative ECD band at ΔE ≈ 2.84 eV (band F). The Cotton effects around ΔE = 4.68 eV (A) and ∼3.66 eV (D) originate from the rotatory absorptions corresponding to the excitation at ΔE ≈ 4.68 eV in the UV-vis spectrum. We found that both the absorption intensity and rotatory strength for states 106, 66 and 37 were larger, hence they provide the main contributions to the UV–vis and ECD spectra. This confirms that the shoulders in the absorption spectrum coincide with the CD bands.
For clarity, the calculated excitation energies, transition states, rotatory strengths, and charge-transfer characters for the ECD bands of 1a are presented in Table 2, and the EDDM is illustrated in Table S2 (ESI†). Although the ECD bands A–F of 1a are from different excited states, the origins of these bands are mainly assigned to CT from the O and C atoms of the {C4O4} unit and S atoms to Mo and Ot atoms.
Table 2 Excitation energies (ΔE, eV), transition states, rotatory strengths, and charge transfer for the ECD bands of 1a
| Band |
ΔE (eV) |
Transition state(s) |
Rotatory strength(s) |
Charge transfer |
| A |
4.68 |
106, 94 |
65.79, 35.62 |
O and C atoms of squarate anions and S to Mo, Ot |
| B |
4.47 |
67, 66, 83 |
−41.55, 37.03, −41.86 |
O and C atoms of squarate anions and S to Mo, Ot |
| C |
4.07 |
50 |
20.40 |
O and C atoms of squarate anions and S to Mo, Ot |
| D |
3.66 |
38, 37, 31, 27 |
−36.58, 63.61, −77.86, −50.79 |
O and C atoms of squarate anions and S to Mo, Ot |
| E |
3.37 |
17, 4 |
42.11, 34.85 |
O and C atoms of squarate anions and S to Mo, Ot |
| F |
2.84 |
1 |
−31.58 |
O and C atoms of squarate anions and S to Mo, Ot |
ECD spectra of 1e-/2e-reduced clusters of 1a
In order to check whether the redox process induces the chirality transfer, or in other words, to examine the influence of the reduction on the CD spectra, the electronic structures and ECD spectra of the 1e-/2e-reduced clusters of 1a were investigated. Both the closed-shell singlet and the open-shell triplet ground states of the 2e-reduced cluster were considered, and the results show that the total energy of the open-shell cluster is 0.239 eV lower than that of the closed-shell cluster. Thus, the open-shell cluster is more stable than the closed-shell cluster. Therefore, the ECD spectrum of the open-shell cluster was further studied. The spin density distributions of [1a]− and [1a]2− are presented in Fig. 5. For the one-electron reduction process, the reduced centers are concentrated on the four Mo atoms furthest from the {MoVI2O8} unit. From Table S3 (ESI†), the spin densities for these four Mo atoms are 0.204, 0.187, 0.187 and 0.204, and the NBO charges are 0.389, 0.379, 0.379 and 0.389, respectively. The spin densities, NBO and Mulliken charges for [1a]2− are collected in Table S4.† It can be clearly seen that the extra electrons are delocalized over eight Mo atoms.
 |
| | Fig. 5 Spin density distribution computed for [1a]− (left) and [1a]2− (right). | |
The FMOs of [1a]− and [1a]2− are shown in Fig. S2 and S3,† and are obviously different from those of 1a. The α-HOMO and α-LUMO of [1a]− are localized on the two {MoV2O2S2} units furthest from the {MoVI2O8} unit. The β-HOMO is mainly localized over the {C4O4} unit, while the β-LUMO is mainly localized over the {MoVI2O8} unit and two {MoV2O2S2} units. The α-HOMO–1 for [1a]− is similar to the HOMO of 1a. The α-HOMO and α-LUMO of [1a]2− are localized on the {MoVI2O8} unit and two {MoV2O2S2} units. The β-HOMO of [1a]2− is localized on the {C4O4} unit and the two {MoV2O2S2} units adjacent to {MoVI2O8}, and the β-LUMO is mainly delocalized on the two {MoV2O2S2} units furthest from the {MoVI2O8} unit. The α-HOMO−2 of [1a]2− is similar to the HOMO of 1a. The differences in the FMOs between 1a and its reduced forms might lead to the different charge transitions and affect the ECD spectra.
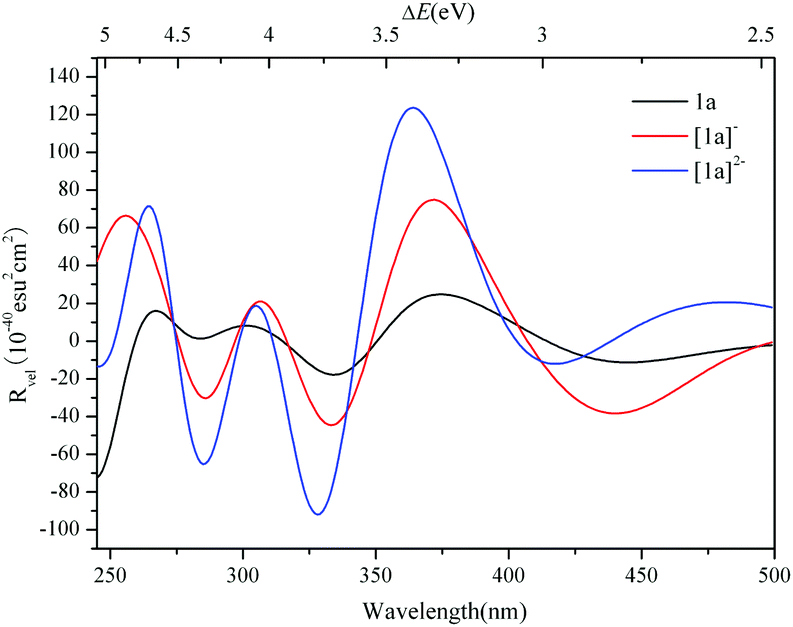
The ECD spectra of [1a]− and [1a]2− were simulated and are illustrated in Fig. 6. The ECD spectrum of 1a is also included for comparison. The ECD bands of the 1e-/2e-reduced forms of 1a are similar to those of 1a, and the low energy ECD bands are slightly bathochromically shifted with the addition of electrons, while the rotatory strengths significantly increase. The excitation energies, transition states and rotatory strengths for the ECD bands of [1a]− and [1a]2− are summarized in Tables 3 and 4, and the EDDMs for the crucial transitions contributing to the ECD spectra are shown in Fig. S4 and S5 (ESI†). For [1a]−, the EDDMs show that the excited states 122, 152, 156, 188, 196, 327, and 338 are ascribed to the charge transfer from the {C4O4} unit to Mo atoms, and the excited states 46, 52, 87, 88, 103, 104, and 124 are ascribed to the charge transfer from Mo and S atoms in {MoV2O2S2}to Mo and O atoms in {MoVI2O8}. According to these results, the origins of the chiroptical activity of [1a]− are assigned to two types of charge transfer transition: one is from the {C4O4} unit to {MoV2O2S2} and/or {MoVI2O8} units, and another is between {MoV2O2S2} and {MoVI2O8} units. The charge transfer transitions of [1a]2− are similar to those of [1a]−, while the contribution from charge transfer between {MoV2O2S2} and {MoVI2O8} units increases compared to the one-electron reduced form. In comparison with 1a, aside from the charge transfer from the {C4O4} unit to {MoV2O2S2} and/or {MoVI2O8} units, the charge transfer transitions from {MoV2O2S2} to the {MoVI2O8} unit in the 1e-/2e-reduced forms increase with the addition of electrons.
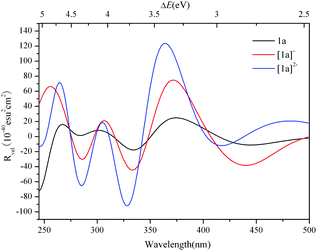 |
| | Fig. 6 Simulated ECD spectra of 1a, [1a]− and [1a]2−. | |
Table 3 Excitation energies (ΔE, eV), transition states and rotatory strengths for the ECD bands of [1a]−
| Band |
ΔE (eV) |
Transition state(s) |
Rotatory strength(s) |
| A |
4.80 |
338, 327 |
51.91, 43.88 |
| B |
4.26 |
196, 188 |
−29.45, −44.56 |
| C |
4.00 |
156, 152 |
27.38, −57.91 |
| D |
3.78 |
124, 122, 107, 104, 103 |
34.03, −34.55, −55.12, −34.19, 56.24 |
| E |
3.40 |
88, 87 |
51.83, 58.38 |
| F |
2.83 |
52, 46 |
−48.01, −32.99 |
Table 4 Excitation energies (ΔE, eV), transition states and rotatory strengths for the ECD bands of [1a]2−
| Band |
ΔE (eV) |
Transition state(s) |
Rotatory strength(s) |
| A |
4.73 |
349, 303 |
24.49, 23.48 |
| B |
4.35 |
278, 219 |
−27.93, −37.36 |
| C |
4.10 |
201, 196 |
−53.70, 27.22 |
| D |
3.78 |
158, 150 |
−71.71, −67.84 |
| E |
3.40 |
130 |
69.62 |
| F |
2.99 |
76 |
−33.68 |
Conclusions
The UV–vis and ECD spectra of chiral inorganic polythioanion Möbius strip [(Mo2S2O2)4(OH)6(C4O4) (Mo2O8)]4− (1a) were investigated by TDDFT calculations. CAM-B3LYP/6-31G*(LANL2DZ) proved sufficient to predict the excitation energies of the studied cluster. It was interesting to find that the one-electron reduced centers are concentrated on the four Mo atoms furthest from the {MoVI2O8} unit. For the two-electron reduction process, the extra electrons are delocalized over eight Mo atoms, including six MoV and two MoVI atoms. The simulated ECD spectrum of 1a shows six bands, which originate from the charge transfer from the O and C atoms of the {C4O4} unit and S atoms to Mo and Ot atoms. It is proposed that the {C4O4} unit plays a role as an optically active chromophore and contributor to the absorptions in the ECD spectrum of 1a. The shapes of the ECD bands for the 1e-/2e-reduced forms of 1a ([1a]− and [1a]2−) are similar to those of 1a, while the rotatory strengths significantly increase. In comparison with 1a, aside from the charge transfer from the {C4O4} unit to {MoV2O2S2} and/or {MoVI2O8} units, the charge transfer transitions from {MoV2O2S2} to the {MoVI2O8} unit in the 1e-/2e-reduced forms increase with the addition of electrons. The chirality transfer from the {C4O4} unit to {MoV2O2S2} and {MoVI2O8} units is obvious with the addition of electrons.
Acknowledgements
The authors gratefully acknowledge financial support from NSFC (21403033, 21203020) and the Science and Technology Development Planning of Jilin Province (201201067).
Notes and references
- H. Y. An, E. B. Wang, D. R. Xiao, Y. G. Li, Z. M. Su and L. Xu, Angew. Chem., Int. Ed., 2006, 45, 904 CrossRef CAS PubMed.
- A. Shundo, K. Hori, T. Ikeda, N. Kimizuka and K. Tanaka, J. Am. Chem. Soc., 2013, 135, 10282 CrossRef CAS PubMed.
- E. Deniz, M. Tomasulo, S. Sortino and F. M. Raymo, J. Phys. Chem. C, 2009, 113, 8491 CAS.
- J. Sivaguru, T. Poon, R. Franz, S. Jockusch, W. Adam and N. J. Turro, J. Am. Chem. Soc., 2004, 126, 10816 CrossRef CAS PubMed.
- F. P. Xiao, J. Hao, J. Zhang, C. L. Lv, P. C. Yin, L. S. Wang and Y. G. Wei, J. Am. Chem. Soc., 2010, 132, 5956 CrossRef CAS PubMed.
- D. L. Long, R. Tsunashima and L. Cronin, Angew. Chem., Int. Ed., 2010, 49, 1736 CrossRef CAS PubMed.
- M. T. Pope and A. Müller, Angew. Chem., 1991, 103, 56 (
Angew. Chem., Int. Ed. Engl.
, 1991
, 30
, 34
) CrossRef CAS.
- E. Cadot, M. N. Sokolov, V. P. Fedin, C. Simonnet-Jégat, S. Floquet and F. Sécheresse, Chem. Soc. Rev., 2012, 41, 7335 RSC.
- H. Y. Zang, H. N. Miras, J. Yan, D. L. Long and L. Cronin, J. Am. Chem. Soc., 2012, 134, 11376 CrossRef CAS PubMed.
-
E. I. Solomon and A. B. P. Lever, Inorganic Electronic Structure and Spectroscopy, Wiley-Interscience, New York, 1999 Search PubMed.
- A. Cotton, Ann. Chim. Phys., 1896, 8, 347 CAS.
-
L. Velluz, A. Legrand and M. Grosjean, Optical Circular Dichroism: Principles, Measurements and Applications, Wiley-VCH, New York, 1969 Search PubMed.
-
A. Rodger, Circular Dichroism and Linear Dichroism, Oxford University Press, Oxford, U.K., 1997 Search PubMed.
-
N. Berova, K. Nakanishi and R. W. Woody, Circular Dichroism: Principles and Applications, Wiley-VCH, New York, 2000 Search PubMed.
- D. Y. Du, L. K. Yan, Z. M. Su, S. L. Li, Y. Q. Lan and E. B. Wang, Coord. Chem. Rev., 2013, 257, 702 CrossRef CAS.
- J. Fan and T. Ziegler, Chirality, 2011, 23, 155 CrossRef CAS PubMed.
- Y. M. Sang, L. K. Yan, J. P. Wang and Z. M. Su, J. Phys. Chem. A, 2012, 116, 4152 CrossRef CAS PubMed.
- A. Vargas, M. Zerara, E. Krausz, A. Hauser and L. M. Lawson Daku, J. Chem. Theory Comput., 2006, 2, 1342 CrossRef CAS.
- P. W. Thulstrup and E. Larsen, Dalton Trans., 2006, 1784 RSC.
- F. E. Jorge, J. Autschbach and T. Ziegler, J. Am. Chem. Soc., 2005, 127, 975 CrossRef CAS PubMed.
- J. Fan and T. Ziegler, Inorg. Chem., 2008, 47, 4762 CrossRef CAS PubMed.
- F. J. Coughlin, M. S. Westrol, K. D. Oyler, N. Byrne, C. Kraml, E. Zysman-Colman, M. S. Lowry and S. Bernhard, Inorg. Chem., 2008, 47, 2039 CrossRef CAS PubMed.
- F. J. Coughlin, K. D. Oyler, R. A. Pascal Jr. and S. Bernhard, Inorg. Chem., 2008, 47, 974 CrossRef CAS PubMed.
- J. Fan, M. Seth, J. Autschbach and T. Ziegler, Inorg. Chem., 2008, 47, 11656 CrossRef CAS PubMed.
- M. Jawiczuk, M. Górecki, A. Suszczyńska, M. Karchier, J. Jaźwiński and J. Frelek, Inorg. Chem., 2013, 52, 8250 CrossRef CAS PubMed.
- Y. M. Sang, L. K. Yan, N. N. Ma, J. P. Wang and Z. M. Su, J. Phys. Chem. A, 2013, 117, 2492 CrossRef CAS PubMed.
- J. P. Wang, G. C. Yang, L. K. Yan, W. Guan, S. Z. Wen and Z. M. Su, Dalton Trans., 2012, 41, 10097 RSC.
- J. P. Wang, L. K. Yan, G. C. Yang, W. Guan and Z. M. Su, J. Mol. Graphics Modell., 2012, 35, 49 CrossRef CAS PubMed.
- L. K. Yan, X. López, J. J. Carbó, R. Sniatynsky, D. C. Duncan and J. M. Poblet, J. Am. Chem. Soc., 2008, 130, 8223 CrossRef CAS PubMed.
-
M. J. Frisch, G. W. Trucks, H. B. Schlegel, G. E. Scuseria, M. A. Robb, J. R. Cheeseman, G. Scalmani, V. Barone, B. Mennucci, G. A. Petersson, H. Nakatsuji, M. Caricato, X. Li, H. P. Hratchian, A. F. Izmaylov, J. Bloino, G. Zheng, J. L. Sonnenberg, M. Hada, M. Ehara, K. Toyota, R. Fukuda, J. Hasegawa, M. Ishida, T. Nakajima, Y. Honda, O. Kitao, H. Nakai, T. Vreven, J. A. Montgomery Jr., J. E. Peralta, F. Ogliaro, M. Bearpark, J. J. Heyd, E. Brothers, K. N. Kudin, V. N. Staroverov, R. Kobayashi, J. Normand, K. Raghavachari, A. Rendell, J. C. Burant, S. S. Iyengar, J. Tomasi, M. Cossi, N. Rega, J. M. Millam, M. Klene, J. E. Knox, J. B. Cross, V. Bakken, C. Adamo, J. Jaramillo, R. Gomperts, R. E. Stratmann, O. Yazyev, A. J. Austin, R. Cammi, C. Pomelli, J. W. Ochterski, R. L. Martin, K. Morokuma, V. G. Zakrzewski, G. A. Voth, P. Salvador, J. J. Dannenberg, S. Dapprich, A. D. Daniels, O. Farkas, J. B. Foresman, J. V. Ortiz, J. Cioslowski and D. J. Fox, Gaussian 09, Revision D.01, Gaussian, Inc., Wallingford, CT, 2009 Search PubMed.
- J. P. Perdew, K. Burke and M. Ernzerhof, Phys. Rev. Lett., 1996, 77, 3865 CrossRef CAS PubMed.
- J. P. Perdew, K. Burke and M. Ernzerhof, Phys. Rev. Lett., 1997, 78, 1396 CrossRef CAS.
- P. J. Hay and W. R. Wadt, J. Chem. Phys., 1985, 82, 270 CrossRef CAS.
-
(a) M. M. Francl, W. J. Pietro, W. J. Hehre, J. S. Binkley, M. S. Gordon, D. J. Defrees and J. A. Pople, J. Chem. Phys., 1982, 77, 3654 CrossRef CAS;
(b) W. J. Hehre, R. Ditchfield and J. A. Pople, J. Chem. Phys., 1972, 56, 2257 CrossRef CAS;
(c) P. C. Hariharan and J. A. Pople, Theor. Chim. Acta, 1973, 28, 213 CrossRef CAS.
- J. Tomasi, B. Mennucci and R. Cammi, Chem. Rev., 2005, 105, 2999 CrossRef CAS PubMed.
- B. Hasenknopf, K. Micoine, E. Lacote, S. Thorimbert, M. Malacria and R. Thouvenot, Eur. J. Inorg. Chem., 2008, 32, 5001 CrossRef.
- T. Yanai, D. Tew and N. Handy, Chem. Phys. Lett., 2004, 393, 51 CrossRef CAS.
- N. M. O'boyle, A. L. Tenderholt and K. M. Langner, J. Comput. Chem., 2008, 29, 839 CrossRef PubMed.
Footnote |
| † Electronic supplementary information (ESI) available. See DOI: 10.1039/c5qi00175g |
|
| This journal is © the Partner Organisations 2016 |
Click here to see how this site uses Cookies. View our privacy policy here.