
NMR analysis of the binding mode of two fungal endo-β-1,4-mannanases from GH5 and GH26 families†
Roberta
Marchetti
*a,
Jean-Guy
Berrin
b,
Marie
Couturier
b,
Shah Ali
Ul Qader
ac,
Antonio
Molinaro
a and
Alba
Silipo
*a
aDepartment of Chemical Sciences, Università di Napoli Federico II, Complesso Universitario Monte S. Angelo, Via Cintia 4, I-80126, Naples, Italy. E-mail: silipo@unina.it; roberta.marchetti@unina.it
bINRA, UMR1163 BBF, 13009 Marseille, France
cThe Karachi Institute of Biotechnology and Genetic Engineering (KIBGE) University of Karachi, Karachi 75270, Pakistan
First published on 3rd November 2015
Abstract
The enzymatic digestion of the main components of lignocellulosic biomass, including plant cell wall mannans, constitutes a fundamental step in the renewable biofuel production, with great potential benefit in the industrial field. Despite several reports of X-ray structures of glycoside hydrolases, how polysaccharides are specifically recognized and accommodated in the enzymes binding site still remains a pivotal matter of research. Within this frame, NMR spectroscopic techniques provide key binding information, complementing and/or enhancing the structural view by X-ray crystallography. Here we provide deep insights into the binding mode of two endo-β-1,4 mannanases from the coprophilous ascomycete Podospora anserina, PaMan26A and PaMan5A, involved in the hydrolysis of plant cell wall mannans and heteromannans. The investigation at a molecular level of the interaction between the wild-type enzymes and inactive mutants with manno-oligosaccharides, revealed a different mode of action among the two glycoside hydrolases most likely due to the presence of the additional and peculiar −4 subsite in the PaMan26A binding pocket.
Introduction
Lignocellulose is one of the main constituents of plants, providing rigidity and structure to the cell wall, and represents the main source of renewable organic material. It primarily consists of lignin, cellulose, pectins and hemicelluloses, with proportions varying among plant species and tissues.1 In turn, hemicelluloses include structural polysaccharides among which mannans are one of the most important members, mainly found in softwood (galactoglucomannan) but present in smaller amounts also in hardwood (glucomannan).2 In nature, different forms of mannans are observed; they comprise homogeneous linear polymers composed of β-1,4-linked mannose residues, referred to as mannan, or heterogeneous polysaccharides formed by a combination of different building blocks of glucose and mannose residues. In addition, each type of mannan-based polymer can be decorated occasionally with side chains of α-1,6-linked galactose residues. Beyond their structural functions, mannans serve as seed storage and are involved in plant cell differentiation as key signaling molecules.3 Due to the possibility of using mannans in biorefinery processes as an alternative to the petroleum-based materials, there is increasing attention on the study of their value-added applications and hydrolysis.The bioconversion of renewable biomass is initiated primarily by microorganisms, such as bacteria and fungi,4 which are characterized by complex lignocellulolytic enzymatic machineries, including a great variety of glycoside hydrolases (GHs). The term glycoside hydrolases refers to a widespread group of enzymes, ubiquitous in nature, with the capability to catalyze the hydrolysis of O-, N- and S-glycosidic bonds. Since, over the years, a plethora of amino acid sequences have been identified as GHs, the classification in families, based on several parameters, including the mechanism of action and structural fold, nowadays results in 133 different families.5 This list is constantly growing and continuously updated in the Carbohydrate-Active Enzymes (CAZy) server (http://www.cazy.org). As a consequence of GHs’ substrate diversity, it is not surprising that glycosidases play a key role in a broad spectrum of biological processes, including glycoprotein maturation, cellular homeostasis and primary metabolism.6 On the other hand, their ability to degrade polysaccharides found as storage and structural polymers in plant cell walls have drawn a lot of attention on a variety of GH applications in industrial and biotechnological fields.7 In the last few years, many efforts were directed toward the optimization of the GHs’ role in the emerging field of renewable energies.8 The enzymatic digestion of lignocellulosic materials from abundant and underutilized resources, such as crops and grasses, indeed, constitutes a convenient and sustainable method for the production of second-generation bioethanol.
Among the variety of hydrolytic enzymes belonging to bacterial/fungal degrading systems and involved in the saccharification of lignocellulosic biomass, β-mannanases are responsible for the cleavage of mannose containing glycoconjugates and polysaccharides. This class of GHs is of great value in the biorefinery process, since, as mentioned above, one of the main hemicellulose component, especially in softwoods, is the β-1,4-mannan.
Although X-ray studies have been used to solve the three dimensional structures of a range of bacterial and fungal β-mannanases,9,10 refining the knowledge on the structure and function of these plant cell wall degrading enzymes represents a pivotal step to enhance their application as a biocatalyst in both biological and industrial fields.
Here, we have focused our attention on the glycoside hydrolase families GH26 and GH5, which are crucial in the digestion of plant derived mannans. In detail, we have analyzed two enzymes from the filamentous, ascomycete fungi Podospora anserina, belonging respectively to fungal GH26 and GH5 endo-β-1,4 mannanases (herein PaMan26A and PaMan5A). They share some structural features typical for the GH-A clan members, including the (β/α)8-barrel fold, with relatively conserved amino acids, e.g. Glu residues, located at the active site, which function as an acid/base and a nucleophile. Furthermore, both enzyme families cleave the internal linkages of the mannan backbone through a retaining double displacement mechanism.11 However, the number of substrate-binding subsites necessary to perform an efficient hydrolysis, as well as the interaction within the enzyme–substrate complex, may vary. Recently, a different mode of action for the two families of mannanases, GH26 and GH5, which induce the release of different mannan hydrolysis products, has been shown.12 This suggested the involvement of different protein subsites in the recognition and interaction with manno-oligosaccharides.
In order to improve the knowledge on the P. anserina enzymatic machinery involved in the degradation of lignocellulosic biomass, supporting and extending previous analyses,12 we have investigated the binding mode of the two enzymes, PaMan26A and PaMan5A, in the interaction with several manno-oligosaccharides. Specifically, we used Saturation Transfer Difference NMR to gain deep insight into the interacting epitope of manno-oligosaccharides of different lengths for both PaMan26A and PaMan5A. The STD NMR method, indeed, represents a powerful tool not only to discriminate between binders and non-binders, but also to define the ligand regions in intimate contact with the receptor in the case of intermolecular interactions.13 Thus, STD NMR analysis allowed us to characterize at atomic resolution the binding mode of the two enzymes; in parallel, tr-NOESY experiments have been carried out with the aim to investigate the conformational behavior of mannan substrates.13,14
Our results furnished a firm support to previous data, extending the existing view by X-ray and underlying the involvement of different protein subsites in mannan recognition among the two enzyme families.
Results and discussion
Binding epitope of the hydrolysis products to wild-type PaMan26A and PaMan5A
As a first step toward the comprehension of the binding mode of the two glycoside hydrolases PaMan26A and PaMan5A in the interaction with manno-oligosaccharides, we investigated different hydrolysis products in the presence of each enzyme. Saturation Transfer Difference (STD) NMR method was used to unravel the ligand moieties involved in the interaction with the proteins and allowed us to map their interacting epitope.14Firstly, we have analyzed the binding of PaMan26A and PaMan5A with D-mannose, one of the typical products derived from the enzymatic hydrolysis of manno-oligosaccharides. Upon the addition of D-mannose, no STD signals were observed neither to PaMan26A nor to PaMan5A (data not shown), indicating that neither of the two proteins possessed the ability to bind the free reducing mannose.
In addition, we studied the complex of both enzymes with another recurring mannan hydrolysis product, the β-1,4-mannotriose, M3 (see ESI, Table S1† for NMR assignment). From a qualitative analysis of the two STD NMR spectra, performed under the same experimental conditions, it was clearly inferred that the two enzymes exhibited a different mode of binding (Fig. 1, see also ESI, Table S2†). The fingerprint of the spectra and the relative intensities of the STD signals, indeed, gave the first evidence of a different fashion of substrate accommodation in the protein binding sites.
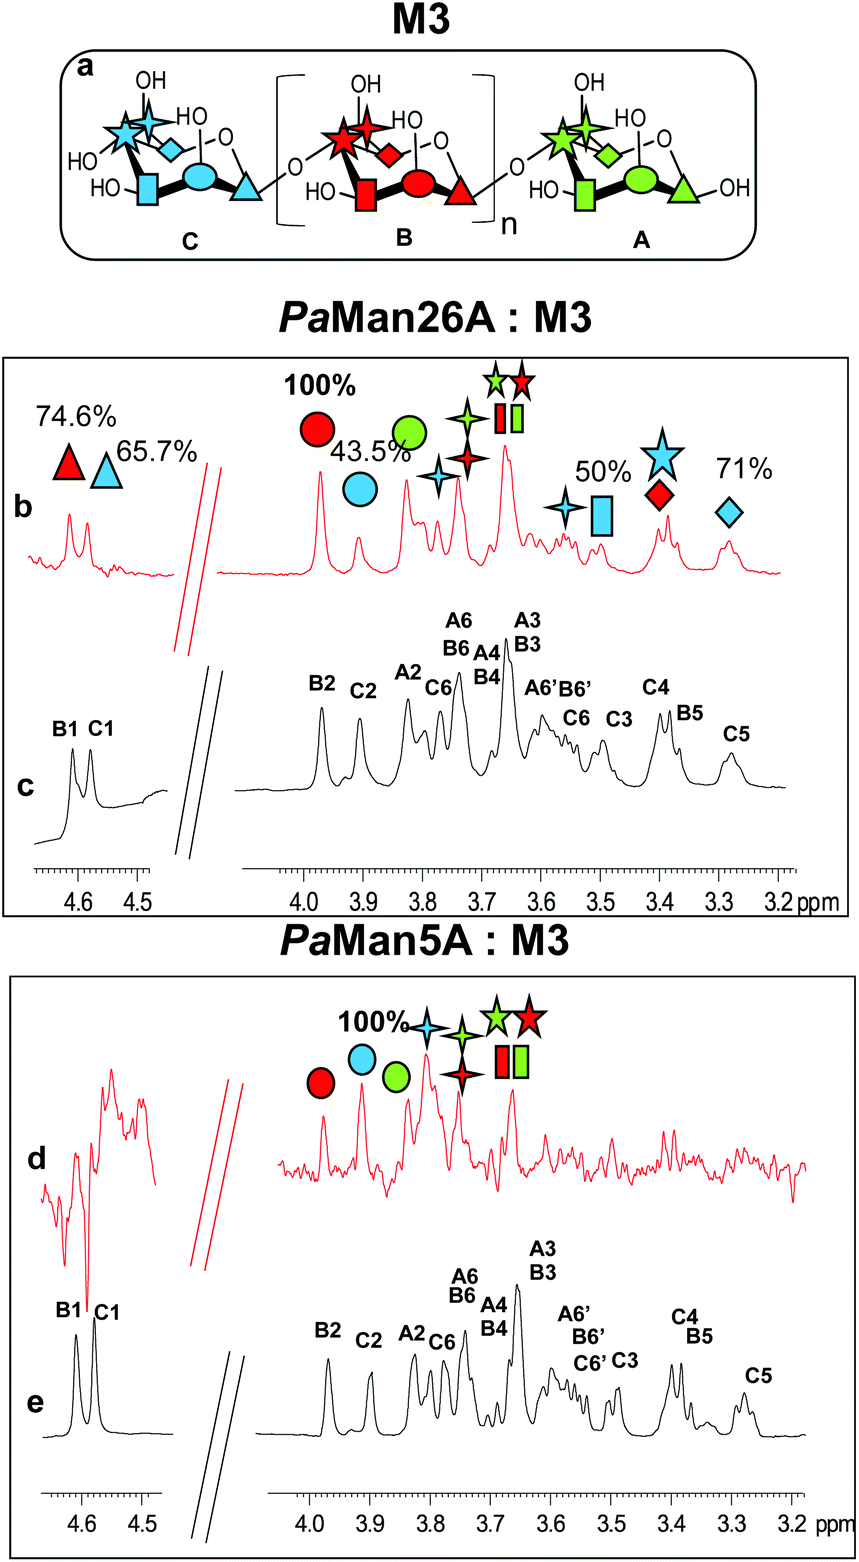 | ||
Fig. 1 Comparison between the binding of mannotriose, M3, to the glycoside hydrolases PaMan26A and PaMan5A. (a) Chemical structure of the ligands; n = 1 in the case of M3; n = 3 in the case of M5; n = 4 in the case of M6. Different colored symbols were used to distinguish between the different protons on the different sugar residues. (b) STD NMR spectrum on the mixture PaMan26A![[thin space (1/6-em)]](https://www.rsc.org/images/entities/char_2009.gif) :M3 1:50. (c) 1H NMR spectrum of the product M3 in the presence of the enzyme. (d) STD NMR spectrum on the mixture PaMan5A:M3 1:50. (e) 1H NMR spectrum of the product M3 in the presence of the enzyme. The experiments were carried out at 280 K with a saturation time of 2 s; the on resonance was set to 0.4 ppm. The numbers on the STD spectrum show the normalized levels of saturation (%) received by each ligand proton upon binding with the enzyme. :M3 1:50. (c) 1H NMR spectrum of the product M3 in the presence of the enzyme. (d) STD NMR spectrum on the mixture PaMan5A:M3 1:50. (e) 1H NMR spectrum of the product M3 in the presence of the enzyme. The experiments were carried out at 280 K with a saturation time of 2 s; the on resonance was set to 0.4 ppm. The numbers on the STD spectrum show the normalized levels of saturation (%) received by each ligand proton upon binding with the enzyme. | ||
Although the same protein and ligand concentrations were used for both the analyses, the signal to noise ratio was lower for the interaction of the mannotriose M3 with PaMan5A with respect to that of PaMan26A. It may suggest a lower affinity of the glycosidase PaMan5A for this product. Furthermore, due to the overlapping between some ligand resonances, the quantitative analysis of the STD effects was hindered; however, a qualitative comparison of the STD intensities suggested that the interaction of M3 with each enzyme preferentially engaged different ligand protons. In both cases, the presence of STD signals ascribable to the three mannose residues indicated that the whole saccharide moiety was accommodated in the binding pocket (Fig. 1). However, in the case of PaMan26A interactions with M3, the central mannose residue B, and especially the proton at position 2, received the largest amount of magnetization, thereby indicating its strong involvement in the binding. In parallel, STD enhancements belonging to the terminal mannose C were observed and almost all of them exhibited a level of saturation above 50%. Further information on the ligand binding epitope could be gained by the analysis of the shape of STD signals. For instance, at 3.38 ppm it resonated either H4 of the terminal residue C or H5 of the internal mannose B; nevertheless, the presence of a triplet resonating at 3.38 ppm in the STD spectrum allowed us to identify it as H4 of residue C, suggesting its contribution to the interaction (Fig. 1b and c).
On the contrary, by analyzing the STD signals of the M3 ligand when bound to PaMan5A, the highest transfer of magnetization was observed for the proton at position 2 of the terminal mannose C; furthermore, H6 also significantly contributed to the interaction with the protein while other protons within such residues, i.e. H3, H4 and H5, showed a decreased STD intensity (Fig. 1d and e).
These outcomes indicated that the two glycoside hydrolases do not share a common mode of binding for manno-oligosaccharides. Although both enzymes accommodated the whole oligosaccharide, the NMR results suggested the involvement of different protein subsites, in agreement with the previously reported data.12
The STD NMR results were then complemented with tr-NOESY analysis in order to investigate the bioactive conformation of the ligand.
In detail, NOESY experiments with different mixing times were performed on the ligand alone in solution and in the presence of each enzyme by using a protein:ligand ratio of 1:20. Negative NOE contacts were observed for the ligand M3 in both the free and bound states. The overlapping between several signals impaired a detailed study of all important cross peaks; however, a more qualitative evaluation of inter-residual NOE signals (Fig. 2 and 3) permitted us to deduce that in both free and bound states there was an equilibrium between the two main predicted energetic minima for the β-1,4 linkage (Table 1).
 | ||
| Fig. 2 Binding of M3 to PaMan5A and PaMan26A monitored by transferred NOESY. A section of the 2D NOESY experiment carried out on the ligand M3 in the free state (A) and in the presence of PaMan26A (B) and PaMan5A (C) with a mixing time of 400 ms and a protein ligand ratio of 1:20. | ||
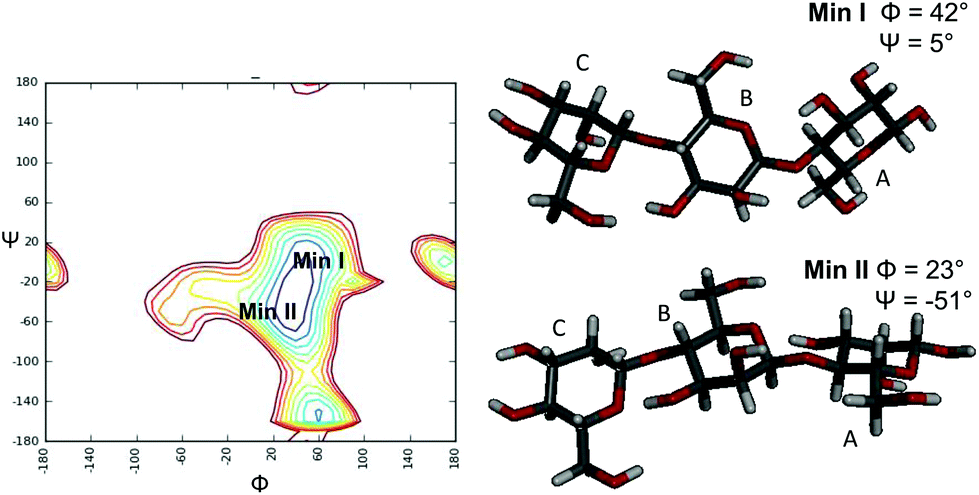 | ||
| Fig. 3 Adiabatic energy map of β-(1-4)-manno-oligosaccharides indicating the two global minima: one conformational state characterized from the positive values of the inter-glycosidic dihedral angles (Min I), and one with positive Φ value and negative ψ value (Min II). | ||
| Experimental free M3 | Experimental M3 bound to PaMan26A | Experimental M3 bound to PaMan5A | Calculated Min I Φ = 42. Ψ = 5 | Calculated Min II Φ = 23 Ψ = −51 | |
|---|---|---|---|---|---|
| Nd: not detected. No NOE signal was observed. Nc: not calculated. NOE signal was observed but the overlapping unpaired the integration. | |||||
| C1–B4 | 2.3 | 2.4 | 2.4 | 2.3 | 2.4 |
| C1–B5 | nd | 3.8 | nd | 3.9 | 4.5 |
| C1–B6 | nd | 2.9 | 3.1 | 2.5 | 4.2 |
| C2–B4* | nd | nd | nd | 4.3 | 3.7 |
| C2–B6′* | nd | 2.7 | 2.5 | 2.9 | 3.6 |
| C5–B4 | nd | 3.9 | nd | 3.9 | 4.7 |
Nevertheless, slight changes in the cross-peak intensities and in some key inter-proton distances were detected in the bound states; indeed, some intermolecular NOE contacts, such as the cross peak C1–B6, were present in tr-NOESY spectra of both systems PaMan26A:M3 and PaMan5A:M3, whereas they were not detected in the NOESY spectrum of the ligand alone. Although thin differences in the cross-peak intensities between the two bound states were observed (Table 1), the overall results detected a slight preference of the M3 ligand for the minimum characterized from the positive values of glycosidic dihedral angles, upon binding to each enzyme. It suggests that the energetic minimum I was more populated in both the bound states (Fig. 2, 3 and Table 1). Thus, a conformer selection was revealed when M3 bound to PaMan26A and PaMan5A mannanases.
Binding epitope of the hydrolysis substrates to catalytic inactive mutants PaMan26A-E390A and PaMan5A-E283A
Two longer manno-oligosaccharide substrates, M5 and M6, were then investigated in their interaction with catalytically inactive mutants of PaMan26A and PaMan5A. The replacement of the glutamate acting as a nucleophile with an alanine residue (E390 and E283 for PaMan26A and PaMan5A respectively) impaired the catalytic activity of the enzymes. This impeded the oligosaccharide hydrolysis allowing us to investigate the whole substrates when bound to the proteins, in the absence of the hydrolysis products.The comparison of STD NMR spectra showed that both substrates, the mannopentose and the mannohexose, were similarly accommodated in the protein binding pocket (Fig. 4 and 5, see also ESI Tables S3 and S4†). Although the severe overlap between proton signals, especially for those belonging to different internal B residues, hindered an accurate quantitative analysis, a qualitative estimation of STD enhancements permitted us to identify the ligand moieties more involved in the interaction with each enzyme. As for the interaction with PaMan26A-E390A (Fig. 4), NMR data suggested that the entire oligosaccharides were in contact with the surface of the enzyme. As for the hydrolysis product recognition, the highest transfer of magnetization was observed for the proton at position 2 of the internal mannose residues, B; however, the presence of lesser STD signals belonging to the residues C and A indicated that these moieties also contributed to the binding.
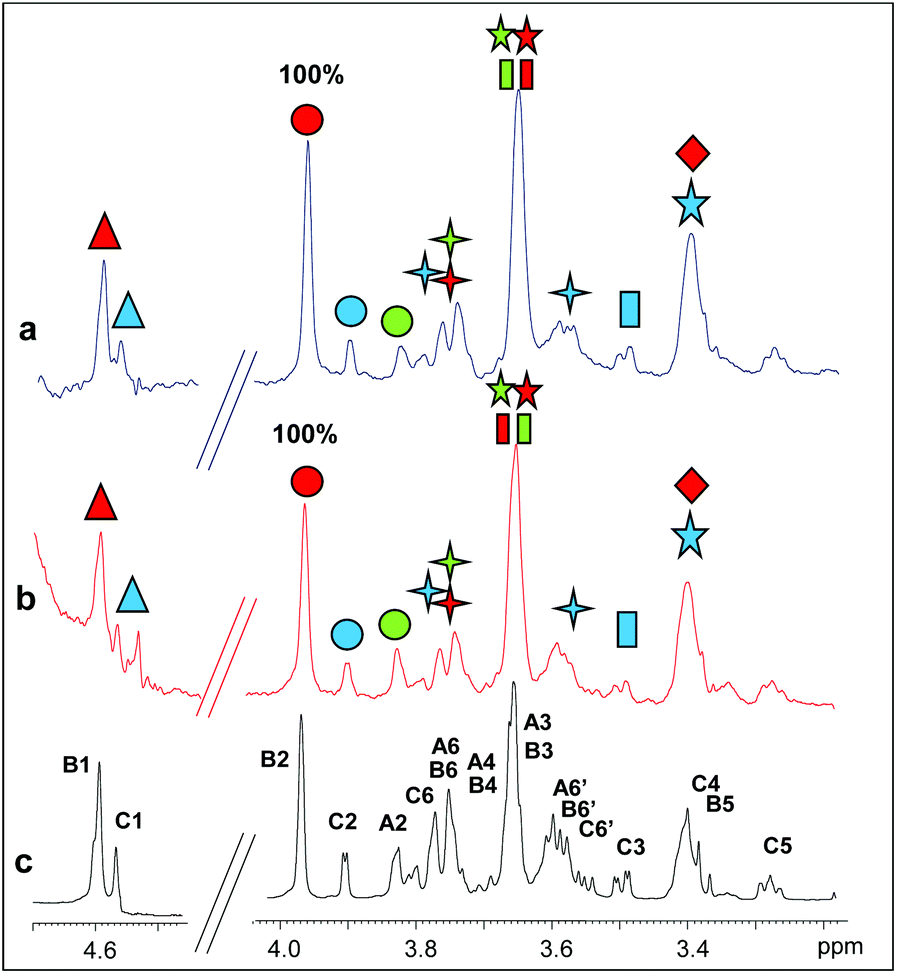 | ||
| Fig. 4 Binding of PaMan26A-E390A to M5 and M6. (a) STD NMR spectrum on the mixture PaMan26A-E390A:M6. (b) STD NMR spectrum on the mixture PaMan26A-E390A:M5. (c) 1H NMR spectrum of the mannohexose in the presence of the enzyme. The protein:ligand ratio was 1:50; the saturation time was set at 2 s. The experimental temperature was 280 K and the on resonance was set to 7.1 ppm. The numbers on the STD spectrum show the normalized levels of saturation (%) received by each ligand proton upon binding with the enzyme. | ||
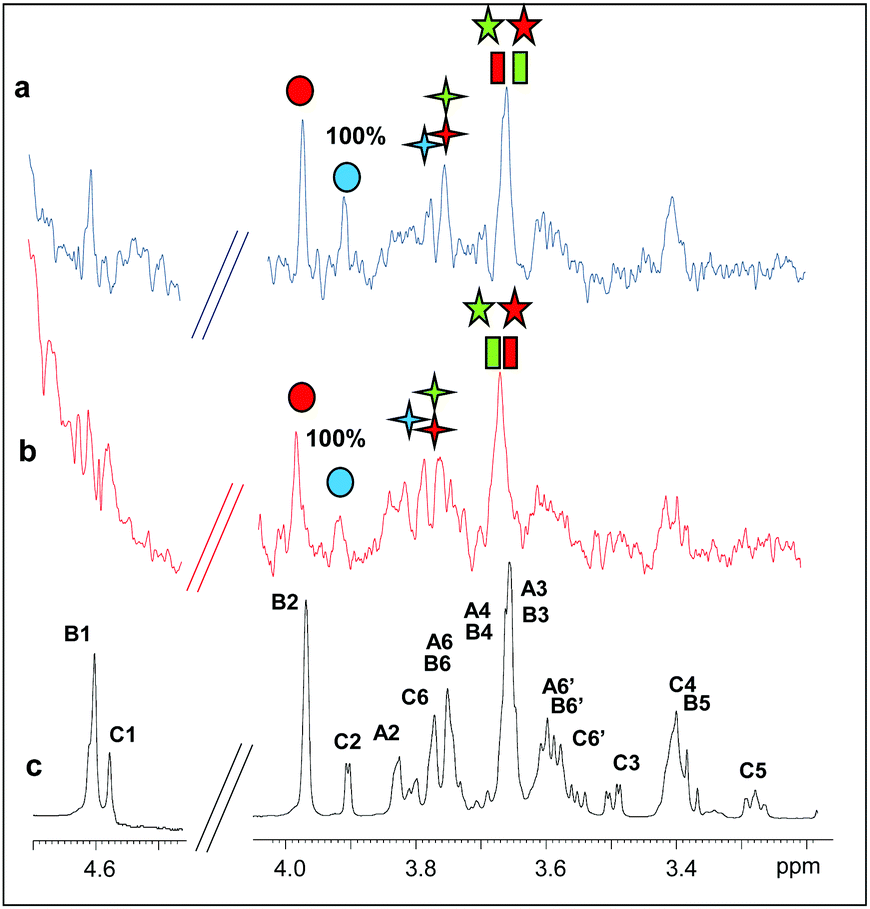 | ||
| Fig. 5 Binding of PaMan5A-E283A to M5 and M6. (a) STD NMR spectrum on the mixture PaMan5A-E283A:M6. (b) STD NMR spectrum on the mixture PaMan5A-E283A:M5. (c) 1H NMR spectrum of the mannohexose in the presence of the enzyme. The protein:ligand ratio was 1:50; the saturation time was set at 2 s. The experimental temperature was 280 K and the on resonance was set to 7.1 ppm. | ||
In the case of the interaction of PaMan5A-E283A with hydrolysis substrates (Fig. 5), lower STD intensities were observed, once again suggesting that this enzyme bound more weakly to manno-oligosaccharides with respect to the glycosidase PaMan26A. However, the analysis of NMR data showed that M5 and M6 bound to the enzyme through a common mode, specifically via the non-reducing end of the molecule. In detail, H2 and H6 protons of the terminal residue C exhibited high STD enhancements. The STD profile showed that the residues A and B were also involved in the interaction to some extent.
To resume, a comparison of the STD relative intensities belonging to the penta- and hexa-saccharidic substrates bound to the mutant variants of PaMan26A and PaMan5A suggested a different mode of action of the two enzymes, supporting the hypothesis that the predominant binding mode was mediated by different protein subsites.
Binding epitope of M5 to wild-type PaMan26A and PaMan5A
To further examine the mechanism of action of the P. anserina mannanases, we choose to investigate the interaction between the wild type enzymes, PaMan26A and PaMan5A, with the hydrolysis substrate M5. By using NMR spectroscopic techniques, we qualitatively estimated the contribution of the ligand moieties to the binding (Fig. 6). The analysis of STD NMR effects (see also ESI, Fig. S1†) confirmed the previous results revealing striking differences between the P. anserina glycosidases’ mode of action. The pattern of STD enhancements of the M5 ligand when bound to PaMan26A and PaMan5A was indeed different, indicating the involvement to a major extent of different oligosaccharide moieties. In detail, although the whole oligosaccharide was accommodated in both protein binding pockets, the recognition of the mannan substrates occurred mainly through the non-reducing end of the ligand when bound to PaMan5A. On the other hand, in the presence of the mannanase PaMan26A, the internal mannose residues were more involved in the interaction with the enzyme.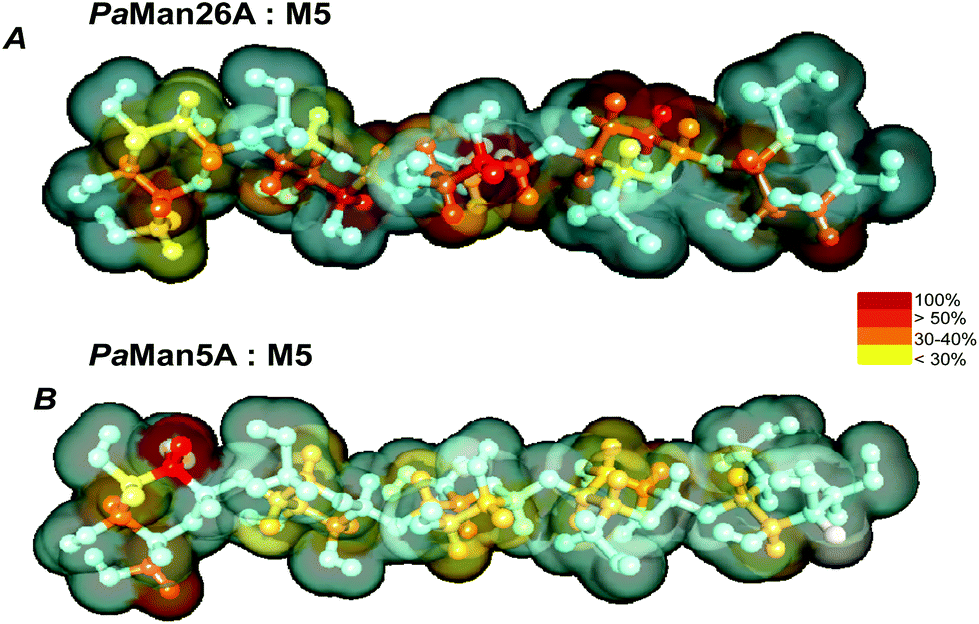 | ||
| Fig. 6 STD-derived epitope mapping on the molecular envelope of M5 when bound to PaMan26A (A) and PaMan5A (B), with color coding from the highest (red) to the lowest (yellow) observed STD effect according to the scale shown in the figure. | ||
All the above NMR data allowed us to manually dock the mannopentose onto the 3D structure of both enzymes: PaMan26A (PDB accession code 3ZM8, Fig. 7) and PaMan5A (PDB accession code 3ZIZ, Fig. 8). The resulting complexes showed differences between the mannanase subsites involved in substrate binding (Fig. 7 and 8).
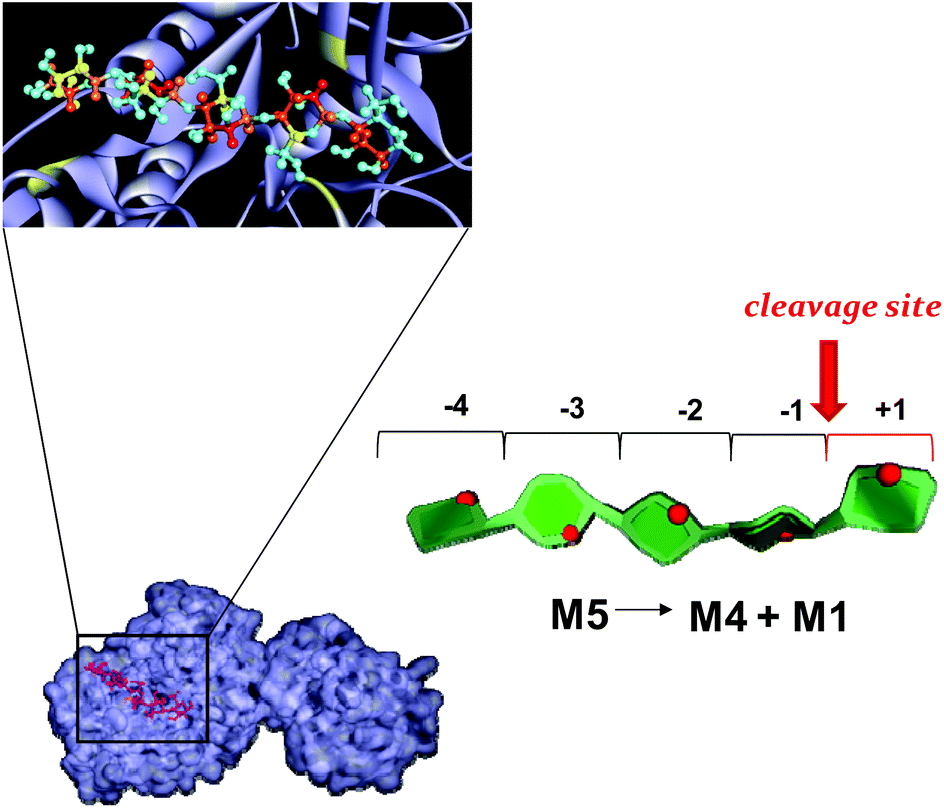 | ||
| Fig. 7 Mannopentose modelled into the proposed binding site of PaMan26A (−4 to +1 subsites).The PDB accession code for the structure PaMan26A was under the number 3ZIZ. The glutamate residues of the active site involved in the interaction, as well as the Trp residues within the −4 subsite, are highlighted (yellow). The model of the bound ligand is consistent with NMR experimental data although it represented only one of the disparate possible structures. The STD effects derived from a qualitative analysis of NMR spectra are reported on the molecular envelope of M5 with color coding from the lowest (yellow) to the highest (red).The favorite cleavage site and the main products for the M5 hydrolysis when bound to PaMan26A are depicted in the stylized images on the right of the figures. The oligosaccharide structures are drawn by using the program Sweet Unity Mol (http://sourceforge.net/projects/unitymol/files/). | ||
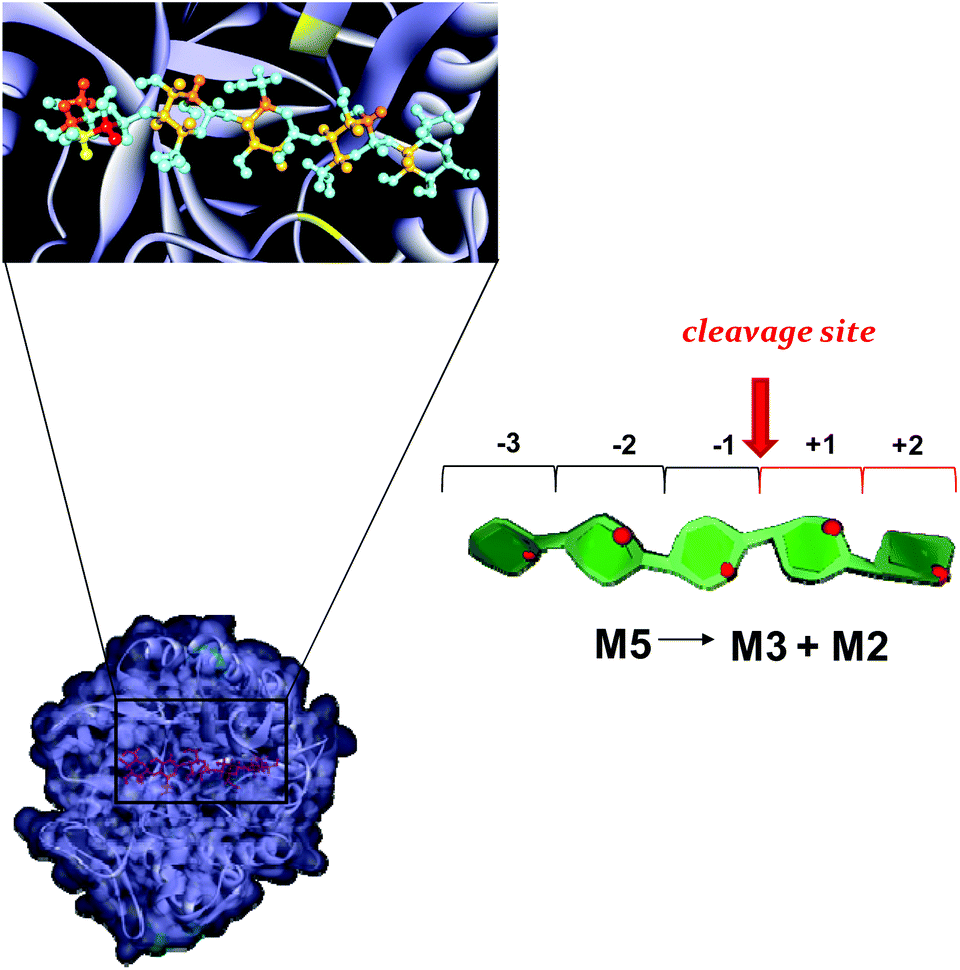 | ||
| Fig. 8 Mannopentose modelled into the proposed binding site of PaMan5A (−3 to +2 subsites). The PDB accession code for the structure PaMan5A was under the number 3ZM8. The glutamate residues of the active site involved in the interaction are highlighted (yellow). The model of the bound ligand is consistent with NMR experimental data although it represented only one of the disparate possible structures. The STD effects derived from a qualitative analysis of NMR spectra are reported on the molecular envelope of M5 with color coding from the lowest (yellow) to the highest (red).The favorite cleavage site and the main products for the M5 hydrolysis in the presence of PaMan5A are depicted in the stylized images on the right of the figures. The oligosaccharide structures are drawn by using the program Sweet Unity Mol (http://sourceforge.net/projects/unitymol/files/). | ||
Our STD NMR data were in agreement with the supposed presence of an added negative enzyme subsite (−4; nomenclature according to Davies et al.15) in the case of PaMan26A. The protein aromatic residues Trp-244 and Trp-245, belonging to the −4 subsite, indeed, made contact with the terminal sugar of M5. These interactions contribute to stabilize the mannopentose in the −4 to +1 subsites (Fig. 7) promoting the uncommon cleavage of the reducing end of M5. This supported the hypothesis of an unusual arrangement of the oligosaccharide in the active site, as previously described.12 The hydrolysis pattern derived from the cleavage of M5 by PaMan26A was indeed interestingly different from other GH26 endo-mannanases, including CjMan26A from C. japonicus,16BCMan from B. subtilis,17 and CfMAn26A from C. fimi.18
On the contrary, PaMan5A showed the usual pattern of hydrolysis with the release of M3 and M2 from M5, as explained by the lack of the negative protein subsite −4, which fosters a displacement of the substrate in the catalytic site with the consequent release of different hydrolysis products (Fig. 8).
According to our study, indeed, the residue C is bound to the subsite −4 in PaMan26A and in subsite −3 in PaMan5A. It means that using M3 as a substrate we have an unproductive binding (no product released). However, using M5 as a substrate we release M3 + M2 in the case of Man5A and M4 + M1 in the case of Man26A (which is unusual in endo-beta 1,4 mannanases). The latter is due to the fact that binding at the −4 subsite is strong, therefore the M5 substrate spans from −4 to +1 subsites. Again, in PaMan5A there is no −4 subsite so we cannot compare PaMan26A and PaMan5A with regard to the −4 subsite.
Experimental
PaMan26A and PaMan5A wild-type and mutant production and purification
PaMan26A and PaMan5A were produced in Pichia pastoris as previously described,19,20 and PaMan26A-E390A and PaMan5A-E283A were also produced in P. pastoris as described in Couturier et al. (2011). Purification was carried out as described in Couturier et al. (2013).20 Briefly, the first step of purification consisted of affinity chromatography using a nickel chelate His-Bind Resin (GE Healthcare) equilibrated with 50 mM Tris-HCl (pH 7.8), 150 mM NaCl, and 10 mM imidazole. The concentrated P. pastoris supernatant was diluted in the equilibration buffer and loaded onto the column at 4 °C. The enzyme was eluted with the same buffer containing 150 mM imidazole. Further purification was achieved by an additional size exclusion chromatographic step. The eluate was concentrated using a Vivaspin with a 10 kDa cut-off polyethersulfone membrane (Sartorius, Palaiseau, France), and dialysed in 20 mM Hepes pH 7.5 and 150 mM NaCl. The concentrated fraction was subsequently loaded onto a Superdex S200 HiLoad 16/60 column (Amersham, Buckinghamshire, UK). The fractions containing the enzyme were pooled and concentrated using a Vivaspin with a 10 kDa cut-off polyethersulfone membrane.NMR spectroscopy
All the experiments were recorded on a Bruker 600 MHz DRX spectrometer equipped with a cryo probe at 280 K. The samples were dissolved in deuterated phosphate buffered saline (PBS) at pH 6.5, and the spectra were calibrated by using [D4] (trimethylsilyl)propionic acid sodium salt (TSP, 10 mM) as the internal reference. The enzymes were exchanged in PBS by using Vivaspin filters and a protein concentration of 20 μM (in 500 μl) was used for all the experiments.All the ligands (prepared by controlled enzymic hydrolysis of mannan) were purchased from Megazyme International (Bray, Ireland).
The ligand proton resonances were assigned by employing a combination of 1D and 2D NMR experiments including COSY, TOCSY, NOESY and HSQC (see the ESI†). 1H NMR spectra were acquired with 32k and 64k data points. Double quantum-filtered phase sensitive COSY experiments were performed by using data sets of 4096 × 512 (t1 × t2) points. Total Correlation Spectroscopy (TOCSY) spectra were acquired with a spin lock time of 100 ms and data sets of 4096 × 256 points. Nuclear Overhauser enhancement spectroscopy (NOESY) spectra were measured with data sets of 4096 × 256 points; mixing times between 100 and 600 ms were used. Heteronuclear single quantum coherence (HSQC) experiments were performed in the 1H-detected mode via single quantum coherence with proton decoupling in the 13C domain, by using data sets of 2048 × 256 points. The experiments were carried out in the phase-sensitive mode according to the method of States et al.21 In all homonuclear spectra the data matrix was zero-filled in the F1 dimension to give a matrix of 4096 × 2048 points and resolution was enhanced in both dimensions by a cosine-bell function before Fourier transformation.
For the bound ligands, STD NMR experiments were carried out with 672 scans and 32 dummy scans. The pseudo 2D pulse programs stddiff, stddiff.3 and stddiffesgp.3 were used; the broad signals of the proteins were eliminated by using a T1p filter of 50 ms. The protein–ligand ratio varied from 1:50 to 1:100, with a protein concentration of 20 μM in 500 μl, and a saturation of 2 s was used. The protein was saturated employing a train of 40 Gauss pulses with a length of 50 ms. The on-resonance frequency was set at δ = 0.4 or 7 ppm (regions in which no ligand resonances were observed), whereas the off resonance pulse frequency was set at 40 ppm. The original FIDs were zero filled up to 64 k data and processed with the use of an exponential window function in order to increase the S/N ratio. The 2D STD–HSQC were carried out by using a data set of 2048 × 256 points; the same parameters used for STD and HSQC spectra were used.
The STD effect was calculated by (I0 − Isat)/I0, where (I0 − Isat) is the intensity of the signal in the STD NMR spectrum and I0 is the peak intensity of an unsaturated reference spectrum (off-resonance). The highest STD enhancement was set at 100% and the other signals were normalized to this peak. Tr-NOESY experiments were recorded by using a protein–ligand molar ratio 1:20 with mixing times varying between 100 and 600 ms. Data acquisition and processing were performed with TOPSPIN software.
Conformational analysis
The MM3* force field as included in MacroModel 8.0 was used to perform molecular mechanics calculation with a dielectric constant of 80. The dihedral angles were varied incrementally using a grid step of 18°. The molecular dynamics simulations were run by using the MM3* force field; bulk water solvation was simulated by using the MacroModel generalized Born GB/SA continuum solvent model. Simulations were performed at 300 K, the structures were initially subjected to an equilibration time of 300 ps, then a 5000 ps molecular dynamics simulation was performed with a dynamic time-step of 1.5 fs, a bath constant t of 0.2 ps and the SHAKE protocol to the hydrogen bonds. Ensemble average-interproton distances were calculated using the NOEPROM program. Surfaces were calculated with the Surface utility of Macromodel and with Molecular Surface displays of ViewerPro Version 4.2.Docking of the NMR derived mannopentose structure to the PaMan26A and PaMan5A (PDB 3ZM8 and 3ZIZ respectively) was performed manually using the PyMOL Molecular Graphics System (Version 1.Or1, Schrçdinger, LLC).
Conclusions
The comprehension of the complex lignocellulolytic enzymatic machineries of bacteria and fungi has been attracting increasing attention in the area of renewable biofuel production through the saccharification of plant cell walls. The coprophilic fungus Podospora anserina possesses one of the largest sets of enzymes ascribed to the deconstruction of biomass and a candidate for the production of environmentally friendly organic fuel. Therefore, the knowledge at the atomic resolution of plant cell wall polysaccharide recognition by P. anserina glycoside hydrolases resides on the basis of the potential development of novel biocatalysts essential for applications in industrial and biotechnological fields.In the present study, we have focused on two P. anserina glycosidases with affinity for hemicellulosic polysaccharides. In detail, the outcomes of our work have provided in-depth structural features on the molecular recognition of plant cell wall oligomannosides by two P. anserina β-mannanases, PaMan26A and PaMan5A. The bioactive conformations and the epitope mapping of manno-oligosaccharides bound to both enzymes were revealed by means of advanced, ligand-based NMR spectroscopic techniques. Such biophysical methods have been already used to characterize the members of glycoside hydrolase families included in the database of CAZymes,22 providing exclusive information on the receptor–ligand binding mechanisms, difficult to achieve with other methods.
Here, STD NMR and tr-NOE experiments permitted us to draw an accurate picture of mannans binding in solution, shedding light on the conformation and the topography of different oligosaccharides bound to the P. anserina β-mannanases. The comparison between the STD NMR profiles of the two different glycosidases, PaMan26A and PaMan5A, when bound to the same ligand, clearly showed that they displayed a different mode of manno-oligosaccharide recognition. Indeed, although both mannanases accommodated the whole oligosaccharide backbone in the binding pocket, the interaction with the glycoside hydrolase PaMan26A involved the internal residues of mannose to a major extent. On the other side, the PaMan5A preferentially recognized the terminal end of manno-oligosaccharides. Furthermore, NMR data showed that the mode of action of each glycosidase remained the same in the presence of both enzyme substrates and the hydrolysis products.
Thus, an accurate NMR analysis permitted us to demonstrate that, in contrast with other glycoside hydrolases belonging to the GH26 family,16–18PaMan26A exhibited an unusual arrangement of manno-oligosaccharides in the binding pocket, due to the presence of a peculiar negative −4 protein subsite. On the contrary, PaMan5A showed the classical mannan hydrolysis pattern. According to the published GHs’ X-ray structures, the recognition and binding of plant cell wall manno-oligosaccharides involved different enzyme subsites between the two families of glycoside hydrolases GH26 and GH5. Notably, our findings are in agreement with the existing hypothesis,12 and further suggest a different arrangement of the protein binding pocket, with the active site of PaMan26A consisting of up to four negative and two positive enzyme subsites (−4 to +2). On the contrary, PaMan5A exhibited three positive and three negative enzyme subsites (−3 to +3) with a consequent different specificity, mode of action and likely biological role between the two enzymes.
The reported data represent a good starting point to significantly enhance the activity of the fungal endo-mannanases through a molecular engineering approach.22 Therefore, our comparative analysis shed more light on the P. anserina enzymatic machinery and it may help to improve the use of biocatalysts in industrial applications.
Acknowledgements
We thank Mireille Haon for technical support (production and purification of enzymes).Notes and references
- (a) M. A. O'Neill and W. S. York, Plant Cell Wall, 2003, 1–54 Search PubMed; (b) J. Vogel, Curr. Opin. Plant Biol., 2008, 11(3), 301–307 CrossRef CAS PubMed.
- K. S. Mikkonen and M. Tenkanen, Trends Food Sci. Technol., 2012, 28(2), 90–102 CrossRef CAS.
- A. H. Liepman, C. J. Nairn, W. G. T. Willats, I. Sørensen, A. W. Roberts and K. Keegstra, Plant Physiol., 2007, 143, 1881–1893 CrossRef CAS PubMed.
- (a) L. E. Tailford, V. M. Ducros, J. E. Flint, S. M. Roberts, C. Morland, D. L. Zechel, N. Smith, M. E. Bjornvad, T. V. Borchert and K. S. Wilson, et al. , Biochemistry, 2009, 48(29), 7009–7018 CrossRef CAS PubMed; (b) W. H. Van Zyl, S. H. Rose, K. Trollope and J. F. Görgens, Process Biochem., 2010, 45(8), 1203–1213 CrossRef CAS.
- (a) B. Henrissat, Biochem. J., 1991, 280, 309–316 CrossRef CAS PubMed; (b) B. Henrissat and A. Bairoch, Biochem. J. Lett., 1996, 316, 695–696 CrossRef; (c) V. Lombard, H. Golaconda Ramulu, E. Drula, P. M. Coutinho and B. Henrissat, Nucleic Acids Res., 2014, 42, D490–D495 CrossRef CAS PubMed.
- (a) A. Helenius and M. Aebi, Science, 2001, 291, 2364–2369 CrossRef CAS PubMed; (b) H. Kitagaki, K. Ito and H. Shimoi, Eukaryotic Cell, 2004, 3, 1297–1306 CrossRef CAS PubMed; (c) B. Henrissat, I. Callebaut, S. Fabrega, P. Lehn, J. P. Mornon and G. Davies, Proc. Natl. Acad. Sci. U. S. A., 1995, 92, 7090–7094 CrossRef CAS PubMed.
- (a) X. Xu, J. Li, W. Zhang, H. Huang, P. Shi, H. Luo, B. Liu, Y. Zhang, Z. Zhang, Y. Fan and B. Yao, PLoS One, 2015, 10(4), e0124925 Search PubMed; (b) P. Tiwari, B. N. Misra and N. S. Sangwan, BioMed. Res. Int., 2013, 203735 Search PubMed.
- L. Thomas, A. Joseph and L. D. Gottumukkala, Bioresour. Technol., 2014, 158, 343–350 CrossRef CAS PubMed.
- (a) D. Hogg, E. J. Woo, D. N. Bolam, V. A. McKie, H. J. Gilbert and R. W. Pickersgill, J. Biol. Chem., 2001, 276(33), 31186–31192 CrossRef CAS PubMed; (b) L. E. Tailford, V. M. Ducros, J. E. Flint, S. M. Roberts, C. Morland, D. L. Zechel, N. Smith, M. E. Bjørnvad, T. V. Borchert, K. S. Wilson, G. J. Davies and H. J. Gilbert, Biochemistry, 2009, 48, 7009–7018 CrossRef CAS PubMed; (c) H. Tsukagoshi, A. Nakamura, T. Ishida, K. K. Touhara, M. Otagiri, S. Moriya, M. Samejima, K. Igarashi, S. Fushinobu, K. Kitamoto and M. Arioka, J. Biol. Chem., 2014, 289, 10843–10852 CrossRef CAS PubMed; (d) Y. Zhao, Y. Zhang, Y. Cao, J. Qi and L. Mao, et al. , PLoS One, 2011, 6(1), e14608 CAS; (e) M. K. Kim, Y. J. An, J. M. Song, C. S. Jeong, M. H. Kang, K. K. Kwon, Y. H. Lee and S. S. Cha, Proteins, 2014, 82(11), 3217–3223 CrossRef CAS PubMed.
- (a) E. Sabini, H. Schubert, G. Murshudov, K. S. Wilson, M. Siika-Aho and M. Penttilä, Acta Crystallogr., Sect. D: Biol. Crystallogr., 2000, 56, 3–13 CrossRef CAS; (b) R. Bourgault, A. J. Oakley, J. D. Bewley and M. C. Wilce, Protein Sci., 2005, 14, 1233–1241 CrossRef CAS PubMed; (c) A. M. Larsson, L. Anderson, B. Xu, I. G. Muñoz, I. Usón, J. C. Janson, H. Stålbrand and J. Ståhlberg, J. Mol. Biol., 2006, 357, 1500–1510 CrossRef CAS PubMed.
- D. N. Bolam, N. Hughes, R. Virden, J. H. Lakey, G. P. Hazlewood, B. Henrissat and H. J. Gilbert, Biochemistry, 1996, 35, 16195–16204 CrossRef CAS PubMed.
- M. Couturier, A. Roussel, A. Rosengren, P. Leone, H. Stålbrand and J.-G. Berrin, J. Biol. Chem., 2014, 289, 31088–31101 CrossRef PubMed.
- R. Marchetti, A. Molinaro and A. Silipo, NMR as a Tool to Unveil the Molecular Basis of Glycan-mediated Host–Pathogen Interactions, RSC Drug Discovery Series No. 43, Carbohydrates in Drug Design and Discovery, ed. J. Jimenez-Barbero, J. F. Canada and S. Martın-Santamarıa, 2015, pp. 21–37 Search PubMed.
- A. Poveda, J. L. Asensio, J. F. Espinosa, M. Martin-Pastor, J. Cañada and J. Jiménez-Barbero, J. Mol. Graphics Modell., 1997, 15(1), 9–17 CrossRef CAS PubMed.
- G. J. Davies, K. S. Wilson and B. Henrissat, Biochem. J., 1997, 321, 557–559 CrossRef CAS PubMed.
- V. M. Ducros, D. L. Zechel, G. N. Murshudov, H. J. Gilbert, L. Szabó, D. Stoll, S. G. Withers and G. J. Davies, Angew. Chem., Int. Ed. Engl., 2002, 41(15), 2824–2827 CrossRef CAS.
- Y. Xiao-Xue, A. Xiao-Min, G. Lu-Lu and L. Dong-Cai, J. Mol. Biol., 2008, 379, 535–544 CrossRef PubMed.
- J. Le Nours, L. Anderson, D. Stoll, H. Stålbrand and L. Lo Leggio, Biochemistry, 2005, 44, 12700–12708 CrossRef CAS PubMed.
- M. Couturier, M. Haon, P. M. Coutinho, B. Henrissat, L. Lesage-Meessen and J.-G. Berrin, AEM, 2011, 77(1), 237–246 CrossRef CAS PubMed.
- M. Couturier, J. Féliu, S. Bozonnet, A. Roussel and J.-G. Berrin, PLoS One, 2013, 8(11), e79800 Search PubMed.
- D. J. States, R. A. Haberkorn and D. J. Ruben, Magn. Reson., 1882, 48, 286–292 Search PubMed.
- A. Silipo, J. Larsbrink, R. Marchetti, R. Lanzetta, H. Brumer and A. Molinaro, Chemistry, 2012, 18(42), 13395–13404 CrossRef CAS PubMed.
Footnote |
| † Electronic supplementary information (ESI) available. See DOI: 10.1039/c5ob01851j |
| This journal is © The Royal Society of Chemistry 2016 |