 Open Access Article
Creative Commons Attribution 3.0 Unported Licence
Protein clustering in chemically stressed HeLa cells studied by infrared nanospectroscopy
V.
Giliberti
a,
L.
Baldassarre
ab,
A.
Rosa
ac,
V.
de Turris
a,
M.
Ortolani
b,
P.
Calvani
*b and
A.
Nucara
b
aCenter for Life Nano Science@Sapienza, Istituto Italiano di Tecnologia, V.le Regina Elena 291, 00161 Roma, Italy
bDipartimento di Fisica, Università di Roma La Sapienza, P.le Aldo Moro 5, 00185 Roma, Italy. E-mail: paolo.calvani@roma1.infn.it
cDipartimento di Biologia e Biotecnologie Charles Darwin, Universita di Roma La Sapienza, P.le Aldo Moro 5, 00185 Roma, Italy
First published on 8th September 2016
Abstract
Photo-Thermal Induced Resonance (PTIR) nanospectroscopy, tuned towards amide-I absorption, was used to study the distribution of proteic material in 34 different HeLa cells, of which 18 were chemically stressed by oxidative stress with Na3AsO3. The cell nucleus was found to provide a weaker amide-I signal than the surrounding cytoplasm, while the strongest PTIR signal comes from the perinuclear region. AFM topography shows that the cells exposed to oxidative stress undergo a volume reduction with respect to the control cells, through an accumulation of the proteic material around and above the nucleus. This is confirmed by the PTIR maps of the cytoplasm, where the pixels providing a high amide-I signal were identified with a space resolution of ∼300 × 300 nm. By analyzing their distribution with two different statistical procedures we found that the probability to find protein clusters smaller than 0.6 μm in the cytoplasm of stressed HeLa cells is higher by 35% than in the control cells. These results indicate that it is possible to study proteic clustering within single cells by label-free optical nanospectroscopy.
Introduction
Protein aggregation in cell cytoplasm is a crucial biological phenomenon. Under physiological conditions, regulated protein aggregation is a protective mechanism that the cells use to face stress conditions. On the other hand, the formation of pathological inclusions containing misfolded proteins is involved in the development of neurodegenerative diseases.1 In this context, a large number of in vitro experiments were performed to study the dynamics of aggregate formation,2 both in model proteins and in cultured cells and tissues. Protein foci within cell cytoplasm, sized between 0.1 to 2 μm, were observed and studied under different physico-chemical conditions as, for example, induced oxidative, osmotic or thermal stress.3,4 Typically, protein foci could appear either as stress granules (SG) or as Processing Bodies (PB), which differ in terms of composition, structure and functionality.2 However, both of them involve mRNA binding proteins which, when present in a mutated form, are often indicated as the possible cause of SG transformation into pathological inclusions.5 These studies are often based on the combined use of immunofluorescence and confocal imaging techniques, which can distinguish SG on a spatial resolution of a few hundreds of nanometers,6 a limit imposed by the diffraction of light diffused from the dyes. In the last decade, however, alternative spectroscopy techniques have been developed which can identify the fingerprints of different chemical species within single cells, but despite having a comparable or better spatial resolution, are label-free.Among such techniques, one of the most promising for biological applications is Photo-Thermal Induced Resonance (PTIR) spectroscopy, also called AFM-IR nanospectroscopy because it couples to Atomic Force Microscopy (AFM) an InfraRed (IR) intense and pulsed source, like a Free Electron Laser (FEL), an Optical Parametric Oscillator (OPO) or a Quantum Cascade Laser (QCL). The AFM tip detects the local expansion of the sample when its molecules absorb the radiation to excite their vibrational modes, which occur at frequencies specific to each molecular bond.7–11 PTIR can thus identify, with a spatial resolution which in biological systems is reported to be on the order of 102 nanometers,12–16 a number of chemical species ranging from nucleic acids to proteins and lipids. The improvement in the sensitivity provided by PTIR with respect to conventional IR microspectroscopy also allows one to study very small quantities of analytes. Moreover, PTIR is characterized by negligible heating and low perturbation of the sample, high spectral resolution, and no need to use fluorescent labels.
PTIR studies of extracellular pathological protein aggregation have been performed on amyloid fibrils.17 However, up to now, only a few PTIR studies have been performed on intracellular material, including clustering phenomena.13,15 Actually, the mechanical and chemical unevenness of the cell compartments imposes severe restrictions on the application of PTIR methods in the life sciences requiring accurate methods for the analysis of the results. In the present work we have collected 34 AFM and PTIR maps of fixed HeLa cells, of which 18 were chemically stressed by oxidation with Na3AsO3. Indeed, oxidative stress has been found to induce protein clustering in those specimens, not necessarily generating insoluble aggregates of misfolded proteins which can be detected by infrared spectroscopy through their spectral fingerprints.
In this paper we approach the protein clustering issue within cells by a nano-IR technique. We obtain correlated information from the AFM topography and the PTIR maps. By analyzing the data with two different statistical procedures we obtain consistent indications of an increase of protein clustering in the stressed cells, with respect to the control ones, by about 35%. These results are encouraging from the perspective of future spectrally resolved infrared imaging directly on mutated cells that may lead to the identification of pathological inclusions in single cells.
Materials and methods
Cell preparation
HeLa cells were trypsinized, washed and then transferred onto a square portion of a double-side polished Si wafer. Si was chosen as a substrate as it is transparent in our measuring range and flat enough to perform AFM measurements. Control cells (CC) were grown for 24 h on Si in DMEM supplemented with 10% FBS, 1× L-glutamine and penicillin/streptomycin (all from Sigma-Aldrich). The next day, the cells were fixed in a 4% paraformaldehyde solution, washed twice with PBS and rinsed first in a saline solution of 80 mM KCl, 20 mM MgCl2 and 10 mM Tris HCl (pH = 7.2), then in a second buffer solution (40 mM KCl, 20 mM MgCl2 and 10 mM Tris HCl) and eventually with Milli-Q water. Treated HeLa cells (Sodium-Arsenite Exposed Cells, SAEC) were prepared with the same procedure, and exposed to Na3AsO3, 0.5 mM for one hour in the growing medium, before fixation. Oxidative stress by sodium arsenite induces the formation of protein clusters in the cytoplasm, which would be dissolved upon stress release.4 Both CC and SAEC samples were finally dried under a gentle flow of dry air for two hours and measured.Fourier-transform conventional microscopy
Preliminary spectra of single HeLa cells were collected by using a Hyperion-2000 infrared microscope equipped with a nitrogen cooled MCT detector and coupled to a Bruker IFS 66 V Michelson interferometer, to evaluate the contributions to the amide-I spectral region – that afterwards was used to map the protein distribution – from cellular DNA and from the bending mode of residual intracellular water. The absorbance spectra were collected with the radiation path purged with pure nitrogen, by averaging 1024 interferograms on 5 HeLa cells. The spectral and lateral resolutions were 4 cm−1 and 10 μm (at 1600 cm−1), respectively. One of those spectra is shown in Fig. 1 by a solid line and is similar to those reported in ref. 13 and 18. It shows, in order of increasing frequency, a triplet of bands centered at 1080, 1220 and 1440 cm−1, the amide-II and amide-I narrow peaks, the lines of C–H stretching and finally the broad and intense bands of the O–H and N–H stretching. The red dashed line shows for comparison a spectrum of pure DNA extracted from ref. 19, after normalizing its intensity on the PO2− peak at 1080 cm−1 in the HeLa spectrum. As one can see, its contributes to the amide-I peak by less than 10% of its total intensity. The inset reports the absorption spectrum of powder of Bovine Serum Albumin (BSA) protein from Sigma-Aldrich (purity 98%), diluted in KBr in the ratio 5% to 95% and kiln-dried at 180 °C for 120 hours. Therein one sees that the ratios between the intensities of the amide-I and the OH–NH stretching bands are similar in the two spectra. After considering that in liquid water the OH-stretching absorption is stronger than that of OH bending by a factor of 15,20,21 one can conclude that also the water contribution in the region of the amide I in the HeLa spectrum is negligible. Therefore the absorption at 1660 cm−1 (marked in Fig. 1 by a dotted vertical line) is dominated by the amide-I peak and can be used to monitor the protein distribution within the cell.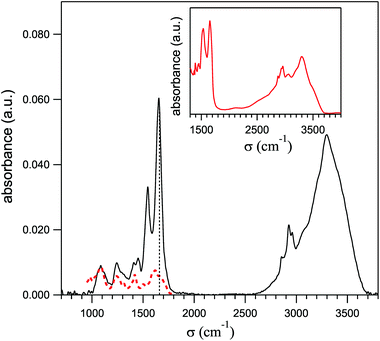 | ||
| Fig. 1 Average of the mid-infrared absorption spectra taken with a conventional IR microscope on five single HeLa cells (solid line). The dashed line is a spectrum of pure DNA from ref. 19, normalized to the DNA peak here observed at 1080 cm−1. The absorbance in the inset was taken with the diffuse reflectance technique on anhydrous BSA protein powder. The dashed vertical line indicates the frequency where the PTIR maps of Fig. 4-c and d were taken (1660 cm−1). | ||
AFM-IR nanospectroscopy
The infrared measurements of the HeLa cells on a sub-micron scale were performed by using a NanoIR2 setup from Anasys Instruments Inc. coupled to a single-chip, external-cavity Quantum Cascade Laser (QCL) from Daylight Solutions, that could be tuned between 1575 and 1725 cm−1 with steps of 1 cm−1. The NanoIR2 operation principle is based on the detection of the AFM cantilever oscillation induced by the sample expansion when absorbing the QCL radiation.7,10,11 Simultaneous Atomic Force Microscopy (AFM) and infrared images were recorded with gold-coated tips in contact mode.16 Cantilevers having an elastic constant k = 0.07–0.1 N m−1 and a tip radius of about 30 nm were used. The AFM images of HeLa cells were taken at 0.2 Hz with 300 × 300 detection points. The scan step was then varying between 190 and 350 nm from cell to cell. The repetition rate of the QCL laser in the pulse mode was finely tuned to match the second bending mode B2 of the cantilever, whose resonance frequency was usually slightly below 200 kHz once in contact. The AFM-IR images were measured with the radiation field directed along the tip axis, at a fixed radiation frequency σ0 = 1660 cm−1 (λ0 = 6 μm). This value is close to the maximum of the amide-I absorption peak, but nearly free from water vapor absorption. This was further reduced by purging with pure nitrogen the radiation path from the QCL to the tip within the NanoIR2 system. This operation reduced the humidity in the optical setup from 70% to about 10%. The preliminary analysis of the AFM-IR and AFM images was performed with the Anasys Instruments software.From the amide-I PTIR signal to the protein distribution
In this section we discuss the basic issue of the relationship between the amide-I signal S(x, y, λ0) detected during an x, y PTIR scan of the cell, and the protein distribution ρ(x, y) projected on the x, y plane, which is the quantity of interest in the present investigation. Even if the maps were collected in the whole HeLa cells (see Fig. 2), the data analysis in the next section will be restricted to the cytoplasm, whose stiffness, thermal conductivity and specific heat will be assumed to be approximately homogeneous. We further assume that the amide-I vibration has the same oscillator strength when averaged over the volume sensed for each lateral step. Therefore, one can write| ρ(x, y) ∝ A(x, y, λ0)/d(x, y) | (1) |
According to the detailed analysis by Dazzi et al.8 of the PTIR signal S(x, y, λ0), this is given by
| S(x, y, λ0) = Hmech·HAFM·Hopt·Hth·A(x, y, λ0). | (2) |
The mechanical factor Hmech measures the vertical expansion of the absorbing sample; it is proportional, through the expansion coefficient, to d(x, y) and to the temperature increase ΔT, which in turn is inversely proportional to d(x, y) and to the thermal conductivity κ. Therefore, it does not depend on x, y assuming that κ is constant throughout the cytoplasm. The instrumental factor HAFM describes the response of the cantilever to Hmech. As the cytoplasm on the flat Si surface is reasonably homogeneous in terms of stiffness and elasticity, HAFM could change from site to site only due to variations in the tip-sample contact. However, NanoIR2 automatically tunes in real time the QCL repetition rate onto the resonant frequency of the cantilever σc, thus compensating for any variation in the efficiency of that contact. The optical term Hopt is proportional to the square modulus of the laser field through a simple function of the refractive index,8 a macroscopic quantity which can also be assumed to be constant with respect to x, y. Finally, the thermal factor Hth takes into account the thermal relaxation of the sample since the beginning of the laser pulse and, in the case of pulses longer than the thermal relaxation time τ of the cytoplasm, is proportional to 4πa2/κ, where a is the radius of the sample isothermal area providing the signal. This is neither the large area of the QCL focus on the sample, an ellipse of about 20 μm × 60 μm, nor in the present case of a thick sample on a dielectric substrate – the sample area where the radiation field enhancement below the tip is effective. Indeed, we have found negligible variations in the PTIR maps when rotating the radiation field polarization in the direction orthogonal to the tip axis. Therefore, the PTIR signal does not come from the small volume below the tip where the field enhancement is effective but from the whole thickness below an area of dimension ∼a2. This area in turn determines the lateral resolution Δ of the AFM-IR images. From the analysis of our PTIR data reported in the next section, we obtain Δ ≈ 300 nm, or λ/20, consistently with previous experiments.8,22 Based on these results, Δ is not expected to change appreciably throughout each cell cytoplasm and we can deduce that also Hth is basically independent of x, y. In conclusion, we can reasonably assume
| ρ(x, y) ∝ S(x, y, λ)/d(x, y). | (3) |
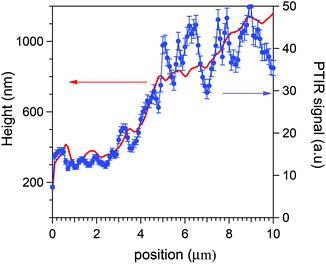
Eqn (3) is experimentally supported by tests that we have performed either on a wedge, 20 μm long and 2000 nm high, made of the SU8 polymer of constant ρ(x), or directly on the HeLa cells. In the former case its PTIR scans along x provided, within small errors, S(x) ∝ d(x) from 200 to at least 1800 nm, thus confirming and extending previous linearity determinations with a different optical scheme.23 An example of a direct linearity test is instead reported in Fig. 3. Therein it is shown that the average AFM-IR signal recorded during a cytoplasm scan follows the thickness profile simultaneously measured by the AFM tip. The local fluctuations are those statistically analysed in the present work. Eqn (3) allows us to convert the maps of the PTIR signal into maps of proteic material distribution, if we limit ourselves to the cytoplasm of the HeLa cells.
Experimental results
AFM and PTIR maps of HeLa cells
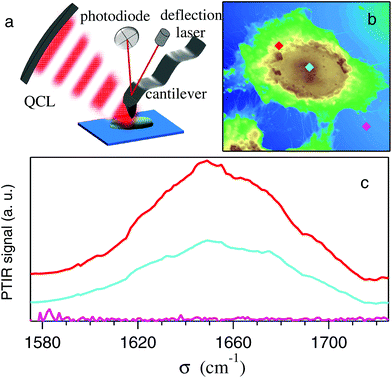
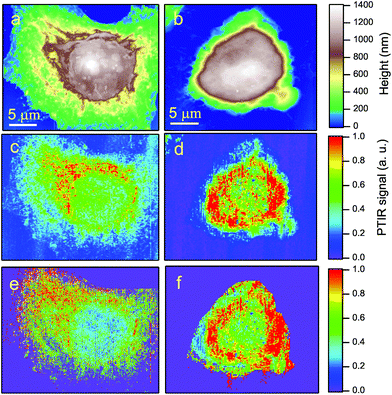
Fig. 2-b shows the AFM map of a control HeLa cell. The diamonds show the points where the AFM tip was located to collect the PTIR spectra, in the region of the amide-I band, displayed with the corresponding colors in Fig. 2-c. Zero absorption is detected outside the cell, while the pronounced peaks recorded within the cell can be assigned to the amide-I band based on the microscopy data discussed above. One may notice that the strongest absorption does not come from the nucleus, where d(x, y) is maximum, but from the perinuclear region of the cytoplasm.Two typical examples of AFM maps of single HeLa cells, as obtained by scans of 300 × 300 data points, are shown in Fig. 4-a (CC) and 4-b (SAEC). Both images demonstrate excellent adherence of the cells to the Si substrate, with negligible imaging artifacts due to the interaction between the tip and those soft samples in contact mode. In correspondence with the cell nucleus (brown zone) the cell height reaches 1.2–1.4 μm, while the cytoplasmic region (yellow and green areas) is much thinner. The topography of the SAEC looks different from that of the CC. It is smaller and exhibits a marked contraction of the cytoplasm toward the nucleus, which creates a nearly uniformly thick area at the center of the cell.
The PTIR maps of the same two cells, collected with the laser tuned towards the amide-I band at 1660 cm−1, are reported in Fig. 4-c (CC) and 4-d (SAEC). If the protein distribution within the cell was basically homogeneous, one should expect infrared images similar to the AFM ones in Fig. 4-a and b, as the PTIR signal8 is basically proportional to the sample thickness below the tip. In contrast, in accordance with Fig. 2-c, the PTIR signal is peaked in a thin cytoplasmic layer around the cell nucleus, of which it provides a clear contour. (The asymmetry in the image is due to one side of the cell being better illuminated by the laser beam, which comes from the top of the field of view in the figure.) In nearly all the 34 images we took, the amide-I signal from the nucleus is instead no more intense than that from the thinner rest of the cytoplasm. This is consistent both with the PTIR maps reported in ref. 15 on colon adenocarcinoma cells and with the Raman maps taken, in the C–H stretching region where Raman is most sensitive, both on eye lens epithelial cells (LEC)24 and on HeLa cells.25
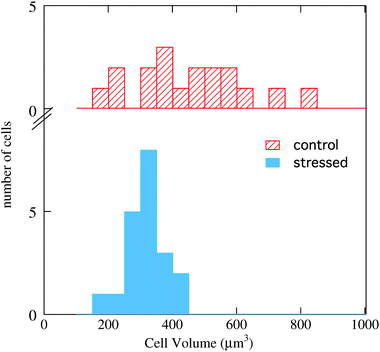
By comparing the AFM maps in Fig. 4-a with that in 4-b one sees that upon oxidative stress the cell becomes smaller and the thicker (brown/white) area becomes larger. This behavior is common to all images collected, as shown in the histograms of Fig. 5, where the cell volume determined from the AFM topography on the 16 control cells is compared with that of the 18 stressed ones. The average volumes are 450 μm3 and 320 μm3, respectively, and the standard deviations 170 and 60 μm3, respectively. The impressive effect of oxidative stress, pointed out in Fig. 5, is due to an accumulation of the cytoplasmic material around the cell nucleus, as shown by comparing Fig. 4-c and d. These images also indicate that, in SAEC, some cytoplasmic materials are also displaced above the cell nucleus. The further step consisted in dividing the PTIR maps by the corresponding AFM maps, and thus normalizing the infrared signal to the cell height at any pixel. We thus obtained maps like those shown in Fig. 4-e and f for the two cells of Fig. 4-c and d, respectively.
Statistical analysis of the infrared maps
The analysis of HeLa infrared images was aimed at evaluating the correlation between the coordinates of the pixels where the protein signal was detected. Therefore, the relative position of those pixels which are statistically meaningful in the normalized maps (like those of Fig. 4-e and f) was assumed as the independent variable. The pixels selected for the analysis were those belonging to the most illuminated cell areas which could not be affected by measuring artifacts. These two conditions led us to fix an intensity threshold I0 for the PTIR normalized signal, and to assign bit 1 (bit 0) to the pixels whose normalized signal I(x, y) was stronger (weaker) than an intensity threshold I0. The threshold was placed for each cell at one standard deviation from the peak of the intensity histogram in the inset of Fig. 6-b. This conservative criterion leaves anyway thousands of meaningful bits available for the analysis (colored dots), as shown in Fig. 6-a for the cell in Fig. 4-e.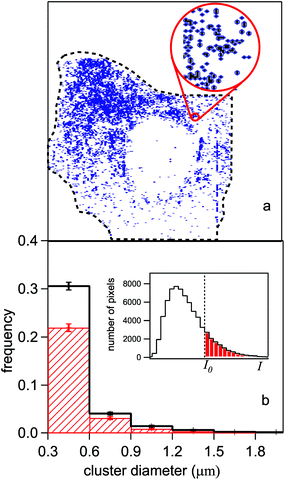 | ||
| Fig. 6 (a) Digitized infrared map of the control HeLa cell of Fig. 4-e. The colored (white) pixels are those which provided a signal of intensity I (normalized to the height measured in that point by the AFM) stronger (weaker) than a given threshold I0. I0 is fixed at one standard deviation from the peak of the statistical distribution of the I values shown in the inset of panel (b). (b) Histogram of the average dimension of a cluster formed by adjacent pixels, in the control cells (red dashed area) and in the SAEC ones (black line). The step of the horizontal scale is fixed by the lateral resolution of the experiment (see text). The error bars are obtained from the square root of the number of cells. | ||
In order to extract from the digitized maps quantitative information on the protein clustering, we have followed two different statistical approaches. The first one was based on a “particle analysis”, the second one on the evaluation of the density pair correlation function. In the following we report the main results obtained with both procedures.
Particle analysis
The particle analysis26 divides the bit-1 pixels into clusters (“particles”) which may contain either isolated pixels, or two or more connected pixels (i.e., touching each other within the lateral resolution of the experiment). Each resulting particle thus acquires an area which is fit by an ellipse, whose axes are assumed as statistical variables. Afterwards, the axes are further reduced to a single variable, the diameter D of the circle having the same area as the ellipse. The statistical occurrence of the D values, averaged over the whole sample of control cells, is shown by the red-dashed histogram in Fig. 6-b. Therein, the corresponding histogram for the SAEC cells is reported in black. The binning size corresponds to the experimentally determined, effective lateral resolution Δ ∼ 300 nm (see below). Only D values greater than Δ are reported in the figure. The normalized D distributions of Fig. 6-b show that the probability of finding protein clusters sized between 0.3 and 0.6 μm increases by about 30% in the cytoplasm of the cells exposed to Na3AsO3 with respect to the control ones. The average size of the connected bit-1 pixels does not exceed 1.5 μm in diameter and its statistical occurrence is the same for both cell lines within errors.Pair correlation function analysis
The second approach aimed at extracting more quantitative information from the HeLa infrared maps comes from classical statistical mechanics, as originally applied to soft-matter systems. It consists in the evaluation of the radial Pair Correlation Function (PCF), often named g(r),27,28 between pixels in the PTIR map of Fig. 6-a. The g(r) measures the ratio between the probability P(r) to find two bit-1 pixels at distance r in the map, and the corresponding probability Pu(r) in a uniform distribution of pixels, i.e., | (4) |
For each CC and SAEC map we have calculated the P(r) and Pu(r) distributions and computed the corresponding g(r). The former two functions are plotted in Fig. 7-a for the map in Fig. 6-a. For comparison, the linear behavior expected for an unbound, uniform distribution of pixels is also shown (dotted line). The deviation of Pu(r) from the linear behavior is an artifact due to the cell boundary and becomes appreciable for r 5 μm. Therefore, this value has been assumed as the upper limit for a meaningful PCF in the present case.
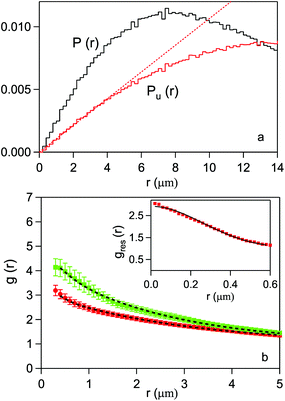 | ||
| Fig. 7 (a) Probability distribution of the relative distance between pixels for the digitized image map in Fig. 6-a (black line) and for a uniform distribution of the same number of bits 1 in the cell area (red line). The red dashed line refers to a uniform distribution in an infinite plane. (b) Pair correlation function for the HeLa cells, as averaged over the 16 CC (red dots) and the 18 SAEC (green diamonds). The error bars are given by the standard deviation on the expected value for each statistical distribution. The lines are fits to data (see text). In the inset, the PCF of Escherichia coli bacteria is shown. The line is a fit with a 2D Gaussian function. | ||
The experimental g(r) from eqn (4) can be compared with the convolution resulting from a finite lateral resolution27Δ:
| g(r) = [δ(r)/ρ + greal(r > 0)]⊗gres(r). | (5) |
Here the terms within square brackets, which describe the real correlation function of the protein distribution within the cell, are convoluted with the PCF gres(r) of pixels whose relative distance is r < Δ. ρ is the average density of pixels, and gres(r) coincides with g(r) in the special case of uncorrelated pixels (greal = 1). Assuming for this function a 2D Gaussian model, gres(r) = exp(−r2/4Δ2)/(4πΔ2), one can experimentally obtain Δ. A sample which well approximates greal = 1 is a culture of Escherichia coli bacteria, where uniform protein distribution has been observed.16 The PCF of the E. coli normalized maps, reported by squares in the inset of Fig. 7-b, where fit by the 2D Gaussian function (solid line). We obtained Δ = 0.3 μm. As the present HeLa maps have been taken under the same experimental conditions as those in ref. 16, the scan step here used, which varies between 0.2 and 0.35 μm, in practice coincides with the effective lateral resolution Δ. This justifies a posteriori the step choice and makes the correction in eqn (5) redundant in the present case.
The PCF's averaged over the 16 CC cells and the 18 stressed cells are plotted in Fig. 7-b by dots and squares, respectively. Both curves have been fit with the exponential function g(r) = 1 + Aexp{−r/ξ}. One obtains ξ ≃ 2.9 μm, A = 2.1 and ξ ≃ 2.5 μm, A = 3.3, respectively. Both the decrease in the correlation length and the increase of g(r) at short distances indicate a tendency to clustering of the protein distribution within the stressed cells. Further evidence can be extracted from the average number of pixels within a cluster of radius r
 | (6) |
By assuming the same average density for the CC and SAEC groups, one can estimate the relative increase of the pixel's local density in the SAEC cells with respect to the CC ones, namely,
| η(r) = [NSAEC(r) − NCC(r)]/NCC(r) | (7) |
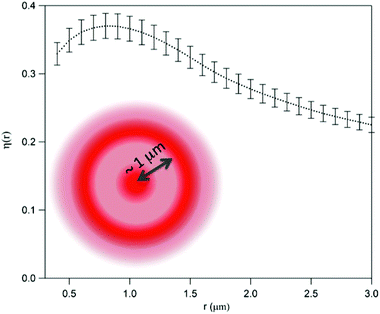 | ||
| Fig. 8 Relative increase of the pixel local density in stressed cells with respect to control cells, as obtained from eqn (6) and (7). The error bar is the standard deviation on the expected value. Oxidative stress is related to the increased probability of finding a second pixel beyond the threshold within a radius ∼1 μm, as pictorially shown in the figure. | ||
Both the particle analysis and the PCF approach reveal a stronger tendency of the SAEC group, with respect to the control cells, to protein clustering within the cell cytoplasm. On the one hand, the particle analysis allows one to visualize the position of protein clusters, on a scale (300–600 nm) whose lower limit is fixed by the effective lateral resolution. On the other hand, the PCF analysis of the digitized maps, which returns the average correlation between pixels, indicates an increase of the local density at short distances in the SAEC sample. The combined results of the two procedures are consistent with the scenario of protein foci within the cell cytoplasm of in vitro cultures, even if neither the identity nor the actual composition of the clusters enlightened in the present experiment can be determined at this stage, in the absence of a detailed spectral analysis.
Conclusion
In conclusion, we have presented an application of Photo Thermal Induced Resonance (PTIR) nanospectroscopy technique to a study of 34 human (HeLa) cells, of which 16 were unstressed and 18 were oxidative stressed by exposure to sodium arsenite. The PTIR maps taken at the amide-I absorption (detected at 1660 cm−1) highlight the contour of the cell nucleus thanks to a strong signal which arises from the perinuclear cytoplasm, while in most maps the signal from the nucleus is comparable to that from the much thinner peripheral cytoplasm.In comparison with those of the control cells, the AFM maps of the chemically stressed ones show a shrinking of the cytoplasm around and above the nucleus. In turn, the infrared maps show an increase of the proteic signal from the cytoplasm area close to the nucleus. In order to obtain quantitative results, we have analysed the distribution of pixels from the cytoplasm, which provide a protein signal beyond a given threshold, with two different statistical procedures: the particle analysis and the pair correlation function method. Both consistently indicate a measurable tendency of proteins to reduce their reciprocal distances within the stressed cells. The present experiment has demonstrated the capability of the PTIR technique to identify quantitatively the clustering of proteins within the cells on a sub-micrometric scale. Such results have been obtained by using a QCL single-chip laser, tuned towards protein amide-I absorption. The use of the broader band, multi-chip QCL lasers that have recently become available will allow one to extend the PTIR analysis of the cell structure to DNA, lipids, and different protein bands. This will considerably improve the capability of PTIR to monitor the cell response upon different stress sources.
Acknowledgements
Part of this research has been financed by the grant Medie Attrezzature 2015 of the Sapienza University of Rome. L.B. and M.O. acknowledge support from the Italian Ministry of Research through the S.I.R. grant N.RBSI14IT0D.References
- B. Wolozin, Mol. Neurodegener., 2012, 7, 1 CrossRef PubMed.
- P. Anderson and N. Kadersha, Curr. Biol., 2009, 19, R397 CrossRef CAS PubMed.
- S. Souquere, S. Mollet, M. Kress, F. Dautry, G. Pierron and D. Weil, J. Cell Sci., 2009, 122, 3619 CrossRef CAS PubMed.
- A. Aulas and C. Van de Velde, Front. Cell. Neurosci., 2015, 9, 423 Search PubMed.
- J. Lenzi, R. De Santis, V. de Turris, M. Morlando, P. Laneve, A. Calvo, V. Callendo, A. Chi, A. Rosa and I. Bozzoni, Dis. Models & Mech., 2015, 8, 755 CAS.
- J.-M. Fritschy and W. Härtig, Immunofluorescence, in Encyclopedia of Life Sciences, J. Wiley & Sons, 2001 Search PubMed.
- J. Houel, E. Homeyer, S. Sauvage, P. Boucaud, A. Dazzi, R. Prazeres and J.-M. Ortga, Opt. Express, 2009, 17, 10887 CrossRef CAS PubMed.
- A. Dazzi, F. Gotlin and E. M. Carminati, J. Appl. Phys., 2010, 107, 124519 CrossRef.
- A. M. Katzenmeyer, V. Aksyuk and A. Centrone, Anal. Chem., 2013, 85, 1972 CrossRef CAS PubMed.
- F. Lu and M. A. Belkin, Opt. Express, 2011, 19, 19942 CrossRef CAS PubMed.
- F. Lu, M. Jin and M. A. Belkin, Nat. Photonics, 2014, 8, 307 CrossRef CAS.
- A. J. Kulik, F. S. Ruggeri, W. I. Gruszecki and G. Dietler, Microscopy and Analysis, 2014, 28, 11 Search PubMed.
- C. Policar, J. B. Waern, M. A. Plamont, S. Cléde, C. Mayet, R. Prazeres, J.-M. Ortega, A. Vessires and A. Dazzi, Angew. Chem., Int. Ed., 2011, 50, 860 CrossRef CAS PubMed.
- E. Kennedy, F. Yarrow and J. H. Rice, J. Biophotonics, 2011, 4, 588 CAS.
- E. Kennedy, R. Al-Majmaie, M. Al-Rubeai, D. Zerulla and J. H. Rice, J. Biophotonics, 2015, 8, 133 CrossRef CAS PubMed.
- L. Baldassarre, V. Giliberti, A. Rosa, M. Ortolani, A. Bonamore, P. Baiocco, K. Kjoller, P. Calvani and A. Nucara, Nanotechnol., 2016, 27, 075101 CrossRef CAS PubMed.
- F. S. Ruggeri, G. Longo, S. Faggiano, E. Lipiec, A. Pastore and G. Dietler, Nat. Commun., 2015, 6, 7831 CrossRef CAS PubMed.
- M. Romeo, C. Mattäus, M. Miljkovic and M. Diem, Biopolymers, 2004, 74, 168 CrossRef CAS PubMed.
- M. L. S. Mello and B. C. Vidal, PLoS One, 2012, 7, e43169 CAS.
- J. E. Bertie, M. K. Ahmed and H. H. Eysel, J. Phys. Chem., 1989, 93, 2210 CrossRef CAS.
- J.-B. Brubach, A. Mermet, A. Filabozzi, A. Gerschel, D. Lairez, M. P. Krafft and P. Roy, J. Phys. Chem. B, 2001, 105, 430 CrossRef CAS.
- P. M. Donaldson, C. S. Kelley, M. D. Frogley, J. Filik, K. Wehbe and G. Cinque, Opt. Express, 2016, 24, 001852 CrossRef PubMed.
- B. Lahiri, G. Holland and A. Centrone, Small, 2013, 9, 439 CrossRef CAS PubMed.
- N. Uzunbajakava, A. Lenferink, Y. Kraan, B. Willekens, G. Vrensen, J. Greve and C. Otto, Biopolymers, 2002, 72, 1 CrossRef PubMed.
- M. Hedegaard, C. Matthaüs, S. Hassing, C. Krafft, M. Diem and J. Popp, Theor. Chem. Acc., 2011, 130, 1249 CrossRef CAS.
- M. Sezgin and B. Sankur, J. Electron. Imaging, 2004, 13, 146 CrossRef.
- S. L. Veatch, B. B. Machta, S. A. Shelby, E. N. Chiang, D. A. Holowka and B. A. Baird, PLoS One, 2012, 7, e31457 CAS.
- P. Sengupta, T. Jovanovic-Talisman, D. Skoko, M. Renz, S. L. Veatch and J. Lippincott-Schwarz, Nat. Methods, 2012, 8, 969 CrossRef PubMed.
| This journal is © The Royal Society of Chemistry 2016 |

