 Open Access Article
Creative Commons Attribution 3.0 Unported Licence
Formation of 3D graphene foams on soft templated metal monoliths†
Michael K.
Tynan‡
,
David W.
Johnson‡
,
Ben P.
Dobson
and
Karl S.
Coleman
*
Department of Chemistry, Durham University, South Road, Durham, DH1 3LE, UK. E-mail: k.s.coleman@durham.ac.uk
First published on 13th June 2016
Abstract
Graphene foams are leading contenders as frameworks for polymer thermosets, filtration/pollution control and for use as an electrode material in energy storage devices, taking advantage of graphene's high electrical conductivity and the porous structure of the foam. Here we demonstrate a simple synthesis of a macroporous 3D graphene material templated from a dextran/metal salt gel, where the metal was cobalt, nickel, copper, and iron. The gel was annealed to form a metal oxide foam prior to a methane chemical vapour deposition (CVD). Cobalt metal gels were shown to afford the highest quality material as determined by electron microscopy (SEM and TEM) and Raman spectroscopy.
Introduction
Graphene, a single layer of graphite, has attracted much interest since its discovery in 2004,1 due to a host of exceptional properties. These properties include a high mechanical strength,2 high electrical conductivity,1 high thermal conductivity,3 and large surface area.4 Potential graphene applications include filtration,5 hydrogen storage,6 catalysis supports,7 solar cells,8 batteries,9 composites,10 thermal management devices,11 and supercapacitors.12–14 Macroporous graphenes, more specifically monoliths with pores sizes >1 μm, have been developed towards three principal application areas namely: electrodes,15,16 conducting frameworks for polymer thermosets,17,18 and filtration/pollution control.5,19 These applications all have a shared requirement for easily accessible pores of the type inherent to macroporous structures. In applications where electrical conductivity is needed, such as electrode materials, the easily accessible pores and continuous electrically conducting structure of macroporous graphene can improve electron transport and electrolyte diffusion compared to discontinuous powder electrodes.15Macroporous graphene is most commonly produced from either the self-assembly of graphene oxide,20–22 or from graphene growth on a ‘hard’ porous continuous metal template.23,24 The popularity of graphene oxide centers on the cheap and scalable production methods. However, the oxidation and exfoliating processes introduce defects into the graphene structure disrupting the delocalized sp2 network, adversely affecting its physical and electrical properties and decreasing its chemical stability.25,26 By contrast, the ‘hard’ template approach typically involves chemical vapor deposition (CVD) onto commercially available nickel foams with an average pore size in excess of 50 μm.12,17,27,28 The template CVD graphene produced typically has much higher electrical conductivity than that of graphene derived from graphite oxide however, yields are much lower than those found in graphene oxide self-assembly routes.29 An alternative route to graphene foams via the sintering of metal oxide particles followed by CVD has been reported.30,31 The materials produced, although low density and high surface area, have relatively low levels of overall graphitisation. Similarly, the sintering of metal salt crystals can also be used to produce high density graphene foams.32 Several related routes also exist involving the doping of aerogels,33 polymer particles,34 or xerogels,25 with catalytic metal particles prior to carbonization.
The formation of porous metal frameworks by templating has long been an area of study for those working in the fields of catalysis, filtration and electrochemistry.35,36 Such materials can be produced by a variety of routes involving either soft or hard templates.37,38 The use of so-called soft templates was first developed by Mann et al.36 who demonstrated that dextran hydrogels could be used as sacrificial templates for production of copper oxide and silver and gold metal monoliths.35 The principle advantages of soft-templating include the facile, scalable and benign nature of the chemistry used. In addition, soft-templating can offer a degree of control over the macrostructure properties including mechanical strength and pore size.36,39,40
Here we demonstrate for the first time the application of soft-templated metal frameworks for the CVD growth of macroporous graphene. The graphene material produced preserved the original template's porous structure following removal of the metal by a simple acid wash. Copper, nickel, iron and cobalt templates were investigated giving a copper graphene foam (CuGF), nickel graphene foam (NiGF), iron graphene foam (FeGF) and cobalt graphene foam (CoGF). Unlike graphene growth on hard metal foams, the soft-templated metal framework procedure described herein requires no cleaning of the metal substrate prior to use, works at atmospheric pressure and has a low sensitivity to changes in conditions.
Experimental
Materials
Cobalt(II) nitrate hexahydrate (98%), nickel(II) nitrate hexahydrate (98%), copper(II) sulphate pentahydrate (99%), iron(III) chloride (99%), Triton X-45, and dextran (1500–2800 kDa) were purchased from Sigma Aldrich and used as received. Argon (99.998%), hydrogen (99.995%) and methane (99.995%) were purchased from BOC.Synthesis of metal salt gel
Gels were prepared according to a procedure outlined by Khan and Mann.36 Briefly, metal salt (10 g) was dissolved into high purity water (15 g) to which Triton X-45 (10 g) was added. In a separate vessel dextran (10 g, 1500–2800 kDa) was mixed with high purity water (10 g) and then placed on a sample roller for 1 h. The nascent dextran gel and metal salt solutions were combined and stirred (30 min, 60 °C). The gel was then allowed to age for 4 days prior to use.36Synthesis of metal oxide foam
Metal salt/dextran gel was placed in an alumina boat and placed inside a quartz furnace tube. The system was heated inside a Carbolite tube furnace to 600 °C at 5 °C min−1 and held there for two hours.36Synthesis of metal foam
Metal oxide foam was placed in an alumina boat inside a quartz worktube (I.D. = 32 mm, length = 750 mm) inside a Carbolite tube furnace. The system was then purged with argon (48 l h−1) for 30 minutes. Hydrogen (8 sccm) was then added to the flow and the furnace ramped up to 1000 °C at 20 °C min−1 and held at temperature for two hours. The system was then allowed to cool under the flow of argon and hydrogen.CVD on metal oxide foam
Metal oxide foam was placed in an alumina boat inside a quartz worktube (I.D. = 32 mm, length = 750 mm) inside a Carbolite tube furnace. The system was then purged with argon (48 l h−1) for 30 minutes. Hydrogen (8 sccm) was then added to the flow and the furnace ramped up to 1000 °C at 20 °C min−1 and held at this temperature for one hour before methane (5 sccm) was introduced to the flow for 10 minutes. The methane was then stopped and the furnace was held at temperature for another 50 minutes. The system was then allowed to cool under a flow of argon and hydrogen. The metal/graphene foam was then washed in 6 M hydrochloric acid for 19 hours to remove the metal, filtered and dried in a vacuum oven at 60 °C under a reduced pressure (10−1 Pa).Characterization
Raman spectra were collected on a Horiba LabRam Evolution using a 532 nm laser and a × 50 long working distance objective lens. The instrument was calibrated against a silicon reference. Spectra were background corrected and normalized to the G band using the Horiba Labspec 6 software. Thermogravimetric analysis (TGA) was carried out using a Perkin Elmer Pyris I. Samples were exposed to air and the temperature increased from ambient to 1000 °C at 10 °C min−1. For scanning electron microscopy (SEM), materials were mounted on a metal stub with silver paint. SEM images were collected using a Hitachi SU-70 FEG SEM. Energy dispersive X-ray spectroscopy (EDX) was taken inside the SU70 SEM and collected using an Oxford Instruments EDX system (INCA x-act LN2-free analytical Silicon Drift Detector), and the data analysis was performed on the proprietary INCA software. For transmission electron microscopy (TEM), samples were prepared by bath sonicating monoliths in N-methylpyrolidone (NMP) for 15 minutes to form a dispersion with a nominal concentration of 0.1 mg mL−1. The sample was then deposited onto a lacey carbon TEM grid (Agar Scientific) by drop casting (20 μL). Samples were then allowed to dry overnight prior to imaging. Imaging was carried out on a JEOL 2100F FEG TEM. Powder X-ray diffraction (PXRD) was recorded on a Bruker AXS d8 Advance X-ray powder diffractometer operated at 40 kV and 40 mA, using a Mo Kα1,2 X-ray source (λ = 0.7093 Å). Samples were loaded into a glass capillary for analysis. Sheet resistance was measured using a Keithley 2602 Source Measure Unit (SMU) and a Guardian SRM-232 SP4-62.5-45-TC-FH R = 10 MIL 4-point, in-line probe head. Samples were dispersed in NMP (1 mg mL−1) by sonication and then made into thin films by vacuum filtration onto polycarbonate membranes (0.45 μm, Millipore). Film thickness was measured using a Phillips FEI XL30 SEM after a coating in gold using an Edwards Scancoat 6 sputter coater. Brunauer–Emmett–Teller (BET) surface area measurements were taken using a Micromeritics ASAP 2020 nitrogen porosimeter. Samples were dried on the instrument at 300 °C until pressures of <10 mmHg were achieved and held for 2 h. BET surface areas were measured by nitrogen adsorption at 77 K using 1/2 inch glassware fitted with a filler rod, sealed frit and isothermal jacket.Results and discussion
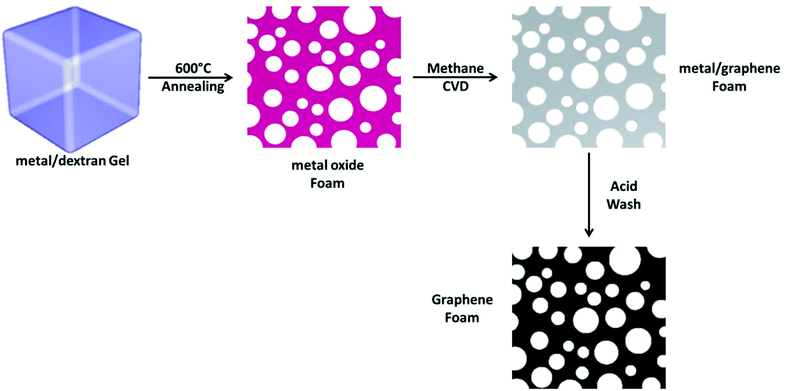
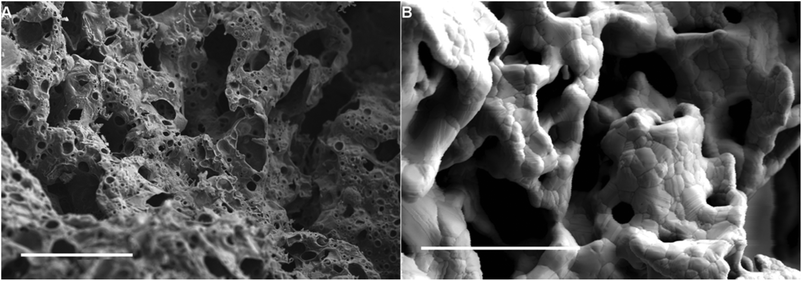
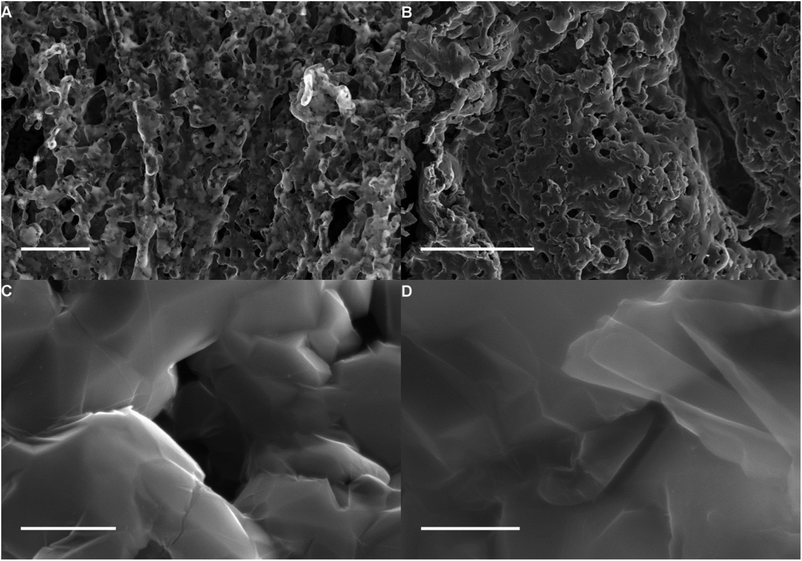
Dextran has been shown to be an efficient template to form metal oxide foams. The pore size, while still macroporous (>50 nm diameter) is an order of magnitude lower than commercial nickel foams which have been used to grow graphene.17 The process involves the annealing of a dextran hydrogel containing metal salt in air (Fig. 1) in order to both dehydrate the gel and subsequently burn off the dextran. During this process the metal salt is oxidized and forms a continuous metal oxide monolith (Fig. 1). This process has been used to produce copper oxide, gold and silver monoliths.36Here we have extended this process to include metal oxide monolithic foams of cobalt, iron and nickel that are more suited to carbon growth through CVD. An example of a cobalt oxide foam obtained by heating a cobalt salt/dextran gel to 600 °C in air can be seen in Fig. 2(A). The representative SEM image of the cobalt oxide foam shows the macroporous nature of the material. Further, these metal oxide monoliths, including copper oxide, can easily be reduced to the elemental metal by simply annealing in hydrogen gas. An example cobalt metal foam is shown in Fig. 2(B). The metal foam was produced by heating the cobalt oxide to 1000 °C under argon and hydrogen. The macroporosity of the foam is retained upon reduction and grain boundaries are now also clearly visible in the polycrystalline metal structure.
The reduced metal oxide foam, where the metal is iron, copper, nickel or cobalt, can be used as a template to grow graphene on the surface by methane CVD. For simplicity, the reduction and CVD can be combined into a single step. A schematic of the synthesis is shown in Fig. 1. Firstly, the metal oxide is reduced using flowing hydrogen in argon at 1000 °C and then methane is slowly introduced to act as the carbon source.
In the case of the metals nickel and iron; carbon from the methane precursor is thought to dissolve into the metal, forming a solid solution, and then precipitate upon cooling.41 Graphene has been shown to form this way with nickel,41 and the same mechanism is thought to apply to cobalt due to the similar solubility of carbon in both nickel and cobalt.42
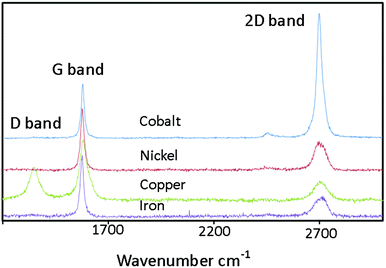
Representative Raman spectra for graphene grown on copper foam (CuGF), nickel foam (NiGF), iron foam (FeGF) and cobalt foam (CoGF) are shown in Fig. 3. Interestingly, very different spectra were obtained for each metal. All spectra contain the characteristic peaks for graphitic material with a G band at 1577 cm−1 and a 2D band at 2695 cm−1.43 The CuGF material exhibits an additional peak at 1346 cm−1, assigned to the D band, which is presumably present due to nanocrystalline domain sizes.44 Using the equation La(nm) = (2.4 × 10⁻¹⁰)λ4(ID/IG)−1, where La is average crystallite size, λ is laser excitation wavelength and ID/IG the ratio of intensities of the D and G band,45 the average crystallite size of the graphene on the copper foam was found to be 42.5 nm (SD = 8.4), averaged over 307 spectra. A frequency histogram of ID/IG for CuGF can be found in the ESI (Fig. S1†). The D-band is absent in NiGF, FeGF and CoGF indicating that the carbon material formed is more crystalline. This is probably due to the different mechanism operating for copper mediated carbon growth. On copper, carbon adsorbs onto the metal surface and then joins together to form the sp2 framework.46 As this is a surface related mechanism, it is more sensitive to defects and curvature in the metal template. Although, copper is often the metal of choice for controlled graphene growth on flat metal surfaces, such substrates tend to be highly polished.47 The formation of highly defective graphene/graphitic material is likely to be as a consequence of the surface roughness and poor crystallinity of the underlying 3-D copper catalyst monoliths generated in situ prior to carbon growth.
In graphene the 2D band, a second-order overtone of the in-plane vibration, D, can be particularly informative. It has been shown that for CVD graphene there is a correlation between the ratio of the intensities of the G and the 2D band (IG/I2D) and graphene layer number.24,48,49 The IG/I2D ratio for CoGF, NiGF, FeGF and CuGF are 0.5, 2.1, 2.9 and 2.5 respectively suggesting that the cobalt derived graphene is 1–3 layers thick whereas the nickel, iron and copper derived graphene is >3 layers.24 Growth of the graphene foams on the cobalt monoliths consistently gave fewer-layer graphene and will be the focus herein.
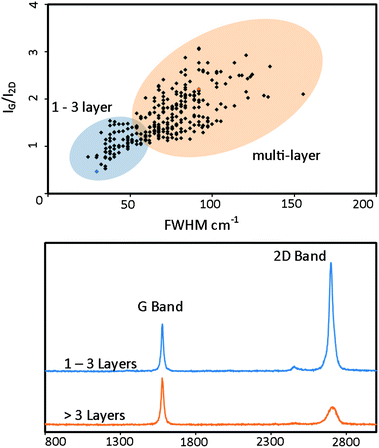
Extensive Raman analysis reveals that the macroporous graphene foam grown on cobalt contains regions of 1–3 layer graphene and regions of >3 layers. This was determined from both the IG/I2D ratio and the full width half maximum (FWHM) of the 2D peak. A scatter plot of IG/I2D against 2D FWHM, representing 288 individual spectra, is shown in Fig. 4 along with representative spectra. 1–3 layer material was identified with IG/I2D of 0.5 and 2D FWHM of 30 cm−1 and multilayer material with a typical IG/I2D of 2.2 and 2D FWHM of 92 cm−1. These values are in agreement with reported values 1–3 and >3 layer CVD grown graphene.24 The non-uniform graphene thickness is attributed to the preferential precipitation of carbon at grain boundaries on the metal template resulting in thicker graphene regions.50
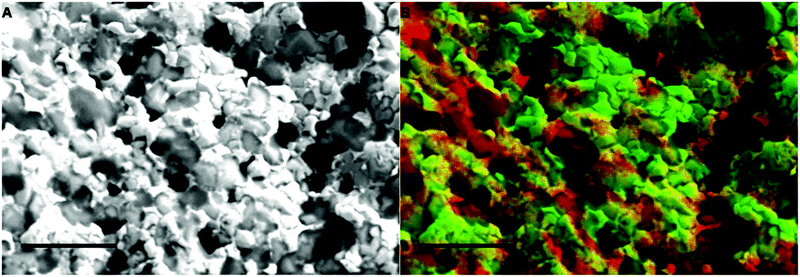
Further evidence of the different graphene thickness in CoGF is shown in Fig. 5. Fig. 5(A) shows an SEM image of the CoGF before an acid wash while Fig. 5(B) shows an EDX map of carbon across the same area. The EDX map of the carbon signal intensity across the region shows areas of both low (green) and high (red) carbon intensity. These distinct regions are attributed to areas of 1–3 layer graphene (green) and >3 layer graphene (red). Comparing Fig. 5(A) with Fig. 2, it can be seen that the macroporosity of the template is retained upon graphene growth.
The metal can be readily removed from the material, by a simple acid wash, leaving a self supporting macroporous graphene material, Fig. 6. BET surface area measurements of the 3D graphene foam grown on cobalt gave values between 60 and 105 m2 g−1. EDX data (Fig. S2†), averaged across the entire image in Fig. 6A confirms that most of the cobalt has been removed from the graphene foam during the washing process. Cobalt peaks are expected at approximately 0.77 keV. This is confirmed by TGA (Fig. S4†) where under 7% by mass remains after heating to 1000 °C in air, which is attributed to cobalt oxide. Fig. 6(C) and (D) show numerous graphene sheets on top of each other and that the graphene material is very sheet like while (C) shows that the sheets are wrinkled. Wrinkles are thought to be present due to the difference in thermal expansion coefficients of the cobalt and the graphene.51 The high level of transparency observed for the graphene material in the SEM images suggests that the sheets are very thin.
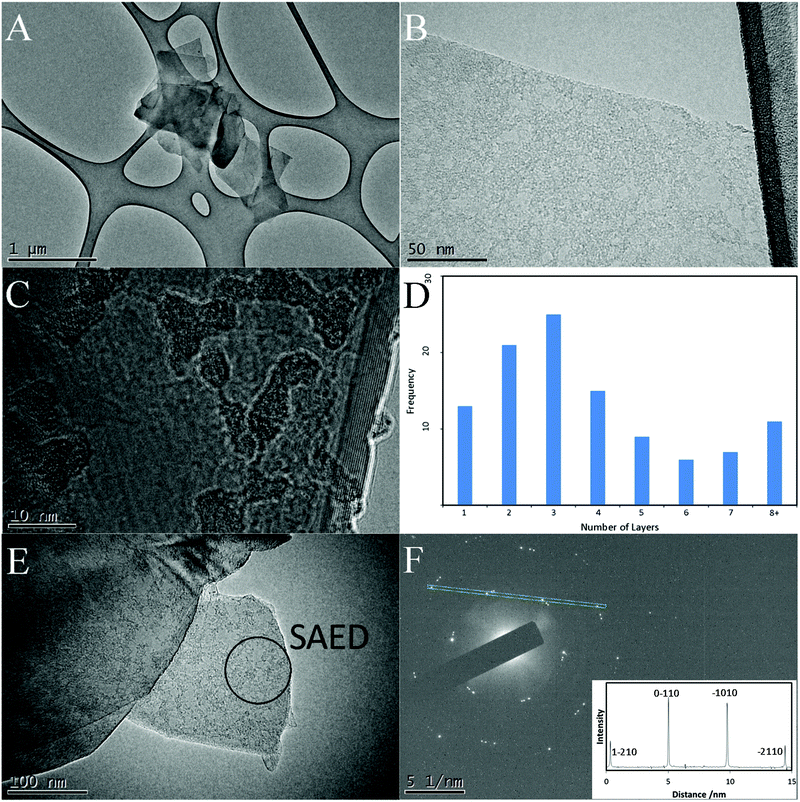
To gain further information on the graphene sheets making up the macroporous structure, CoGF was bath sonicated in N-methylpyrolidone to break up the monolithic structure. TEM images of the graphene sheets, shown in Fig. 7, were found to be thin and entirely graphene like with no other carbon based structures present. In agreement with the Raman and SEM data, the graphene sheets were observed to be single (Fig. 7B) and multi-layered (Fig. 7(C)). Fig. 7(D) shows a frequency histogram of the distribution of single- few- and multi-layer sheets observed in the TEM. The normal-incidence selected area electron diffraction (SAED) pattern (Fig. 7(F) inset) taken from marked region in Fig. 7(E) shows the typical six-fold symmetry for graphene with reflections, at 0.212, 0.123 nm which correspond to the (0![[1 with combining macron]](https://www.rsc.org/images/entities/char_0031_0304.gif) 10) and (1
10) and (1![[2 with combining macron]](https://www.rsc.org/images/entities/char_0032_0304.gif) 10) indices respectively.52 The multiple hexagonal patterns present suggest a number of graphene sheets are lying on top of each other. Three sets of spots are clearly visible in the diffraction pattern indicating three layers stacked on top of each other, the offset of the spots relative to the most intense shows that the second and third sheets are rotated approximately 5° and 7° respectively. The intensity of the dominant reflections can be used to provide information on any stacking that may be present. Previous studies have shown that for few-layer graphene and graphite with Bernal (AB) stacking the intensity ratio of I{1100}/I{2110} is <1, whereas monolayer graphene I{1100}/I{2110} is >1.52,53 The intensity profile (Fig. 7(F) inset) shows that the intensity of the (0
10) indices respectively.52 The multiple hexagonal patterns present suggest a number of graphene sheets are lying on top of each other. Three sets of spots are clearly visible in the diffraction pattern indicating three layers stacked on top of each other, the offset of the spots relative to the most intense shows that the second and third sheets are rotated approximately 5° and 7° respectively. The intensity of the dominant reflections can be used to provide information on any stacking that may be present. Previous studies have shown that for few-layer graphene and graphite with Bernal (AB) stacking the intensity ratio of I{1100}/I{2110} is <1, whereas monolayer graphene I{1100}/I{2110} is >1.52,53 The intensity profile (Fig. 7(F) inset) shows that the intensity of the (0![[1 with combining macron]](https://www.rsc.org/images/entities/char_0031_0304.gif) 10) and (
10) and (![[1 with combining macron]](https://www.rsc.org/images/entities/char_0031_0304.gif) 010) are significantly greater than (1
010) are significantly greater than (1![[2 with combining macron]](https://www.rsc.org/images/entities/char_0032_0304.gif) 10) and (
10) and (![[2 with combining macron]](https://www.rsc.org/images/entities/char_0032_0304.gif) 110), indicating monolayer graphene.53
110), indicating monolayer graphene.53
Conclusion
Macroporous graphene foams were synthesized using a simple soft-template procedure, for the first time, starting from a dextran gel mixed with metal salt followed by methane CVD. In the case of iron and nickel, the macroporous foams were made up of few-layer (>3) graphene/graphite. When copper was used the few-layer graphene/graphite was found to be more defective with a large D band present in the Raman spectrum. However, when the metal was cobalt, the macroporous graphene contained thin graphene sheets of 1–3 layers as well as regions of thicker graphene sheets (>3 layers). The presence of the thicker regions are thought to help structurally support the 3D foam monolith.Acknowledgements
We acknowledge financial support from the EPSRC EP/K016784/1. M. K. T. acknowledges EPSRC for a studentship through a Doctoral Training Grant.References
- K. S. Novoselov, A. K. Geim, S. V. Morozov, D. Jiang, Y. Zhang, S. V. Dubonos, I. V. Grigorieva and A. A. Firsov, Science, 2004, 306, 666–669 CrossRef CAS PubMed.
- A. K. Geim and K. S. Novoselov, Nat. Mater., 2007, 6, 183–191 CrossRef CAS PubMed.
- A. A. Balandin, S. Ghosh, W. Bao, I. Calizo, D. Teweldebrhan, F. Miao and C. N. Lau, Nano Lett., 2008, 8, 902–907 CrossRef CAS PubMed.
- Y. Wang, Y. Wu, Y. Huang, F. Zhang, X. Yang, Y. Ma and Y. Chen, J. Phys. Chem. C, 2011, 115, 23192–23197 CrossRef CAS.
- H. Bi, X. Xie, K. Yin, Y. Zhou, S. Wan, L. He, F. Xu, F. Banhart, L. Sun and R. S. Ruoff, Adv. Funct. Mater., 2012, 22, 4421–4425 CrossRef CAS.
- Y. Xia, G. S. Walker, D. M. Grant and R. Mokaya, J. Am. Chem. Soc., 2009, 131, 16493–16499 CrossRef CAS PubMed.
- X. C. Dong, H. Xu, X. W. Wang, Y. X. Huang, M. B. Chan-Park, H. Zhang, L. H. Wang, W. Huang and P. Chen, ACS Nano, 2012, 6, 3206–3213 CrossRef CAS PubMed.
- H. Bi, F. Huang, J. Liang, Y. Tang, X. Lü, X. Xie and M. Jiang, J. Mater. Chem., 2011, 21, 17366 RSC.
- J. Xiao, D. Mei, X. Li, W. Xu, D. Wang, G. L. Graff, W. D. Bennett, Z. Nie, L. V. Saraf, I. A. Aksay, J. Liu and J. G. Zhang, Nano Lett., 2011, 11, 5071–5078 CrossRef CAS PubMed.
- S. Stankovich, D. A. Dikin, G. H. B. Dommett, K. M. Kohlhaas, E. J. Zimney, E. A. Stach, R. D. Piner, S. T. Nguyen and R. S. Ruoff, Nature, 2006, 442, 282–286 CrossRef CAS PubMed.
- J. Klett, R. Hardy, E. Romine, C. Walls and T. Burchell, Carbon, 2000, 38, 953–973 CrossRef CAS.
- X. Cao, Y. Shi, W. Shi, G. Lu, X. Huang, Q. Yan, Q. Zhang and H. Zhang, Small, 2011, 7, 3163–3168 CrossRef CAS PubMed.
- X. Cao, Z. Yin and H. Zhang, Energy Environ. Sci., 2014, 7, 1850 Search PubMed.
- B. Abdulhakeem, B. Farshad, M. Damilola, T. Fatemeh, F. Mopeli, D. Julien and M. Ncholu, RSC Adv., 2014, 4, 39066 RSC.
- Y. Huang, D. Wu, J. Jiang, Y. Mai, F. Zhang, H. Pan and X. Feng, Nano Energy, 2015, 12, 287–295 CrossRef CAS.
- B. G. Choi, M. Yang, W. H. Hong, J. W. Choi and Y. S. Huh, ACS Nano, 2012, 6, 4020–4028 CrossRef CAS PubMed.
- Z. Chen, W. Ren, L. Gao, B. Liu, S. Pei and H.-M. Cheng, Nat. Mater., 2011, 10, 424–428 CrossRef CAS PubMed.
- Z. Chen, C. Xu, C. Ma, W. Ren and H.-M. Cheng, Adv. Mater., 2013, 25, 1296–1300 CrossRef CAS PubMed.
- S. Park, S.-O. Kang, E. Jung, S. Park and H. S. Park, RSC Adv., 2014, 4, 899–902 RSC.
- H. Bai, C. Li, X. Wang and G. Shi, J. Phys. Chem. C, 2011, 115, 5545–5551 CrossRef CAS.
- Y. Xu, K. Sheng, C. Li and G. Shi, ACS Nano, 2010, 4, 4324–4330 CrossRef CAS PubMed.
- Z.-S. Wu, A. Winter, L. Chen, Y. Sun, A. Turchanin, X. Feng and K. Müllen, Adv. Mater., 2012, 24, 5130–5135 CrossRef CAS PubMed.
- X. Li, W. Cai, J. An, S. Kim, J. Nah, D. Yang, R. Piner, A. Velamakanni, I. Jung, E. Tutuc, S. K. Banerjee, L. Colombo and R. S. Ruoff, Science, 2009, 324, 1312–1314 CrossRef CAS PubMed.
- A. Reina, X. Jia, J. Ho, D. Nezich, H. Son, V. Bulovic, M. S. Dresselhaus, K. Jing and J. Kong, Nano Lett., 2009, 9, 30–35 CrossRef CAS PubMed.
- W. Kicinski, M. Bystrzejewski, M. H. Ruemmeli and T. Gemming, Bull. Mater. Sci., 2014, 37, 141–150 CrossRef CAS.
- H. Wang, Y. Wang, Y. Li, Y. Wan and Q. Duan, Carbon, 2015, 82, 116–123 CrossRef CAS.
- Y. He, W. Chen, X. Li, Z. Zhang, J. Fu, C. Zhao and E. Xie, ACS Nano, 2013, 7, 174–182 CrossRef CAS PubMed.
- P. Trinsoutrot, H. Vergnes and B. Caussat, Mater. Sci. Eng., B, 2014, 179, 12–16 CrossRef CAS.
- K. S. Kim, Y. Zhao, H. Jang, S. Y. Lee, J. M. Kim, K. S. Kim, J.-H. Ahn, P. Kim, J.-Y. Choi and B. H. Hong, Nature, 2009, 457, 706–710 CrossRef CAS PubMed.
- C. Tang, B. Q. Li, Q. Zhang, L. Zhu, H. F. Wang, J. Le Shi and F. Wei, Adv. Funct. Mater., 2016, 26, 577–585 CrossRef CAS.
- M. Mecklenburg, A. Schuchardt, Y. K. Mishra, S. Kaps, R. Adelung, A. Lotnyk, L. Kienle and K. Schulte, Adv. Mater., 2012, 24, 3486–3490 CrossRef CAS PubMed.
- W. Li, S. Gao, L. Wu, S. Qiu, Y. Guo, X. Geng, M. Chen, S. Liao, C. Zhu, Y. Gong, M. Long, J. Xu, X. Wei, M. Sun and L. Liu, Sci. Rep., 2013, 3, 2125 CrossRef PubMed.
- F. J. Maldonado-Hódar, C. Moreno-Castilla, J. Rivera-Utrilla, Y. Hanzawa and Y. Yamada, Langmuir, 2000, 16, 4367–4373 CrossRef.
- A. H. Lu, W. C. Li, E. L. Salabas, B. Spliethoff and F. Schuth, Chem. Mater., 2006, 18, 2086–2094 CrossRef CAS.
- D. Walsh, L. Arcelli, T. Ikoma, J. Tanaka and S. Mann, Nat. Mater., 2003, 2, 386–390 CrossRef CAS PubMed.
- F. Khan and S. Mann, J. Phys. Chem. C, 2009, 113, 19871–19874 CrossRef CAS.
- X.-Y. Yang, A. Léonard, A. Lemaire, G. Tian and B.-L. Su, Chem. Commun., 2011, 47, 2763 RSC.
- Y. Liu, J. Goebl and Y. Yin, Chem. Soc. Rev., 2013, 42, 2610–2653 RSC.
- R.-H. Jin and J.-J. Yuan, J. Mater. Chem., 2005, 15, 4513–4517 RSC.
- M. Iwasaki, S. A. Davis and S. Mann, J. Sol–Gel Sci. Technol., 2004, 32, 99–105 CrossRef CAS.
- X. Li, W. Cai, L. Colombo and R. S. Ruoff, Nano Lett., 2009, 9, 4268–4272 CrossRef CAS PubMed.
- H. Ago, Y. Ito, N. Mizuta, K. Yoshida, B. Hu, C. M. Orofeo, M. Tsuji, K. Ikeda and S. Mizuno, ACS Nano, 2010, 4, 7407–7414 CrossRef CAS PubMed.
- A. C. Ferrari, J. C. Meyer, V. Scardaci, C. Casiraghi, M. Lazzeri, F. Mauri, S. Piscanec, D. Jiang, K. S. Novoselov, S. Roth and A. K. Geim, Phys. Rev. Lett., 2006, 97, 1–4 Search PubMed.
- A. Ferrari and J. Robertson, Phys. Rev. B: Condens. Matter, 2000, 61, 14095–14107 CrossRef CAS.
- M. A. Pimenta, G. Dresselhaus, M. S. Dresselhaus, L. G. Cançado, A. Jorio and R. Saito, Phys. Chem. Chem. Phys., 2007, 9, 1276–1291 RSC.
- Q. Li, H. Chou, J.-H. Zhong, J.-Y. Liu, A. Dolocan, J. Zhang, Y. Zhou, R. S. Ruoff, S. Chen and W. Cai, Nano Lett., 2013, 13, 486–490 CrossRef CAS PubMed.
- Z. Yan, J. Lin, Z. Peng, Z. Sun, Y. Zhu, L. Li, C. Xiang, E. L. Samuel, C. Kittrell and J. M. Tour, ACS Nano, 2012, 6, 9110–9117 CrossRef CAS PubMed.
- D. R. Lenski and M. S. Fuhrer, J. Appl. Phys., 2011, 110, 013720 CrossRef.
- Z. Tu, Z. Liu, Y. Li, F. Yang, L. Zhang, Z. Zhao, C. Xu, S. Wu, H. Liu, H. Yang and P. Richard, Carbon, 2014, 73, 252–258 CrossRef CAS.
- S. Thiele, A. Reina, P. Healey, J. Kedzierski, P. Wyatt, P.-L. Hsu, C. Keast, J. Schaefer and J. Kong, Nanotechnology, 2010, 21, 015601 CrossRef PubMed.
- S. J. Chae, F. Güneş, K. K. Kim, E. S. Kim, G. H. Han, S. M. Kim, H.-J. Shin, S.-M. Yoon, J.-Y. Choi, M. H. Park, C. W. Yang, D. Pribat and Y. H. Lee, Adv. Mater., 2009, 21, 2328–2333 CrossRef CAS.
- J. C. Meyer, A. K. Geim, M. I. Katsnelson, K. S. Novoselov, T. J. Booth and S. Roth, Nature, 2007, 446, 60–63 CrossRef CAS PubMed.
- Y. Hernandez, V. Nicolosi, M. Lotya, F. M. Blighe, Z. Sun, S. De, I. T. McGovern, B. Holland, M. Byrne, Y. K. Gun'Ko, J. J. Boland, P. Niraj, G. Duesberg, S. Krishnamurthy, R. Goodhue, J. Hutchison, V. Scardaci, A. C. Ferrari and J. N. Coleman, Nat. Nanotechnol., 2008, 3, 563–568 CrossRef CAS PubMed.
Footnotes |
| † Electronic supplementary information (ESI) available: Raman, EDX, PXRD, TGA, electrical conductivity data and SEM. See DOI: 10.1039/c6nr02455f |
| ‡ These authors contributed equally. |
| This journal is © The Royal Society of Chemistry 2016 |

