 Open Access Article
Creative Commons Attribution 3.0 Unported Licence
Azobenzene – functionalized polyelectrolyte nanolayers as ultrafast optoacoustic transducers
E. S.
Pavlenko
a,
M.
Sander
a,
S.
Mitzscherling
b,
J.
Pudell
a,
F.
Zamponi
a,
M.
Rössle
a,
A.
Bojahr
a and
M.
Bargheer
*ac
aInstitute of Physics and Astronomy, University of Potsdam, Karl-Liebknecht-Str. 24-25, 14476 Potsdam, Germany. E-mail: bargheer@uni-potsdam.de
bFederal Institute for Materials Research and Testing, Unter den Eichen 87, 12205 Berlin, Germany
cHelmholtz-Zentrum Berlin, Albert-Einstein-Str. 15, 12489 Berlin, Germany
First published on 15th June 2016
Abstract
We introduce azobenzene-functionalized polyelectrolyte multilayers as efficient, inexpensive optoacoustic transducers for hyper-sound strain waves in the GHz range. By picosecond transient reflectivity measurements we study the creation of nanoscale strain waves, their reflection from interfaces, damping by scattering from nanoparticles and propagation in soft and hard adjacent materials like polymer layers, quartz and mica. The amplitude of the generated strain ε ∼ 5 × 10⁻⁴ is calibrated by ultrafast X-ray diffraction.
Introduction
Optomechanical transducers are widely used in condensed matter. One application is to generate strain waves in order to study mechanical, thermo-elastic, opto-acoustic, magneto-acoustic and other properties of materials.1–5 In the field of picosecond-acoustics, the ultrashort period of the excited waves allows for investigations on the nanometer length scale. Yet for soft matter, studying objects on the nano-scale by such hyper-sound waves is not well developed, although it has been successfully used for imaging of cells.6–8 Standard materials like titanium, aluminum or chromium, which are used as opto-mechanical transducers for many solids,9,10 often are not suitable for soft matter samples. They may require additional treatment due to hydrophobicity, are not biocompatible and even if these technical problems are solved, they suffer from large acoustic impedance mismatches. Therefore, soft matter transducers will be advantageous to study soft matter objects. Several polymers and photosensitive molecules have been investigated regarding their opto-mechanical properties.11–13 Azobenzene (Azo) is the most thoroughly investigated photosensitive molecule.14–18 It undergoes trans–cis and reverse isomerization when illuminated by ultraviolet (UV) and visible (Vis) light, respectively. This effect is used in several experimental realizations of Azo-containing molecular devices and machines.19–23 In particular, various Azo-containing polyelectrolytes were investigated under periodic UV-Vis illumination.24,25 A partially irreversible expansion followed by reversible contraction–expansion under appropriate illumination was observed.25 Polyelectrolyte multilayers form particularly robust, electrostatically bound thin films which can be deposited on various soft matter surfaces.24 The film thickness is controlled via layer-by-layer deposition with nanometric precision.26 Even though expansion and contraction of Azo-containing materials has been studied, there have been no reports on using nanoscale multilayers as optoacoustic transducers. Also the transient response of Azo-compound materials including the photo-induced volume change has not been studied on the picosecond time scale, on which molecular rearrangements take place.In this work, we obtain quantitative information on the amplitude and phase of the strain waves generated in Azo-containing polyelectrolyte multilayers that transform the light energy of ultraviolet femtosecond pulses into hyper-sound waves. We investigate the propagation of the waves in polymers, crystalline mica, and quartz and observe the damping of these waves by scattering from nanoparticles. For a quantitative assessment of the strain amplitude, we used ultrafast X-ray diffraction (UXRD). Time-domain Brillouin scattering (TDBS)27 was used to follow the strain propagation on the picosecond time scale in the all-optical experiments. We believe that these polyelectrolyte-nanolayer-transducers will allow for a new class of experiments using picosecond ultrasonics to investigate various structures down to nano-sized objects.
Methods
We produced various samples via spin-assisted layer-by-layer deposition.28,29 With this technique, one can create structures with different, well-defined thicknesses on the nanometer length scale, and very smooth interfaces. In this experiment the following polyelectrolytes have been used: poly(allylamine hydrochloride) (PAH) Mw ∼ 58![[thin space (1/6-em)]](https://www.rsc.org/images/entities/char_2009.gif) 000 g mol−1; poly(sodium 4-styrenesulfonate) (PSS) Mw ∼ 70
000 g mol−1; poly(sodium 4-styrenesulfonate) (PSS) Mw ∼ 70![[thin space (1/6-em)]](https://www.rsc.org/images/entities/char_2009.gif) 000 g mol−1; poly(ethyleneimine) (PEI) 50 wt% aqueous solution, Mw ∼ 750
000 g mol−1; poly(ethyleneimine) (PEI) 50 wt% aqueous solution, Mw ∼ 750![[thin space (1/6-em)]](https://www.rsc.org/images/entities/char_2009.gif) 000 g mol−1; poly[1-[4-(3-carboxy-4-hydroxyphenylazo)benzenesulfonamide]-1,2-ethanediyl, sodium salt] (PAzo).
000 g mol−1; poly[1-[4-(3-carboxy-4-hydroxyphenylazo)benzenesulfonamide]-1,2-ethanediyl, sodium salt] (PAzo).
All polyelectrolytes were purchased from Sigma-Aldrich Chemie Gmbh (Germany). PSS was dialyzed against ultra-purified water from an ELGA (PURELAB Classic) water purifier system before application. The other polymers were used as received, without further purification.
Aqueous polymer solutions were prepared with the following concentrations of polyelectrolytes: for PSS, PAH – 0.1% by weight, PEI – 1% by weight, PAzo – 0.1% by weight. The NaCl concentrations in the final solutions were 0.7 mol l−1 for PSS and PAH and 0.2 mol l−1 for PAzo; no NaCl was added to the PEI.
Gold nanorods (GNR), used in only one sample structure were synthesised by the method described by Nikoobakht et al.30 to grow rods of the aspect ratio 3.25 indicated by a longitudinal plasmon resonance at 700 nm and verified by TEM images showing an average length of about 70 nm. The GNRs were coated with PSS in order to provide reliable bonding to the polymer surface.31 To deposit the GNRs onto the sample, the surface was covered completely with GNR solution, left for 30 min and then washed with purified water.
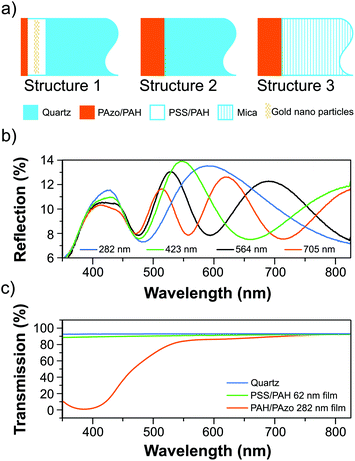
Fig. 1(a) schematically summarizes the characteristic layering sequence of the samples.
Sample preparation
Fused silica discs (thickness 1.58 mm, diameter 24.5 mm) were used as substrates for optical experiments. The substrates were hydrophilized with a H2SO4/(30% H2O2) (3![[thin space (1/6-em)]](https://www.rsc.org/images/entities/char_2009.gif) :
:![[thin space (1/6-em)]](https://www.rsc.org/images/entities/char_2009.gif) 1) (warning: hazardous acid) bath for 1 h, after which the substrates were washed excessively with pure water and dried in a nitrogen flow. In order to provide a reliable bonding of the polyelectrolytes to the substrate, a single layer of PEI polyelectrolyte was always deposited first, followed by washing. The thickness of one double layer of PSS/PAH is about 2.5 nm.26 For PAzo/PAH this parameter is about 4.7 nm, as determined by AFM measurements. When films of dozens of double layers are constructed, the total thickness deviation is within 10% of the expected thickness. As a substrate for the ultrafast X-ray diffraction (UXRD) experiments we used a mica sheet (from Tedpella) with a thickness of approximately 4.5 μm, determined by spectroscopic ellipsometry. The polyelectrolyte structure has been deposited on mica in the same way as onto the quartz substrates, however without previous hydrophilization.
1) (warning: hazardous acid) bath for 1 h, after which the substrates were washed excessively with pure water and dried in a nitrogen flow. In order to provide a reliable bonding of the polyelectrolytes to the substrate, a single layer of PEI polyelectrolyte was always deposited first, followed by washing. The thickness of one double layer of PSS/PAH is about 2.5 nm.26 For PAzo/PAH this parameter is about 4.7 nm, as determined by AFM measurements. When films of dozens of double layers are constructed, the total thickness deviation is within 10% of the expected thickness. As a substrate for the ultrafast X-ray diffraction (UXRD) experiments we used a mica sheet (from Tedpella) with a thickness of approximately 4.5 μm, determined by spectroscopic ellipsometry. The polyelectrolyte structure has been deposited on mica in the same way as onto the quartz substrates, however without previous hydrophilization.
The main advantages of the proposed nanoscale transducers are the low cost of the layer-by-layer preparation and the ease with which it can be attached to almost any flat or curved surface.
Sample characterisation
The static all-optical characterization of the thin polyelectrolyte multilayers was carried out using a UV-Vis spectrophotometer (VARIAN CARY 5000). Fig. 1(c) shows typical transmission spectra of a PAzo/PAH and a PSS/PAH multilayer as well as a quartz substrate. Static reflection spectra of films with the structure 2 for four different thicknesses dPAzo/PAH = 248, 423, 564, and 795 nm are plotted in Fig. 1(b). The interference of light reflected at the surface and at the polymer–substrate interface results in pronounced interference fringes as a function of the wavelength λ with minima at2nfilmd![[thin space (1/6-em)]](https://www.rsc.org/images/entities/char_2009.gif) cos(β) = mλ, cos(β) = mλ, | (1) |
These measurements were cross-checked with spectroscopic ellipsometry (Sentech, SENresearch SE850E) and atomic force microscopy of purposely scratched films.
Ultrafast pump–probe spectroscopy
In order to establish the azobenzene-containing polymer as an opto-mechanical transducer for hyper-sound, we recorded transient optical reflectivity spectra with 140 fs time resolution based on a regeneratively amplified Ti:sapphire laser system from Spectra-Physics (MaiTai/Spitfire Pro) with a central wavelength of 795 nm. A small fraction of approximately 5 μJ was frequency-doubled in a BBO crystal. These pump-pulses with a wavelength of 398 nm were separated from the fundamental by a filter and focused onto the sample with a pump fluence of about 1 mJ cm−2 to excite the azobenzene. Another 2 μJ of the laser energy were used to generate a white light continuum in a 1 mm-thick sapphire plate. These pulses probe the sample with an adjustable delay time t after excitation, and their reflection is recorded in a fiber spectrometer (Avantes). The pump and probe pulses are both p-polarized, and the pump beam was chopped at a rate of 125 Hz to measure the relative changes of the reflectance between the perturbed (R0 + ΔR) and unperturbed (R0) sample.32 Both pulses enter the sample from the front side (polymer structure side) at an angle of about α = 30° which yields the internal angle β according to Snell's law.Ultrafast X-ray diffraction (UXRD)
Ultrafast X-ray diffraction measurements were performed with the diffractometer at the laser-driven plasma X-ray source (PXS) at the University of Potsdam.33,34 The PXS provides a temporal resolution below 200 fs at an X-ray photon energy of 8.047 keV (Cu Kα). The X-ray and UV footprints on the sample have diameters of approximately 300 μm and 1 mm (FWHM), respectively. The fluence of the 398 nm pump light was 4 mJ cm−2. An X-ray optic with a convergent beam is used with an X-ray area detector to map out the reciprocal space of the mica substrate.35 Therefore, the specular and asymmetrically diffracted X-ray photons under the Bragg angle are detected simultaneously. The measurements were taken at a fixed sample angle omega, which is interpreted as a cut through the crystal truncation rod of the mica sheet.Experimental results and discussion
All-optical generation and detection of propagating strain waves
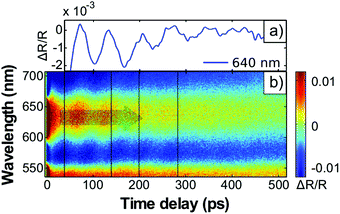
As a first example of all-polymer hyper-sound-transduction, we designed and prepared samples on quartz substrates according to structure 1 (Fig. 1a) with a relatively thick PSS/PAH multilayer (dPSS/PAH = 630 nm). We incorporated gold nanoparticles in the middle of this PSS/PAH multilayer stack in order to scatter the hyper-sound waves and to exemplify the detection of impurities by nanoscale strain waves. The 80 nm thick composite layer contains a volume fraction of about 1% Au particles. On the top of the sample we added a thin PAzo/PAH multilayer (dPAzo1 = 141 nm) as the opto-mechanical transducer. The 398 nm pump pulses are exclusively absorbed in the PAzo/PAH multilayer, since PSS/PAH is transparent at this wavelength (Fig. 1(c)). Both layers are transparent for the white probe pulse spectrum. The transient reflectivity data ΔR(t)/R0 in Fig. 2(a) show pronounced oscillations as a function of the time delay. The wavelength-dependence of the oscillation period| T = λ/[2vsn(λ)cos(β)] | (2) |
| Material | Density [kg m−3] | Sound velocity [nm ps−1] | Acoustic impedance Z [106 Ns m−3] | Refractive index @ λ = 600 nm |
|---|---|---|---|---|
| Values from the literature are indicated by citations. Sound velocities are measured values according to eqn (2). Refractive indices are measured by ellipsometry. | ||||
| PSS/PAH | 940 (ref. 36) | 3.4 | 3.1 | 1.47 |
| PAzo/PAH | 1000 | 3.4 | 3.4 | 1.71 |
| Quartz | 2200 (ref. 37) | 5.8 (ref. 37) | 12.7 | 1.45 (ref. 37) |
| Mica | 2700 | 5.0 (ref. 38) | 13.5 | 1.56 |
At t = 140 ps, the strain front launched from the surface reaches the incorporated nanoparticles residing at a depth of about 470 nm. The particles reduce the signal modulation by scattering the hyper-sound amplitude. The wavepacket components of the strain wave detected in Fig. 2 have a wavelength of about 250 nm compared to the GNR length of about 70 nm. Propagation of the entire strain front through the 80 nm composite layer of the nanoparticles takes about 60 ps, therefore the damping appears as a delayed feature (Fig. 2(a)). At t = 280 ps, the strain front reaches the quartz substrate and the TDBS signal essentially disappears. The remaining amplitude of the TDBS signal is caused by the reflection of the strain pulse at the polymer–quartz interface (see Discussion below).
The transient reflection shown in Fig. 2(a) also exhibits the characteristic static thin-film-interference (Fig. 1(b)) given by the total optical path length s = n × dfilm = nPSS/PAH × DPSS/PAH + nPAzo1 × DPAzo1 of the total polymer multilayers. In structures with relatively thin PAzo/PAH layer, the total thickness is nearly unchanged since the expanding transducer contributes only little to the polymer film thickness.
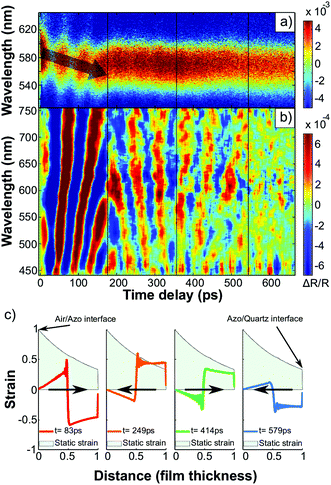
Fig. 3(a) shows ΔR(t)/R0 of a 600 nm thick PAzo/PAH film on quartz. Again, we observe the TDBS-related oscillations. Their wavelength-dependent oscillation period T(λ) is the same as for the sample structure 2, because the sound velocities in PSS/PAH and PAzo/PAH films match. The strain wave continuously expands the transducer layer until at t = DAzo2/νpoly = 180 ps the strain front is reflected at the quartz interface.
Surprisingly, the shift of the thin-film-interference indicates a decreasing optical path length s = n × dfilm although the transducer is expanding. A decreased refractive index nazo of Azo-containing polymers for expanded films was already observed by Tanchak et al.25 on much longer time scales. They observed a decrease of the refractive index of Δn/n = −1% for a relative thickness change of Δd/d = +1.4%. This is consistent with our observations on ultrafast timescales: for an excitation fluence of F = 4 mJ cm−2 the average strain (relative thickness change) is about ε = Δd/d ∼ 5 × 10⁻⁴, which is calibrated by ultrafast X-ray diffraction as described below. We can simulate the observed transient reflectivity data including the 20 nm shift of thin-film interference pattern (interference maximum at 580 nm shifts to 560 nm) shown in Fig. 3a by assuming a relative refractive index change of Δn/n = −2.6 × 10⁻⁴ in the expanded polymer layer.
Fig. 3(b) shows the extracted oscillatory part of Fig. 3(a) by a Fourier-decomposition. In the data, one can very clearly observe the reflection of the strain wave at the quartz interface at 180 ps. Fig. 3(c) shows four snapshots of the motion at times, at which the main strain-front originating at the surface is in the center of the film, as it bounces between the interface and the surface. The linear chain model used for the illustration is further explained in the discussion of the ultrafast X-ray diffraction data. The green shaded area depicts the static strain profile generated by the stress profile assumed in the simulations according to the approximate penetration depth of about 500 nm for the intense excitation pulses with a wavelength of 400 nm. In the linear regime (Fig. 1c), the penetration depth is less than 250 nm. The lines in Fig. 3(c) indicate the superimposed propagating bipolar strain pulse. Adding the static (green shaded area) and propagating bipolar strain yield the total transient strain. Initially, it is essentially an expansion wave travelling from the surface to the substrate with a smaller leading compressive part.39 The reflection of the bipolar strain pulse from the substrate – a material with larger acoustic impedance – conserves the sign. According to the acoustic impedance mismatch, a fraction of (Zpoly − ZQ)/(Zpoly + ZQ) = 60% of the wave is reflected (Table 1). After the first reflection (t = 180 ps), the acoustic waveform propagates towards the laser probe-pulse. The refractive index change at the strain front now has the opposite sign, yielding a phase shift of π in the oscillation pattern. At t = 360 ps the acoustic pulse is reflected at the air interface which reverses the sign of the wave and of the propagation direction. Therefore, no phase shift is observed in the TDBS signal. The third reflection at t = 540 ps is so weak that the signal vanishes in the noise. In order to measure the 40% fraction of the strain pulse that propagates into the substrate, we designed a sample structure 2 with a thinner transducer of dPAzo/PAH = 282 nm. Fig. 4 shows the oscillatory component of the transient reflection data. During the first 200 ps, the sound front bounces twice between the surface and the quartz interface, similar to the first 540 ps shown in Fig. 3(b) for the thicker PAzo layer. However, now due to the thinner sample, only about one full period of the TDBS modulation occurs between two reflections. After 200 ps, the strain front passes the polymer–quartz interface and the signal modulation period shortens. This is consistent with eqn (2) for the sound velocity νQ = 5.8 nm ps−1 and refractive index nQ of quartz. In fact, the strain created at the PAzo/air interface reaches the substrate already at t = (DAzo3/νpoly) = 82 ps, but until 200 ps the fast oscillations are masked by the stronger signal modulation due to reflections of the strain wave in the transducer. We have recorded such transient reflection spectra also for approximately ten times thinner transducers. This results in equivalent signals, where the dynamics in the transducer film are only visible in the first 20 ps.
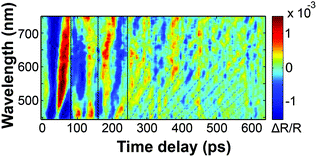 | ||
| Fig. 4 Oscillatory component of ΔR(t)/R0 for a 282 nm thin PAzo/PAH multilayers on quartz (sample structure 2). | ||
Calibration of transient strain by ultrafast X-ray diffraction (UXRD)
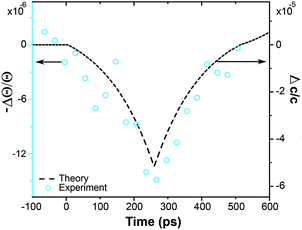
In order to calibrate the strain amplitude generated by the optical excitation of PAzo/PAH films we measured the strain after propagation into a crystalline medium, for which the lattice constant change can be measured in real time by ultrafast X-ray diffraction.39 We prepared a film with dPAzo/PAH = 880 nm onto the 4.5 μm thin mica substrate. Fig. 5 shows the detected shift of the Bragg angle Θ, from which the transient strain can be calculated via εobs(t) = Δc(t)/c = −ΔΘ × cot(Θ), where c is the out-of-plane lattice constant of mica. The maximum compression of mica is observed at t = 260 ps, when the expansion wave created at the surface has travelled completely through the transducer. At this time, the wave front has propagated around 1.3 μm into the substrate. Therefore, the average strain within the first micrometer is about four times larger than the measured strain since the remaining 3.2 μm of the mica film are unchanged from their initial lattice constant. Hence the strain pulse detected in mica has an amplitude of about ε = −5 × 10⁻⁵. This is consistent with the simulation40,41 of the strain in mica (dashed line in Fig. 5) based on a linear chain-model which we have previously tested against a large number of ultrafast X-ray diffraction experiments carried out on epitaxial metallic transducers.40,41 The agreement of the simulation with the measured data confirms that the hyper-sound-pulses created and propagating in these soft-matter materials can be well described by a linear chain model with the sound-velocity νpoly = 3.4 nm ps−1 characteristic of hyper-sound in polymers.From our model we predict that the corresponding expansion of the PAzo/PAH film at t = 260 ps measures ε = 5 × 10⁻⁴. The model simulates a linear chain of masses and springs, which are adjusted such, that the mass density and sound velocity of the materials are described correctly. The optical excitation is assumed to instantaneously generate a stress profile given by the absorption depth in the PAzo/PAH film. For calculating the strain in PAzo from the measured lattice deformation in mica, the model automatically takes into account three factors:39,40 (i) 60% of the compressive sound has been reflected at the PAzo/quartz interface due to the acoustic impedance mismatch. (ii) The static expansion of the photoexcited PAzo layer adds to the coherent sound wave. (iii) The strain in mica is reduced by ratio 5/3.4 of the sound velocities as the pulse is stretched.
It is difficult to compare the efficiency of strain transduction to conventional metal transducers, but we shall shortly discuss a comparison to aluminum (Al). In our PAzo transducers, nearly all incident photons can be absorbed and converted to stress. Al transducers reflect about 90% of the incident fluence. The remaining fluence would be absorbed in about 10 nm. If we assume the energy to be distributed by rapid heat transport over 100 nm, the calculated temperature rise for an incident fluence of 4 mJ cm−2 is about 15 K, yielding a strain amplitude of ε ∼ 3 × 10⁻⁴. This estimate is based on the specific heat and thermal expansion coefficient of Al. In fact, the strain level is very similar to the strain produced by the PAzo transducer. However, the two systems in fact have quite different properties. While the Al transducer would be more efficient for thinner transducers (high frequencies) as the energy density is higher due to the smaller penetration depth, the PAzo transducer can more easily be tuned to different frequencies, as the energy density varies only weakly for thicknesses between 20 and 500 nm. Moreover, the efficiency of sound transduction between Al and soft matter is significantly reduced by reflection according to the acoustic impedance mismatch.
Conclusions
In this paper, we have presented azobenzene containing polyelectrolyte multilayer films as transducers for picosecond ultrasonics, which is expected to boost the applicability of this method in soft materials and nanocomposites. The frequency spectrum of the generated strain can be tuned by the transducer thickness in the range of 1–100 GHz. We demonstrated the propagation of these nanoscale hyper-soundwaves through polyelectrolytes and their damping at nanometric metal inclusions. The good coupling efficiency of the hyper-sound pulses into various substrates demonstrates the potential for assembling nanometric hybrid devices. It also allowed us to quantify the strain amplitude of the hyper-sound waves by ultrafast X-ray diffraction to be up to ε = 5 × 10⁻⁴. This transient strain is accompanied by a tiny refractive index change of about Δn/n = 2.6 × 10⁻⁴, which can nonetheless be easily detected by a substantial transient shift of the thin-film interference pattern. This will allow for all-optical sensing of the transducer dynamics in future applications.Acknowledgements
We acknowledge financial support by the German Science Foundation DFG via the graduate school SALSA and by the Volkswagen Foundation via “Experiment!”.References
- O. Matsuda, M. C. Larciprete, R. Li Voti and O. B. Wright, Ultrasonics, 2015, 56, 3–20 CrossRef CAS PubMed.
- H. A. Navirian, D. Schick, P. Gaal, W. Leitenberger, R. Shayduk and M. Bargheer, Appl. Phys. Lett., 2014, 104, 21906 CrossRef.
- C. Thomsen, H. T. Grahn, H. J. Maris and J. Tauc, Phys. Rev. B: Condens. Matter, 1986, 34, 4129 CrossRef CAS.
- O. B. Wright, J. Appl. Phys., 1992, 71, 1617 CrossRef.
- J.-W. Kim, M. Vomir and J.-Y. Bigot, Phys. Rev. Lett., 2012, 109, 166601 CrossRef PubMed.
- T. Dehoux, M. Abi Ghanem, O. F. Zouani, J.-M. Rampnoux, Y. Guillet, S. Dilhaire, M.-C. Durrieu and B. Audoin, Sci. Rep., 2015, 5, 8650 CrossRef CAS PubMed.
- A. Gadalla, T. Dehoux and B. Audoin, Planta, 2014, 239, 1129–1137 CrossRef CAS PubMed.
- S. Danworaphong, M. Tomoda, Y. Matsumoto, O. Matsuda, T. Ohashi, H. Watanabe, M. Nagayama, K. Gohara, P. H. Otsuka and O. B. Wright, Appl. Phys. Lett., 2015, 106, 163701 CrossRef.
- C. Rossignol, N. Chigarev, M. Ducousso, B. Audoin, G. Forget, F. Guillemot and M. C. Durrieu, Appl. Phys. Lett., 2008, 93, 123901 CrossRef.
- G. Scarcelli and S. H. Yun, Opt. Express, 2012, 20, 9197–9202 CrossRef PubMed.
- A. S. Rury, S. Sorenson and J. M. Dawlaty, J. Chem. Phys., 2016, 144, 104701 CrossRef PubMed.
- P. Ruello and V. E. Gusev, Ultrasonics, 2015, 56, 21–35 CrossRef CAS PubMed.
- J. A. Rogers, A. A. Maznev, M. J. Banet and K. A. Nelson, Annu. Rev. Mater. Sci., 2000, 30, 117–157 CrossRef CAS.
- B.-Y. Choi, Phys. Rev. Lett., 2006, 96, 156106 CrossRef PubMed.
- Q. Ferreira, P. A. Ribeiro, O. N. Oliveira and M. Raposo, ACS Appl. Mater. Interfaces, 2012, 4, 1470–1477 Search PubMed.
- S. Pipolo, E. Benassi, G. Brancolini, M. Valášek, M. Mayor and S. Corni, Theor. Chem. Acc., 2012, 131, 1–14 Search PubMed.
- M. Quick, A. L. Dobryakov, M. Gerecke, C. Richter, F. Berndt, I. N. Ioffe, A. A. Granovsky, R. Mahrwald, N. P. Ernsting and S. A. Kovalenko, J. Phys. Chem. B, 2014, 118, 8756–8771 CrossRef CAS PubMed.
- T. Hugel, N. B. Holland, A. Cattani, L. Moroder, M. Seitz and H. E. Gaub, Science, 2002, 296, 1103–1106 CrossRef PubMed.
- N. Liu, D. R. Dunphy, P. Atanassov, S. D. Bunge, Z. Chen, G. P. López, T. J. Boyle and C. J. Brinker, Nano Lett., 2004, 4, 551–554 CrossRef CAS.
- A. S. Kumar, T. Ye, T. Takami, B.-C. Yu, A. K. Flatt, J. M. Tour and P. S. Weiss, Nano Lett., 2008, 8, 1644–1648 CrossRef CAS PubMed.
- T. Muraoka, K. Kinbara and T. Aida, Nature, 2006, 440, 512–515 CrossRef CAS PubMed.
- E. Merino and M. Ribagorda, Beilstein J. Org. Chem., 2012, 8, 1071–1090 CrossRef CAS PubMed.
- Y. Yu, M. Nakano and T. Ikeda, Nature, 2003, 425, 145 CrossRef CAS PubMed.
- J. Han, D. Yan, W. Shi, J. Ma, H. Yan, M. Wei, D. G. Evans and X. Duan, J. Phys. Chem. B, 2010, 114, 5678–5685 CrossRef CAS PubMed.
- O. M. Tanchak and C. J. Barrett, Macromolecules, 2005, 38, 10566–10570 CrossRef CAS.
- M. Kiel, M. Klötzer, S. Mitzscherling and M. Bargheer, Langmuir, 2012, 28, 4800–4804 CrossRef CAS PubMed.
- A. Bojahr, M. Herzog, S. Mitzscherling, L. Maerten, D. Schick, J. Goldshteyn, W. Leitenberger, R. Shayduk, P. Gaal and M. Bargheer, Opt. Express, 2013, 21, 21188–21197 CrossRef CAS PubMed.
- M. Kiel, S. Mitzscherling, W. Leitenberger, S. Santer, B. Tiersch, T. K. Sievers, H. Möhwald and M. Bargheer, Langmuir, 2010, 26, 18499–18502 CrossRef CAS PubMed.
- G. Decher and J. Schmitt, in Trends in Colloid and Interface Science VI, ed. C. Helm, M. Lösche and H. Möhwald, Steinkopff, 1992, pp. 160–164 Search PubMed.
- B. Nikoobakht and M. A. El-Sayed, Chem. Mater., 2003, 15, 1957–1962 CrossRef CAS.
- W. Ni, Z. Yang, H. Chen, L. Li and J. Wang, J. Am. Chem. Soc., 2008, 130, 6692–6693 CrossRef CAS PubMed.
- M. Kiel, H. Möhwald and M. Bargheer, Phys. Rev. B: Condens. Matter, 2011, 84, 165121 CrossRef.
- D. Schick, A. Bojahr, M. Herzog, C. von Korff Schmising, R. Shayduk, W. Leitenberger, P. Gaal and M. Bargheer, Rev. Sci. Instrum., 2012, 83, 25104 CrossRef CAS PubMed.
- F. Zamponi, Z. Ansari, C. v. Korff Schmising, P. Rothhardt, N. Zhavoronkov, M. Woerner, T. Elsaesser, M. Bargheer, T. Trobitzsch-Ryll and M. Haschke, Appl. Phys. A, 2009, 96, 51–58 CrossRef CAS.
- D. Schick, R. Shayduk, A. Bojahr, M. Herzog, C. von Korff Schmising, P. Gaal and M. Bargheer, J. Appl. Crystallogr., 2013, 46, 1372–1377 CrossRef CAS.
- K. Haberska and T. Ruzgas, Bioelectrochemistry, 2009, 76, 153–161 CrossRef CAS PubMed.
- C.-S. Zha, R. J. Hemley, H.-K. Mao, T. S. Duffy and C. Meade, Phys. Rev. B: Condens. Matter, 1994, 50, 13105–13112 CrossRef CAS.
- D. J. Cebula, Clay Miner., 1982, 17, 195–200 CrossRef CAS.
- D. Schick, M. Herzog, A. Bojahr, W. Leitenberger, A. Hertwig, R. Shayduk and M. Bargheer, Struct. Dyn., 2014, 1, 64501 CrossRef PubMed.
- D. Schick, A. Bojahr, M. Herzog, R. Shayduk, C. von Korff Schmising and M. Bargheer, Comput. Phys. Commun., 2014, 185, 651–660 CrossRef CAS.
- M. Herzog, D. Schick, P. Gaal, R. Shayduk, C. V. K. Schmising and M. Bargheer, Appl. Phys. A, 2012, 106, 489–499 CrossRef CAS.
| This journal is © The Royal Society of Chemistry 2016 |

