 Open Access Article
Low-coordinated surface atoms of CuPt alloy cocatalysts on TiO2 for enhanced photocatalytic conversion of CO2†
Sooho
Lee
a,
Sunil
Jeong
a,
Whi Dong
Kim
a,
Seokwon
Lee
a,
Kangha
Lee
a,
Wan Ki
Bae
 b,
Jun Hyuk
Moon
c,
Sangheon
Lee
*d and
Doh C.
Lee
*a
aDepartment of Chemical and Biomolecular Engineering (BK21+ Program), KAIST Institute for the Nanocentury, Korea Advanced Institute of Science and Technology (KAIST), Daejeon 34141, Korea. E-mail: dclee@kaist.edu
bPhoto-Electronic Hybrids Research Center, Korea Institute of Science and Technology (KIST), 14-gil 5, Hwarang ro, Seongbuk-gu, Seoul 136-791, Korea
cDepartment of Chemical Biomolecular Engineering, Sogang University, Seoul 04107, Korea
dDepartment of Chemical Engineering and Materials Science, Ewha Womans University, Seoul 03760, Korea
First published on 21st April 2016
Abstract
We report the photocatalytic conversion of CO2 to CH4 using CuPt alloy nanoclusters anchored on TiO2. As the size of CuPt alloy nanoclusters decreases, the photocatalytic activity improves significantly. Small CuPt nanoclusters strongly bind CO2 intermediates and have a stronger interaction with the TiO2 support, which also contributes to an increased CH4 generation rate. The alloying and size effects prove to be the key to efficient CO2 reduction, highlighting a strategic platform for the design of photocatalysts for CO2 conversion.
The ever-increasing level of atmospheric CO2 concentration has driven the search for sustainable conversion of CO2 to hydrocarbons.1,2 One way to mitigate CO2 emission is chemical reduction of CO2 molecules to hydrocarbons (e.g., methane, methanol, or formic acid) via photocatalysis. In this thrust, the architecture of heterostructure photocatalysts has been a subject of intensive research, as the structure relates to photocatalytic efficiency and selectivity by affecting separation of photogenerated charge carriers and active surface sites.3 Of particular significance is the use of metal cocatalysts, which are used to lower the activation energy for the CO2 conversion, as the reduction of CO2 to CO2˙− requires a high redox potential of CO2/CO2˙− (−1.9 V vs. NHE).4 The existence of metal cocatalysts also helps inhibit the recombination of electron–hole pairs in photocatalysts and enables the photo-generated charges to migrate to the surface for catalytic reactions.5 In addition, metal particles allow CO2 and reduction intermediates to adsorb more strongly on the photocatalyst surface.6–9 For example, Pt and Cu on TiO2 showed an increased efficiency of CO2 conversion due to their roles in promoting charge separation and surface reaction.10,11
Recent studies have demonstrated that the binding energy of CO2 to metal cocatalysts is directly relevant to the CO2 conversion efficiency.12–14 A catalyst surface with weak binding to COOH or CO results in increased production of CO by allowing the intermediates to desorb from the surface. In contrast, the catalyst surface that can bind strongly to intermediates accommodates and even promotes the protonation of CO into CH4.13 A recent theoretical study revealed that the binding strength of the intermediates can be controlled by tuning the size of metal cocatalysts.15 Also, experimental studies have shown that the use of smaller cocatalysts leads to a higher rate of electrochemical CO2 conversion, since smaller metal cocatalyst particles have a large population of low-coordinated surface atoms, which result in a stronger adsorption of COOH and CO.16,17 In the size range of 1–2 nm, metals such as Cu, Au, and Ag have a large fraction of edge or corner sites that show a stronger binding strength, giving rise to a lower Gibbs free energy change for the formation of COOH*, a key intermediate species for CO2 conversion.14
While the theoretical studies and experimental results have demonstrated the size effect of metals on electrochemical CO2 conversion into CO, the attention for photocatalytic CO2 conversion has been expanded toward the formation of hydrocarbons, which results from the protonation of intermediate species. In photocatalytic conversion of CO2, stronger binding of intermediates to the metal cocatalyst surface would allow photo-generated electrons to migrate to the intermediates such as COOH* and CO*.16,17 CO molecules strongly adsorbed on metal cocatalysts can be ultimately converted to CH4 if the adsorbates undergo sequential protonation. To efficiently couple the adsorbed CO with protons, it is necessary to design photocatalysts for the intermediates and protons to be adsorbed in close vicinity.18 In an example of electrocatalysis, Guo et al. prepared CuPt nanocrystals as a catalyst, the composition of which influences the activity of CO2 electrochemical reduction: Pt surface atoms in the proximity of Cu surface atoms help increase the CH4 formation rate.19
Functional groups on a semiconductor surface also alter the interactions between the semiconductor and adsorbates.13 For example, it was shown that hydroxyl groups on the surface of mesoporous TiO2 nanofibers help adsorb CO2 on the surface of semiconductors.20 The surface functional group on semiconductors can also lead to a stronger interaction of CO2 with small metal cocatalysts. A theoretical study revealed that hydroxyl groups enable co-adsorption of CO2 onto a metal cocatalyst and a support, which are held accountable for facilitated CO2 conversion.21
In this study, we used CuPt alloy nanoclusters supported on TiO2 to study photocatalytic CO2 reduction under a 150 W Xe lamp, whose spectrum is shown in Fig. S1.† We controlled the size of metal particles on TiO2 by changing the amount of precursors and compared the production rates of CH4 with respect to the size of CuPt nanoparticles. We relate the photocatalytic activity with the surface binding energy and interaction with the TiO2 support. The effect of the CuPt alloy on CO2 conversion was investigated experimentally in reference to single-element metals, i.e., Cu and Pt. Based on this observation, we propose a mechanism by which CO2 molecules on the surface of CuPt–TiO2 are protonated to CH4.
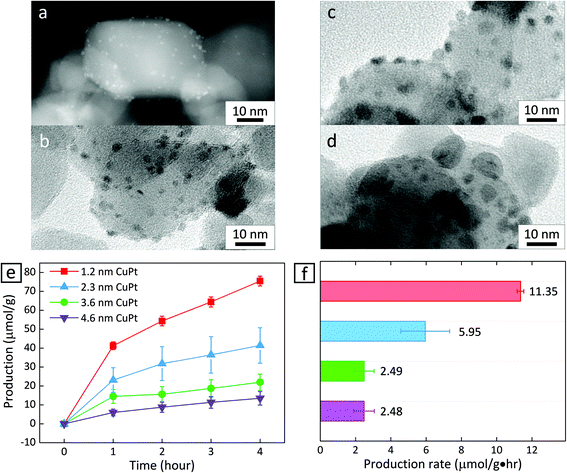
We prepared CuPt alloy nanoclusters deposited on TiO2 by calcining TiO2 powder decorated with H2PtCl6 and Cu(NO3)2.22 First, the Pt and Cu precursors were mixed with TiO2 powder in water, and heated to 373 K under stirring. After the mixture dried completely, the resulting powder was placed into a tube furnace and calcined in air at 673 K for 2 h and under H2 gas at 673 K for another 2 h. The size of the CuPt clusters could be controlled by introducing different amounts of Cu and Pt precursors in a DI water mixture with TiO2 powder. Fig. 1a–d show that nanoclusters of different average sizes appear to be anchored on the surface of TiO2 nanoparticles. Statistical analysis reveals that the size is relatively uniform in all of the cases (1.2 ± 0.2 nm, 2.3 ± 0.5 nm, 3.6 ± 0.7 nm, and 4.6 ± 2.1 nm) (Fig. S2–S5†).
Fig. 1e shows the amount of CH4 produced as a function of irradiation time when CuPt–TiO2 is used as a photocatalyst. To identify that CH4 is produced from CO2 and light, control experiments were performed in the absence of CuPt–TiO2 under light illumination or in the presence of CuPt–TiO2, heating to 333 K without illumination. It turned out that no CH4 or CO was detected from the control experiments. At all CuPt sizes, the first hour of the photocatalytic reaction yields CH4 at a relatively higher rate, while the adsorption of reactants and desorption of products appear to reach equilibrium after 1 h. Therefore, we estimated the photocatalytic CH4 generation rate based on the data obtained after 1 h. As summarized in Fig. 1f, CuPt–TiO2 photocatalysts show drastically different CH4 production rates at an altering size of CuPt nanoparticles. CH4 was nearly a sole product of the photocatalytic conversion, as other possible products, e.g., CO, HCOOH, and CH3OH, were not detected within the equipment limit of 6 nmol. In addition, the CH4 production rate is similar between the cases of 3.6 nm and 4.6 nm CuPt–TiO2. It has been reported that cocatalysts larger than 3 nm exhibit adsorption characteristics similar to the bulk.15,23 As the size of the metal increases, adsorbates do not affect the charge density. Therefore, we carried out a simple comparative study based on 1.2 nm and 3.6 nm CuPt–TiO2 to clarify the metal size effects.
Decreasing the size of metal particles deposited on TiO2 led to increased activity. For example, the production rate of CH4 in the case of 1.2 nm CuPt–TiO2 was 4.5 times higher than that of 3.6 nm CuPt–TiO2 (Fig. 1f). We speculate that the higher generation rate of CH4 from smaller CuPt deposited on TiO2 relates to the following factors: (i) an increase in low-coordinated sites that bind reactants strongly and (ii) an enhanced interaction between CuPt metal cocatalysts and the TiO2 support. 3.6 nm CuPt–TiO2 has an overall CuPt surface area 4.5 times larger than 1.2 nm CuPt–TiO2 because the number of 1.2 nm CuPt nanoclusters formed on TiO2 particles is approximately double the number of 3.6 nm CuPt nanoparticles.15,24 From the estimation of the surface area, we conclude that 1.2 nm CuPt nanoclusters show even higher activity on a per-atom basis. A large population of low-coordinated sites active for CO2 conversion at small metal cocatalysts would enable strong binding of CO2 and CO2 intermediates, e.g., COOH and CHO.14,15 Similarly, we observed that CO2 intermediates have a lower thermodynamic free energy on CuPt(211) edge sites than that on CuPt(111) sites (Fig. S8†). The stabilization of the intermediates by strong adsorption on the edge sites of small CuPt nanoclusters would enable multi-electron transfer for the conversion of CO2 into CH4 requiring 8 electrons with the corresponding number of proton transfer. Therefore, a combination of the experimental and computational results suggests that low-coordinated surface atoms of smaller CuPt nanoclusters enable a higher production of CH4. Besides, it is observed that Pt atoms of smaller CuPt nanoclusters allow for the stronger adsorption of protons (Fig. S8†). The protons adsorbed on the surface are likely to proceed hydrogenation of CO2 intermediates further and finally induce higher CH4 production.10
In addition to a high surface-to-volume ratio in small CuPt nanoclusters, the higher activity for CH4 production from 1.2 nm CuPt on TiO2 can be explained based on the interaction of the cocatalysts with a support.21 We conducted X-ray photoelectron spectroscopy (XPS) on 1.2 nm and 3.6 nm CuPt–TiO2 before and after photocatalytic conversion of CO2 to identify a change in the electronic structure of surface atoms. We noted that the O 1s peak obtained from TiOH decreased by 95% in 1.2 nm CuPt–TiO2 after the photocatalytic reaction while that from 3.6 nm CuPt–TiO2 decreased by 70% (Fig. 2 and Fig. S9†). The consumption of the hydroxyl group is related to the improvement in CH4 production because the formation of COOH is facilitated by hydrogen bonding with adsorbed CO2 molecules.20 To confirm that hydroxyls on the TiO2 surface indeed help the adsorption of CO2 intermediates and enhance the activity for CH4 production, we tested photocatalytic CO2 conversion at a varying coverage of hydroxyl groups on TiO2. As shown in Fig. S10,† more CH4 was produced due to interaction with the TiO2 support. We speculate that CO2 adsorbed on the surface of CuPt nanoclusters interacts with TiOH via the co-adsorption mechanism.21 The co-adsorption is more active by 25% between 1.2 nm CuPt metal cocatalysts and the TiO2 support as the average cluster heights become low with a decrease of metal size.25 Moreover, composites with a smaller size of CuPt could have more reductive power due to the more quantized energy level.26 CuPt–TiO2 composites undergo Fermi level equilibration under light illumination. In this process, smaller nanoclusters induce a shift of the Fermi level to more negative potential than large nanoparticles. Therefore, composites of smaller CuPt nanoclusters with TiO2 would convert CO2 into CH4 more photocatalytically.
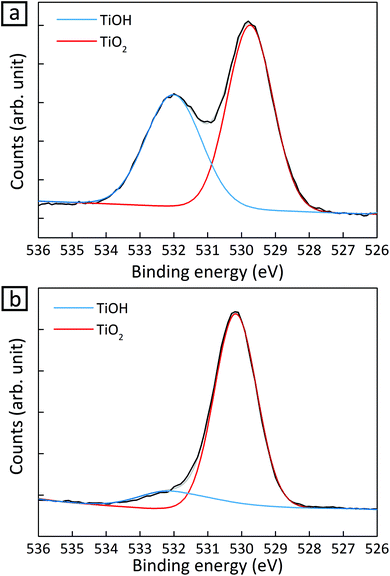 | ||
| Fig. 2 O 1s signal of XPS spectra for 1.2 nm CuPt–TiO2 (a) before and (b) 4 h after the photocatalytic reaction. | ||
The formation of bimetallic alloys in our CuPt nanoclusters was confirmed by TEM, XPS and ultraviolet photoelectron spectroscopy (UPS) analysis. The TEM image in Fig. S3b† shows that the d-spacing of CuPt(100) is 2.03 Å, which is between standard Cu(100) (JCPDS 04-0836, 0.904 Å) and Pt(100) (JCPDS 04-0802, 3.92 Å). The d-spacing is in agreement with the value calculated by Vegard's law. The energy dispersive X-ray (EDX) elemental mapping image also shows that Cu and Pt elements exist in a nanoparticle (Fig. S6†), suggesting that separate Cu and Pt particles are not formed on TiO2.
In Cu 2p and Pt 4f spectra of XPS, peak shifts in 1.2 nm CuPt–TiO2 were monitored in reference to single-element Cu or Pt deposited on TiO2, respectively (Fig. 3). The core-level shift occurs upon alloying as a result of the change of electron density in d-band states. Therefore, the binding energy shifts reflect the degree of alloying between Cu and Pt.27,28 On one hand, the Cu 2p3/2 peak of CuPt–TiO2 red-shifted by about 0.4 eV in reference to that of Cu–TiO2 because of suppressed p–d hybridization due to interaction of Cu 2p electrons with wide d-band electrons in Pt.29 On the other hand, the shift in the Pt 4f7/2 peak occurs only by 0.02 eV because Cu does not affect the electron density in Pt 5d states.30 These experimental values are in agreement with the theoretical results obtained by Olovsson et al. (Table 1).31 UPS analysis also corroborates the formation of CuPt alloy. Estimated work functions of Cu–, Pt– and CuPt–TiO2 were 5.93, 6.45 and 6.10 eV, respectively (Fig. S11†).22 The work function of CuPt alloy can be expressed as follows:
| WCuPt = (1 − z) × WPt + z × WCu | (1) |
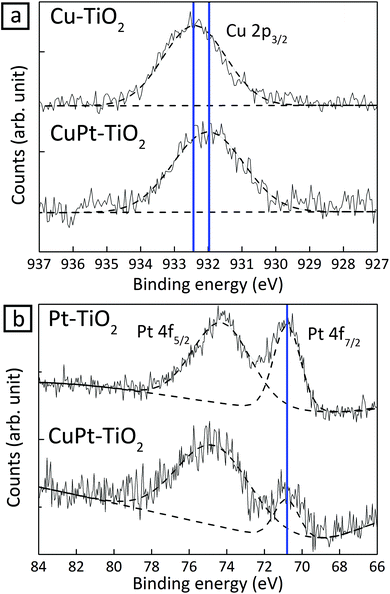 | ||
| Fig. 3 XPS spectra of 1.2 nm CuPt–TiO2 in reference to Cu–TiO2 and Pt–TiO2 samples. (a) Cu 2p peaks and (b) Pt 4f peaks in XPS spectra. | ||
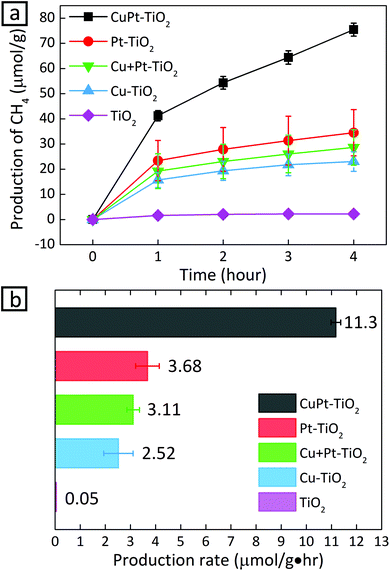
Now that we confirm the alloy formation between Cu and Pt, the question is whether this alloying indeed influences the photocatalytic activity of CO2 conversion. Fig. 4 shows photocatalytic conversion of CO2 using different metals loaded on TiO2. In the cases where metal cocatalysts were deposited on TiO2, the production rate of CH4 increased significantly compared to the case when no metal cocatalysts were anchored on TiO2. The increase can be explained by the fact that metal clusters draw photo-generated electrons and provide active catalytic sites.4,32,33 Although Cu is known as an active cocatalyst for CO2 conversion, Cu–TiO2 shows a lower production rate than Pt–TiO2. The lower CH4 production rate from Cu–TiO2 results from the production of other CO2 conversion products.13,34 CO2 hydrogenation is much less active despite the stronger adsorption of CO2 on Cu than Pt: on Cu, CO2 molecules are reduced to form CO molecules, which desorb from the surface before being protonated. In fact, CO was detected in the case of Cu–TiO2 (23.8 μmol g−1 h−1), while the other photocatalyst samples did not yield a detectable amount of CO (Fig. S12†). In the case of Pt–TiO2, the supply of protons by Pt surface atoms facilitates the hydrogenation of CO intermediates ultimately into CH4, reducing CO production significantly.10,35
We also carried out photocatalysis using a mixture of Cu–TiO2 and Pt–TiO2, in which Cu and Pt are considered to serve as active sites to CO2 and proton adsorption, respectively. In this case, the CH4 production rate is 3.6 times lower than that from CuPt alloy nanoclusters on TiO2. The production rate from the mixture of Cu–TiO2 and Pt–TiO2 has a value between those of Cu–TiO2 and Pt–TiO2. The accessibility of protons to the intermediates of CO2 is lower because proton and the intermediate species would stay adsorbed on separate photocatalyst particles.18
To gain further insight for photocatalytic CO2 reduction from CuPt–TiO2, we performed Fourier-transform infrared (FT-IR) analysis after photo-reactions. First, the spectrum of the samples after the photocatalytic reaction for 4 h under Ar shows no peaks indexed to the intermediates of CO2. In contrast, 1.2 nm CuPt–TiO2 samples under CO2 showed the C–H stretch bands at 2857 and 2927 cm−1 after photocatalysis for 4 h (Fig. S13†).36,37 The bands reflect the presence of CH2O or CH3O, intermediate species of CH4 generation. From these analyses, we propose a mechanism of CO2 conversion on small CuPt–TiO2. First, CO2 is activated on low-coordinated edge sites of 1.2 nm CuPt that induces stronger binding than 3.6 nm CuPt. The bended CO2 molecules undergo reduction steps, forming COOH and CHO in order through consecutive electron and proton transfer. In particular, the CO2 intermediates adsorbed on 1.2 nm CuPt nanoclusters underwent more active interaction with the hydroxyl group of TiO2, forming hydrocarbon intermediates. The CHO intermediates are converted into CHnO (n = 2, 3) through protonation processes by the alloying effect of Pt, and CH4 would be finally produced.21Fig. 5 summarizes the process in which CO2 is photocatalytically converted to CH4 on CuPt alloy nanoclusters deposited on TiO2.
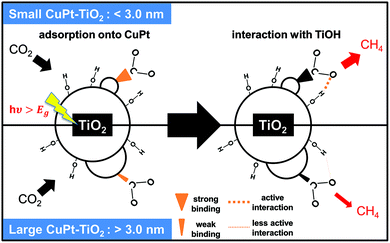 | ||
| Fig. 5 Illustration of the CO2 conversion mechanism on small and large CuPt nanoclusters on TiO2. Small CuPt adsorbs CO2 more strongly and interacts with TiO2 more actively than large CuPt. | ||
Conclusions
Photocatalysts based on CuPt alloy nanoclusters on TiO2 exhibit high photocatalytic conversion of CO2 into CH4 compared to Cu and Pt single-element nanoclusters on TiO2. Cu atoms strongly bind CO2 molecules and provide sites for photo-generated electrons reacting with CO2. The alloying of Pt into Cu particles gives rise to efficient production of CH4 because of an improvement in the protonation of CO intermediates by Pt surface atoms and lower free energy barriers for intermediates. As a result of the distinctive roles of Cu and Pt, a change in the structure of the CuPt alloy at a varying size of metal influences the photocatalytic activity for CH4. Smaller nanoclusters have a larger population of low-coordinated edge atoms that can strongly adsorb CO2, enabling multi-electron transfer onto CO2. In addition, small nanoclusters have a stronger interaction with the surface of the TiO2 support. This strong metal–support interaction facilitates the formation of COOH, which enhances the photocatalytic CO2 conversion efficiency.38–40CO2 molecules need to bind strongly to the photocatalyst surface for efficient conversion of CO2 into CH4.41,42 A structural change (e.g., size and alloying) can induce an increase in the binding energy, allowing electrons to migrate onto adsorbed CO2 and ultimately permitting conversion of CO2 to beat the competition against desorption. The next step to enhance the efficiency would be to use visible-active photo-sensitizers for light harvesting. In this regard, a better understanding of a change in binding energy for CO2 with varying metal size is instrumental in the design of photocatalysts for high-activity and high-selectivity CO2 reduction.
Acknowledgements
This work was supported by the National Research Foundation (NRF) grants funded by the Korean government (no. NRF-2013R1A6A3A04059268, NRF-2011-0030256 and NRF-2014R1A2A2A01006739), the New & Renewable Energy Core Technology Program of the Korea Institute of Energy Technology Evaluation and Planning (KETEP) granted financial resource from the Ministry of Trade, Industry & Energy in Korea (no. 20133030011330 and 20133010011750), and the Agency for Defense Development of Korea (Grant No. 13-70-05-04). This work was also funded by the Saudi Aramco-KAIST CO2 Management Center. W. K. B. acknowledges financial support by Korea Evaluation Institute of Industrial Technology (KEIT, 2MR3600).References
- K. Maeda, K. Sekizawa and O. Ishitani, Chem. Commun., 2013, 49, 10127–10129 RSC.
- X. Y. Zhao, B. B. Luo, R. Long, C. M. Wang and Y. J. Xiong, J. Mater. Chem. A, 2015, 3, 4134–4138 CAS.
- S. Lee, C. Y. Yun, M. S. Hahn, J. Lee and J. Yi, Korean J. Chem. Eng., 2008, 25, 892–896 CrossRef CAS.
- J. Mao, K. Li and T. Y. Peng, Catal. Sci. Technol., 2013, 3, 2481–2498 CAS.
- J. H. Yang, D. G. Wang, H. X. Han and C. Li, Acc. Chem. Res., 2013, 46, 1900–1909 CrossRef CAS PubMed.
- D. F. Gao, H. Zhou, J. Wang, S. Miao, F. Yang, G. X. Wang, J. G. Wang and X. H. Bao, J. Am. Chem. Soc., 2015, 137, 4288–4291 CrossRef CAS PubMed.
- I. Shown, H. C. Hsu, Y. C. Chang, C. H. Lin, P. K. Roy, A. Ganguly, C. H. Wang, J. K. Chang, C. I. Wu, L. C. Chen and K. H. Chen, Nano Lett., 2014, 14, 6097–6103 CrossRef CAS PubMed.
- S. J. Xie, Y. Wang, Q. H. Zhang, W. Q. Fan, W. P. Deng and Y. Wang, Chem. Commun., 2013, 49, 2451–2453 RSC.
- V. P. Indrakanti, J. D. Kubicki and H. H. Schobert, Energy Environ. Sci., 2009, 2, 745–758 CAS.
- W. N. Wang, W. J. An, B. Ramalingam, S. Mukherjee, D. M. Niedzwiedzki, S. Gangopadhyay and P. Biswas, J. Am. Chem. Soc., 2012, 134, 11276–11281 CrossRef CAS PubMed.
- Y. Li, W. N. Wang, Z. L. Zhan, M. H. Woo, C. Y. Wu and P. Biswas, Appl. Catal., B, 2010, 100, 386–392 CrossRef CAS.
- C. Shi, H. A. Hansen, A. C. Lausche and J. K. Norskov, Phys. Chem. Chem. Phys., 2014, 16, 4720–4727 RSC.
- D. Kim, J. Resasco, Y. Yu, A. M. Asiri and P. D. Yang, Nat. Commun., 2014, 5, 4948 CrossRef CAS PubMed.
- A. A. Peterson and J. K. Norskov, J. Phys. Chem. Lett., 2012, 3, 251–258 CrossRef CAS.
- S. Back, M. S. Yeom and Y. Jung, ACS Catal., 2015, 5, 5089–5096 CrossRef CAS.
- R. Reske, H. Mistry, F. Behafarid, B. R. Cuenya and P. Strasser, J. Am. Chem. Soc., 2014, 136, 6978–6986 CrossRef CAS PubMed.
- H. Mistry, R. Reske, Z. H. Zeng, Z. J. Zhao, J. Greeley, P. Strasser and B. R. Cuenya, J. Am. Chem. Soc., 2014, 136, 16473–16476 CrossRef CAS PubMed.
- Y. Nakibli, P. Kalisman and L. Amirav, J. Phys. Chem. Lett., 2015, 6, 2265–2268 CrossRef CAS PubMed.
- X. Guo, Y. X. Zhang, C. Deng, X. Y. Li, Y. F. Xue, Y. M. Yan and K. N. Sun, Chem. Commun., 2015, 51, 1345–1348 RSC.
- J. W. Fu, S. W. Cao, J. G. Yu, J. X. Low and Y. P. Lei, Dalton Trans., 2014, 43, 9158–9165 RSC.
- J. Graciani, K. Mudiyanselage, F. Xu, A. E. Baber, J. Evans, S. D. Senanayake, D. J. Stacchiola, P. Liu, J. Hrbek, J. F. Sanz and J. A. Rodriguez, Science, 2014, 345, 546–550 CrossRef CAS PubMed.
- Y. Shiraishi, H. Sakamoto, Y. Sugano, S. Ichikawa and T. Hirai, ACS Nano, 2013, 7, 9287–9297 CrossRef CAS PubMed.
- J. Kleis, J. Greeley, N. A. Romero, V. A. Morozov, H. Falsig, A. H. Larsen, J. Lu, J. J. Mortensen, M. Dulak, K. S. Thygesen, J. K. Norskov and K. W. Jacobsen, Catal. Lett., 2011, 141, 1067–1071 CrossRef CAS.
- W. L. Zhu, R. Michalsky, O. Metin, H. F. Lv, S. J. Guo, C. J. Wright, X. L. Sun, A. A. Peterson and S. H. Sun, J. Am. Chem. Soc., 2013, 135, 16833–16836 CrossRef CAS PubMed.
- Y. Watanabe, X. Wu, H. Hiratac and N. Isomuraa, Catal. Sci. Technol., 2011, 1, 1490–1495 CAS.
- V. Subramanian, E. E. Wolf and P. V. Kamat, J. Am. Chem. Soc., 2004, 126, 4943–4950 CrossRef CAS PubMed.
- M. Wakisaka, S. Mitsui, Y. Hirose, K. Kawashima, H. Uchida and M. Watanabe, J. Phys. Chem. B, 2006, 110, 23489–23496 CrossRef CAS PubMed.
- G. G. Kleiman, V. S. Sundaram, J. D. Rogers and M. B. de Moraes, Phys. Rev. B: Condens. Matter, 1981, 23, 3177–3185 CrossRef CAS.
- G. G. Kleiman, V. S. Sundaram, C. L. Barreto and J. D. Rogers, Solid State Commun., 1979, 32, 919–923 CrossRef CAS.
- Y. S. Lee, K. Y. Lim, Y. D. Chung, C. N. Whang and Y. Jeon, Surf. Interface Anal., 2000, 30, 475–478 CrossRef CAS.
- W. Olovsson, C. Goransson, T. Marten and I. A. Abrikosov, Phys. Status Solidi B, 2006, 243, 2447–2464 CrossRef CAS.
- J. U. Bang, S. J. Lee, J. S. Jang, W. Choi and H. Song, J. Phys. Chem. Lett., 2012, 3, 3781–3785 CrossRef CAS PubMed.
- W. D. Kim, S. Lee, C. Pak, J. Y. Woo, K. Lee, F. Baum, J. Won and D. C. Lee, Chem. Commun., 2014, 50, 1719–1721 RSC.
- E. V. Kondratenko, G. Mul, J. Baltrusaitis, G. O. Larrazabal and J. Perez-Ramirez, Energy Environ. Sci., 2013, 6, 3112–3135 CAS.
- K. F. Li, X. Q. An, K. H. Park, M. Khraisheh and J. W. Tang, Catal. Today, 2014, 224, 3–12 CrossRef CAS.
- Z. A. Tan, W. Q. Zhang, Z. G. Zhang, D. P. Qian, Y. Huang, J. H. Hou and Y. F. Li, Adv. Mater., 2012, 24, 1476–1481 CrossRef CAS PubMed.
- A. S. Poyraz, S. Biswas, H. C. Genuino, S. Dharmarathna, C. H. Kuo and S. L. Suib, ChemCatChem, 2013, 5, 920–930 CrossRef CAS.
- L. Fan and K. Fujimoto, J. Catal., 1994, 150, 217–220 CrossRef CAS.
- L. P. Matte, A. S. Kilian, L. Luza, M. C. M. Alves, J. Morais, D. L. Baptista, J. Dupont and F. Bernardi, J. Phys. Chem. C, 2015, 119, 26459–26470 CAS.
- S. Jeong, W. D. Kim, S. Lee, K. Lee, S. Lee, D. Lee and D. C. Lee, ChemCatChem, 2016 DOI:10.1002/cctc.201600099.
- F. C. Wang, C. H. Liu, C. W. Liu, J. H. Chao and C. H. Lin, J. Phys. Chem. C, 2009, 113, 13832–13840 CAS.
- S. N. Habisreutinger, L. Schmidt-Mende and J. K. Stolarczyk, Angew. Chem., Int. Ed., 2013, 52, 7372–7408 CrossRef CAS PubMed.
Footnote |
| † Electronic supplementary information (ESI) available. See DOI: 10.1039/c6nr02124g |
| This journal is © The Royal Society of Chemistry 2016 |

