 Open Access Article
Creative Commons Attribution 3.0 Unported Licence
Sintering-resistant Pt@CeO2 nanoparticles for high-temperature oxidation catalysis†
Siwon
Lee
,
Jongsu
Seo
and
WooChul
Jung
*
Department of Materials Science and Engineering, Korea Advanced Institute of Science and Technology (KAIST), 291 Daehak-ro, Yuseong-gu, Daejeon, 305-701, Republic of Korea. E-mail: wcjung@kaist.ac.kr; Tel: +82-42-350-3314
First published on 13th April 2016
Abstract
The key challenge that has limited the industrial utilization of nano-sized metal catalysts is their poor thermal stability and the resulting performance degradation. Here, we address this issue by designing a post-encapsulated composite structure in which individual Pt nanoparticles are surrounded by gas-permeable and catalytically active CeO2 shells. Positively charged surfactants on the nanoparticle surfaces are exploited to adsorb negatively charged Ce precursor complexes spontaneously, followed by confined precipitation to form cerium dioxide. This strategy enables the creation of uniformly coated shell structures with tunable thicknesses between 2.9 and 26.5 nm, thereby enabling the investigation of how thickness affects the thermal stability and chemical reactivity of the composite particles. Enhanced metal–support interactions significantly prevent Pt agglomeration, leading to exceptionally high reactivity for methane combustion. With a shell thickness of 13.8 nm, we observe a T10 lower by more than 100 °C with an eight-fold higher reaction rate when compared with a bare mixture of Pt and CeO2 nanoparticles. Furthermore, their cores remain isolated even after heating them to 1000 °C, while complete methane oxidation was maintained for more than 50 hours at 700 °C. These results provide improved guidelines toward the design of a sintering-resistant, high-performance catalyst for use at elevated temperatures.
1. Introduction
Nano-sized metal particles have been widely studied in the field of catalysis due to their high surface-to-volume ratios and possibly unique catalytic properties. Particularly when dispersed on oxide supports, their catalytic activities are greatly enhanced compared to those of pure metal particles.1,2 However, metal particles of a small size are usually apt to sinter and grow into larger crystallites upon high-temperature annealing, leading to a severe loss of their catalytic activities.3–6 Such poor thermal stability of nanoparticles significantly limits their use only to low temperature conditions, while many industrial catalytic processes, such as automotive emission control, catalytic combustion, hydrocarbon reforming and electrocatalytic reactions, run at elevated temperatures (>500 °C).7,8 Over the past few decades, there have been many attempts to develop thermally stable metal catalysts.8–12 One approach to mitigate particle growth involves alloying using metals with higher melting points. By varying the chemical composition and atomic arrangements in bimetallic particles, the sintering behaviours have often been suppressed.8 However, de-alloying phenomena can occur, causing metal particles to become agglomerated. Moreover, this strategy limits the range of available chemical compositions and therefore their activity and/or selectivity. Alternatively, metal particles can be prevented from growing when they are physically shielded by ordered mesoporous oxide structures such as silica SBA-15 and MCM-41.9,13 However, commonly used mesoporous templates are basically fragile with a limited range of available shell thicknesses (0.6–1.85 nm).14,15 Moreover, the inherent interconnectivity between pores often serves as a sintering pathway for metal nanoparticles.In this contribution, we address these issues through the application of a post-encapsulated composite structure in which individual metal nanoparticles are surrounded by gas-permeable and catalytically active oxide shells. This geometry, in combination with rationally selected materials, enables us to achieve both excellent sintering resistance and catalytic performance. There are numerous reports in the literature regarding the post-encapsulation of metal nanoparticles in porous inorganic shells in what are known as core–shells. Most of these studies, however, focused on the development of synthetic methodologies, particularly with thermally stable oxides, but inert to catalytic reactions such as those with SiO2, ZrO2, and Al2O3.10,11,16 In light of the fact that metal cores are three-dimensionally encapsulated by porous oxide shells with an exceptionally high metal–support interface area, one can expect significantly enhanced catalytic properties when the oxide shells serve as a catalytic partner. Here, we choose a supported heterogeneous material system composed of platinum (Pt) and cerium dioxide (CeO2, ceria). In addition to its utmost practical importance, the remarkable features of the Pt/CeO2 system make it suitable for a sintering-resistant catalyst. Pt has excellent thermal durability with a higher melting temperature of 1768 °C, compared to other metals such as Ni, Co, Fe, Cu, Ag, Au, and Pd. In addition, Pt is one of the most surface-reactive materials, and it is also widely used for a variety of chemical and electrochemical catalysts.17–22 On the other hand, ceria is an active support material with a great deal of catalytic activity itself resulting from its unusual surface redox chemistry in combination with a high oxygen vacancy concentration.23–26 Furthermore, it has exceptional crystallographic stability over a wide range of oxygen activity and temperature levels, with a melting temperature of 2400 °C. More importantly, the combination of Pt and CeO2 is known to show unusual synergistic effects in terms of both catalytic activity and thermal stability. For example, Vayssilov et al. recently reported that when nano-sized ceria co-exists with Pt nanoparticles, the ceria encourages oxygen migration to the Pt NPs, giving rise to strongly enhanced catalytic activity.27 Cargnello et al. also found that ceria-based group VIII metal nanoclusters can greatly enhance the rate of carbon monoxide oxidation at ceria–metal interface sites.28 Shinjoh et al. showed that Pt NPs on ceria-based oxides form robust Pt–O–Ce bonds, serving as an anchor and thereby significantly hindering the agglomeration of Pt NPs at 800 °C compared to those on alumina.12 Despite the promising suitability of the combination of Pt and CeO2, limited studies have been reported on what are termed Pt@CeO2 core–shells.29–35 Moreover, existing studies of Pt@CeO2 core–shell nanocomposites did not precisely control the core–shell morphologies, even showing a lack of uniformity due to technical constraints. To the best of our knowledge, no study has controlled the shell geometries of Pt@CeO2 nanoparticles and simultaneously investigated their impacts on both long-term thermal stability (>50 hours) as well as catalytic activity toward high-temperature gas reactions (>700 °C), both of which are prerequisites for technical applications.
In this work, we prepare Pt nanoparticles covered with a positively charged surfactant, (1-tetradecyl)trimethylammonium bromide (TTAB), and then mix them with negatively charged [ethylenediaminetetraacetic acid (EDTA)–Ce(III)] complex ions, thereby successfully synthesizing Pt@CeO2 core–shell nanostructures with a remarkably uniform size of the Pt cores and elaborately controlled thicknesses of the ceria shells. This synthetic strategy using the electrostatic interaction between metal particles and Ce precursor complex ions has recently been reported by Li et al., when they prepared Au@CeO2 core–shell particles for photocatalysis.36 High-resolution electron microscopy and other characterization methods reveal that individual Pt nanoparticles are distantly encapsulated by ceria shells with a controllable shell thickness between 2.9 and 26.5 nm. The influence of the shell thickness on both the thermal stability and the catalytic performance for methane oxidation of the composite catalyst was systematically investigated in a wide range of temperatures (450 °C–1000 °C). We observe that the Pt cores remain isolated when the shell is sufficiently thick (>19.8 nm), even after heating them to 1000 °C. Furthermore, enhanced metal–support interactions lead to exceptionally high methane oxidation reactivity levels. For particles with a 13.8 nm-thick shell, we show a T10 lower by 100 °C and an eight-fold higher reaction rate compared to a bare mixture of Pt and CeO2 nanoparticles, while maintaining complete methane oxidation for more than 50 h at 700 °C.
2. Experimental section
2.1 Materials
Potassium tetrachloroplatinate(II) (K2PtCl4, 99.9%, Pt 46.0%), (1-tetradecyl)trimethylammonium bromide (TTAB, C17H38BrN, 98%), sodium borohydride (NaBH4, 98%), and cerium nitrate hexahydrate (Ce(NO3)3·6H2O, 99.99%) were purchased from Alfa Aesar. Ethylenediaminetetraacetic acid (EDTA, C10H16N2O8, 99.5%) and ammonia solution (NH3, 28–30 wt%) were from Junsei Chemical. Quartz sand (50–70 mesh particle size) was from Sigma-Aldrich. Quartz wool (8–15 micro-coarse porosity) was purchased from Chemglass. All reagents employed for the experiments were of analytic grade and were used without further purification.2.2 Preparation of TTAB-capped Pt nanoparticles
Well-dispersed, surfactant-stabilized Pt nanoparticles were synthesized through a colloidal method that was recently reported in the literature.37 An aqueous solution of TTAB (400 mM, 12.5 mL) and K2PtCl4 (10 mM, 5 mL) was mixed with D.I. water (29.5 mL) and stirred at 300 rpm at room temperature for 10 min in a 100 mL round-bottomed flask. The solution was then heated to 50 °C in an oil bath under continuous stirring until the appearance of the mixture changed from cloudy to transparent. Subsequently, an ice-cooled aqueous solution of NaBH4 (500 mM, 3 mL) was added as a reducing agent. The hydrogen gases generated in the flask were then released through a needle by stabbing it into a rubber septum. The reacted mixture was maintained at 50 °C for 15 h under magnetic stirring. The resulting brown solution was centrifuged at 3000 rpm for 30 min to remove the larger Pt nanoparticles. The supernatant solution was separated and centrifuged again at 12![[thin space (1/6-em)]](https://www.rsc.org/images/entities/char_2009.gif) 000 rpm for 15 min twice. The precipitates, TTAB-capped Pt nanoparticles, were collected and re-dispersed in 5 mL of deionized water for further use.
000 rpm for 15 min twice. The precipitates, TTAB-capped Pt nanoparticles, were collected and re-dispersed in 5 mL of deionized water for further use.
2.3 Preparation of Pt@CeO2 nanostructures
The as-synthesized Pt NPs were uniformly encapsulated with ceria shells through a synthetic method that was recently reported by Li et al.36 The as-synthesized TTAB-capped Pt nanoparticles (0.5 mL, particle concentration measured by ICPMS: 4.01(±1.78) × 1013 particles per mL) were dispersed in an aqueous solution of TTAB (25 mM, 40 mL) to stabilize the Pt nanoparticles. For the purpose of covering individual Pt particles with cerium precursors, aqueous solutions of EDTA–NH3 and Ce(NO3)3·6H2O were prepared by adding concentrated ammonia (0.38 mL, 28–30 wt%) in an aqueous solution of EDTA (10 mM, 40 mL) and Ce(NO3)3·6H2O in D.I. water (100 mM, 10 mL), respectively. Subsequently, appropriate volumes of each solution were added to the TTAB-stabilized Pt NP solution so as to change the thickness of the ceria shells by varying the total Ce3+ concentration from 0.24 mM to 1.10 mM while maintaining the Ce3+/EDTA molar ratio at unity. The as-obtained mixture solutions were shaken gently for 1 min and placed in an oven at 90 °C for a range of times from 1 h to 15 h. The resulting cloudy brown solution was centrifuged at 7000 rpm for 15 min and then dried in an oven at 80 °C for 12 h. The as-synthesized Pt@CeO2 nanostructures were then calcined at 450 °C for 3 h in air to remove any remaining organic materials, such as TTAB and EDTA, leading to the formation of micro/meso pores in the ceria shells during the decomposition process.2.4 Characterization techniques
Nitrogen adsorption/desorption isotherms were obtained at liquid nitrogen temperature using a Micromeritics Autosorb-iQ 2ST/MP equipment to analyse the pore distribution and total surface area of the samples. The exposed metallic surface area was also estimated by H2 chemisorption analysis with a Micromeritics ASAP2020 equipment. For H2 chemisorption, all the samples were first degassed under vacuum at 200 °C for 2 hours. The crystal structures of the samples were identified by X-ray diffraction (XRD) using a RIGAKU D/Max-2500 with Cu-Kα irradiation at 40 kV and 200 mA with a scan rate of 4° per minute from 20° to 60°. The surface charges of the Pt NPs and the [EDTA–Ce(III)] complex ions were characterized by zeta-potential measurements (Otsukael, ELS-Z2). A transmission electron microscopy (TEM) analysis was conducted to identify the morphologies of the Pt NPs and the Pt@CeO2 nanocomposites, and the elemental compositions of the samples were characterized using energy-dispersive X-ray spectroscopy (EDS) with a Philips Tecnai F20 at an accelerating voltage of 300 kV. The concentrations of Ce and Pt were measured by inductively coupled plasma mass spectrometry (ICPMS) on an Agilent ICP-MS 7700S instrument.2.5 Catalytic tests
All of the experiments were conducted at atmospheric pressure with a fixed-bed flow quartz reactor having an internal diameter of 4 mm. To build a catalytic bed, quartz wool was initially loaded in the middle of the reactor. Then, 5.4 mg of the catalyst mixed with 100 mg of quartz sand were loaded between the quartz sand layers. The temperature of the catalyst was measured using a K-type thermocouple which was in contact with the catalytic bed. For methane oxidation, the reactant gas mixture consisted of 1 vol.% CH4, 2 vol.% O2, and 97 vol.% Ar and fed at 50 mL min−1 corresponding to weight hourly space velocity (WHSV) of 555![[thin space (1/6-em)]](https://www.rsc.org/images/entities/char_2009.gif) 555 mL g−1 h−1. The reactant and product gases were monitored using a quadrupole mass spectrometer (Pfeiffer Vacuum GSD320) in real time. The conversion ratio of CH4 was detected by the m/z = 15 peak instead of the 16 peak (the major peak of methane) to avoid the interference caused by the fragmented carbon monoxide (0.9%), water (1.1%), carbon dioxide (8.5%), and oxygen (11%).
555 mL g−1 h−1. The reactant and product gases were monitored using a quadrupole mass spectrometer (Pfeiffer Vacuum GSD320) in real time. The conversion ratio of CH4 was detected by the m/z = 15 peak instead of the 16 peak (the major peak of methane) to avoid the interference caused by the fragmented carbon monoxide (0.9%), water (1.1%), carbon dioxide (8.5%), and oxygen (11%).
3. Results and discussion
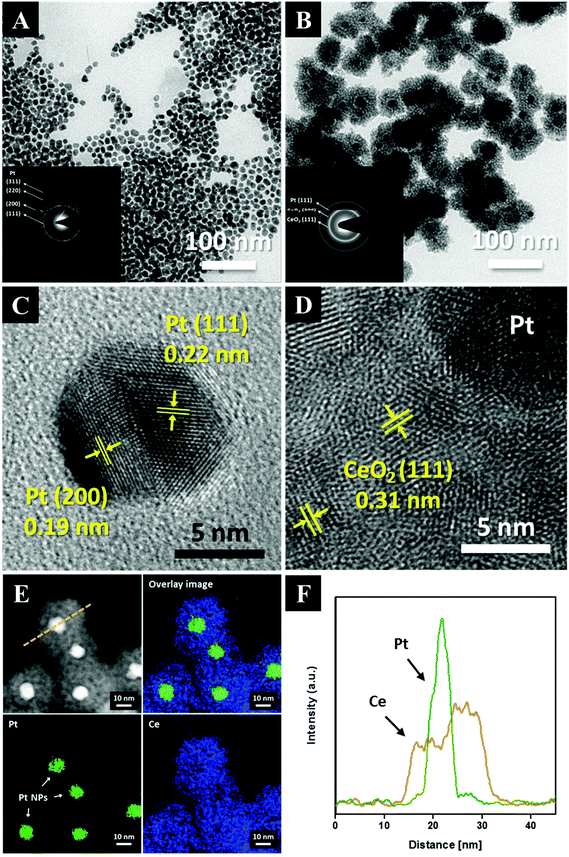
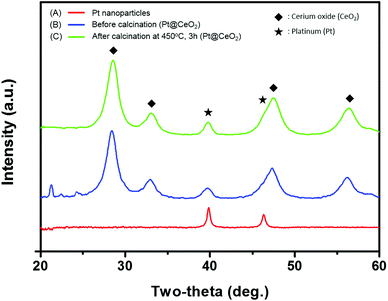
Fig. 1 shows the overall synthetic process used to obtain the core–shell nanoparticles, Pt@CeO2. TTAB-capped Pt nanoparticles (NPs) were prepared through a colloidal synthetic method based on the reduction of K2PtCl4 by NaBH4. Subsequently, to encapsulate the as-synthesized Pt NPs with ceria shells, a cerium nitrate solution mixed with EDTA and NH3 was added to the TTAB-stabilized Pt colloidal solution, as recently suggested by Li et al.36 Here, we take advantage of the electrostatic interaction between the Pt particles and the Ce precursor complex ions so as to coat the Pt cores uniformly with the CeO2 shells. The use of a cationic surfactant, TTAB, enables us to make the surface of the Pt NPs positively charged (zeta potential: +28.3 mV). On the other hand, when the cerium precursors are mixed with the EDTA and NH3 solution, negatively charged [EDTA–Ce(III)] complex ions (zeta potential: −25.4 mV) are formed as a result of the binding between the anionic complexes of the EDTA4− and cerium cations (Ce3+) through the four carboxylates and two amines of the EDTA4−. Accordingly, the [EDTA–Ce(III)] ions are spontaneously adsorbed on the surface of Pt by the charge interaction, forming thin ceria shells on the Pt NPs through a subsequent heat treatment at 90 °C. In this study, EDTA was strategically chosen as a chelating agent for the cerium cations and as an inhibitor to decelerate the rate of the precipitation reaction so as to control the shell thickness of ceria uniformly on the nanoscale. As discussed below, these synthetic processes allow us to investigate the effects of the shell thickness on the thermal resistance of Pt NPs and catalytic behavior of the core–shell nanoparticles.The transmission electron microscopy (TEM) images of both the as-synthesized Pt and the Pt@CeO2 core–shell particles are displayed in Fig. 2. The Pt particles of a cuboctahedron or an irregular shape exhibit a remarkably uniform size distribution with an average particle diameter of 10.8 ± 1.6 nm (see Fig. 2A, S1 and Table S1†). We deliberately set the size of the Pt nanoparticles to approximately 10 nm so as to secure the stability of the Pt compared to smaller particles, mitigating the phenomenon of their melting temperature dropping below 1000 °C. The selected-area electron diffraction (SAED) patterns reveal that both the as-synthesized Pt and the Pt@CeO2 core–shell particles are polycrystalline (see the inset of Fig. 2A and B). It is clear that individual Pt nanoparticles are distantly encapsulated by ceria shells with a uniform shell thickness (Fig. 2B). High-resolution TEM (HRTEM) images show the lattice fringe spacing of 0.22 nm and 0.19 nm in dark cores (Fig. 2C) and of 0.31 nm in the outer shells (Fig. 2D), which correspond to the (111) and (200) planes of platinum and the (111) plane of cubic fluorite ceria, respectively. Furthermore, high-angle annular dark-field scanning transmission electron microscopy (HAADF-STEM) analysis was conducted to determine the distribution of the Pt and Ce elements in the core–shell nanocomposites. The Ce element is spread evenly all over the core–shell nanocomposites, while Pt is only located in the center of the ceria shell networks (see Fig. 2E and F). Here, the surfactant (TTAB) concentration of the TTAB-stabilized Pt colloidal solution plays an important role in the final core–shell nanocomposite morphologies (see Fig. S2†). The appropriate concentration (in this case, 0.025 M, 40 mL) enables the formation of core–shell structures with evenly dispersed cores in ceria shells. The X-ray diffraction (XRD) patterns shown in Fig. 3 reveal that cubic fluorite ceria shells are already formed in the as-synthesized Pt@CeO2 nanocomposites in the absence of heat treatment. The small peaks at a low angle appearing in Fig. 3B are attributed to the residual species, in this case [C14TA]2[PtBr4] (Fig. S3†), of which the diffraction peaks disappear after calcination at 450 °C for 3 hours (Fig. 3C).
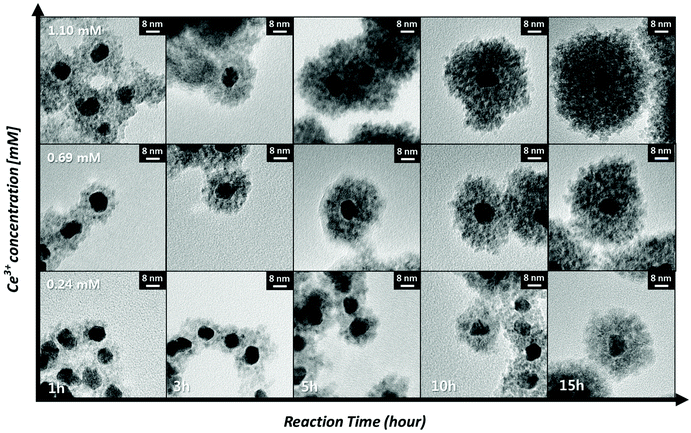
The synthetic route used in this work affords precise control over the shell thickness of the Pt@CeO2 nanocomposites by varying the time for the formation of the ceria shell and the concentration of the cerium ion precursor, as shown in Fig. 4. The shell thickness increases with the reaction time and the Ce ion concentration, typical behavior of nucleation-limited kinetics. For example, Pt@CeO2 core–shell nanocomposites with a shell thickness varying from 6.7 nm to 19.8 nm are obtained by changing the shell formation reaction time from 1 h to 15 h (the middle row of Fig. 4). A plot of [Ce]/[Ce] + [Pt] as a function of the reaction time is depicted in Fig. S4,† showing that continuous heterogeneous nucleation occurs until all of the cerium precursors are consumed. To monitor the change in pores and surface area in the Pt@CeO2 composites according to the different ceria shell thicknesses (6.7 nm to 19.8 nm), N2 adsorption/desorption analyses were conducted. As shown in Fig. S5,† it was observed that the number of larger pores (diameter > 20 nm) increases at the expense of the smaller pores (<10 nm), as the ceria shell thickens. For example, the core–shell particles with a 6.7 nm thick shell shows only nanoscale pores (<10 nm), while a few tens of nanometer-diameter pores are dominantly found in the particles with a thickness of 19.8 nm. In between them, the particles, at 13.8 nm, contain both the sizes of pores, which leads to the maximum value of specific surface area among the three samples (see Table 1).
| Sample | Surface area (m2 g−1) | Pore volume (cm3 g−1) | Average pore diameter (nm) | Exposed metallic surface area (m2 gPt−1) |
|---|---|---|---|---|
| Pt@CeO2 (6.7 nm) | 144.2 | 0.17 | 5.2 | 32.8 |
| Pt@CeO2 (13.8 nm) | 268.1 | 0.44 | 7.6 | 16.1 |
| Pt@CeO2 (19.8 nm) | 27.7 | 0.12 | 18.8 | 14.4 |
| Pt/CeO2 | 19.6 | 0.14 | 31.6 | 39.4 |
| Bare CeO2 | 14.7 | 0.13 | 35.4 | N/A |
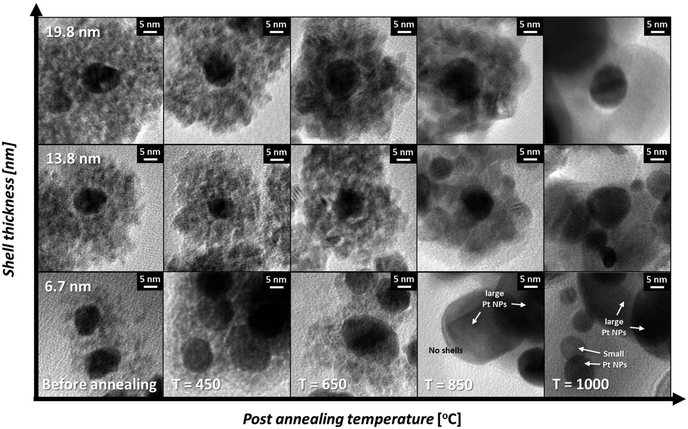
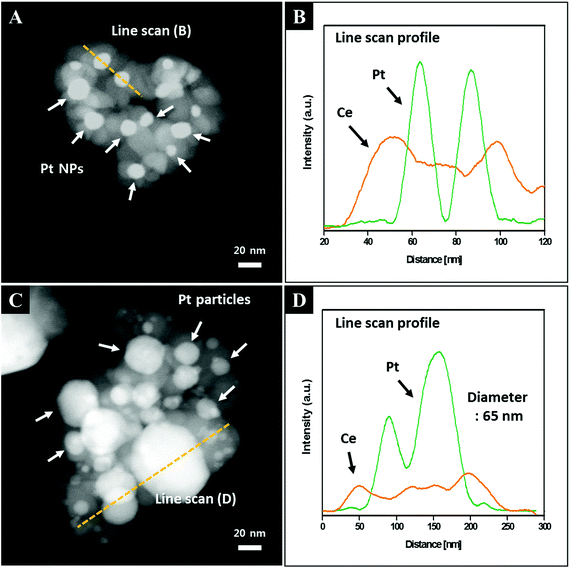
To investigate the influence of the shell thickness on the thermal stability against the growth of the Pt cores, nanocomposites with shell thicknesses of 6.7, 13.8 and 19.8 nm were selected and their morphological changes with respect to post-annealing temperatures varying from 450 °C to 1000 °C (Fig. 5) were monitored. As shown at the bottom of Fig. 5, the Pt cores with the thinnest ceria shell (6.7 nm) are easily sintered during the post-annealing step. Above 850 °C, large Pt particles (>65 nm) are observed together with particles approximately 10 nm in size, showing typical coarsening behavior. On the other hand, as the shell thickness increases, the sintering resistance increases substantially. For example, Pt NPs in the center of the 19.8 nm-thick ceria shells show exceptional thermal stability throughout the temperature range (450 °C–1000 °C), with isolated Pt NPs remaining (the first row of Fig. 5). To monitor the core platinum NPs encapsulated in the thick ceria shells clearly, we observed the HAADF-STEM images of the Pt@CeO2 core–shell nanocomposites (shell thicknesses of 6.7 nm and 19.8 nm) and conducted energy-dispersive X-ray spectroscopy (EDS) analysis. As shown in Fig. 6A, small bright spots exist in the core–shell nanocomposites (shell thickness of 19.8 nm), indicating that every single Pt NP is stable even after the post-annealing process at 1000 °C. The EDS line scan profile, in which Pt peaks are denoted as bright spots, confirms that the Pt cores remain stable (Fig. 6B). On the other hand, large bright spots can easily be observed in the HAADF-STEM image of the core–shell nanocomposites (shell thickness of 6.7 nm) after calcination at 1000 °C (Fig. 6C). The corresponding line profile shows that the large bright spots come from the sintered Pt NPs (Fig. 6D). It should be noted, however, that despite the inhibited growth of the core particles, the surrounding oxide layers become sintered, particularly above 1000 °C, possibly deteriorating the gas accessibility and thereby the reactivity. Accordingly, catalytic tests were run at temperatures less than 1000 °C.
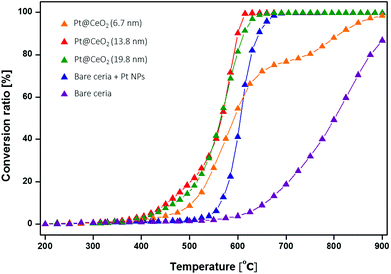
The high-temperature catalytic properties of the Pt@CeO2 nanocomposite particles were tested for the combustion of CH4 (CH4 + 2O2 → CO2 + 2H2O) in the temperature range of 200 to 900 °C. Methane oxidation was chosen as a model reaction because it is a well-known high-temperature reaction given the high stability of methane, in addition to the industrially important outcomes of reduced greenhouse gases and enhanced gas turbine performance levels.38 Here, we tested three representative core–shell nanoparticles and two additional reference samples for methane oxidation; these were three core–shell catalysts with different shell thicknesses of (1) 6.7 nm, (2) 13.8 nm, and (3) 19.8 nm; two reference samples of (4) Pt NPs with simply mixed ceria nanoparticles; and (5) bare ceria nanoparticles. The weight of Pt in each catalyst, except for the bare ceria, was fixed at 0.4 mg, while the total weight of the catalysts was maintained at 5.4 mg in all the cases. All of the samples were preheated to 450 °C for 3 hours and tested under identical reaction conditions. The typical conversion ratio of methane is shown in Fig. 7 as a function of the reaction temperature over the five different types of catalysts. It was found that the reactivity of the core–shell composites prepared here are substantially greater than those of other reference particles. The corresponding value of T10 for sample (2) is 457 °C, which is 107 °C and 202 °C lower than the reference samples (4) and (5), respectively (see Table 2), indicating again the exceptional catalytic activity of the core–shell nanocomposites in this work.
| Sample | T 10/°C | Activation energy (Ea)/kJ mol−1 | Specific reaction rate at 495 °C |
|---|---|---|---|
| Per unit weight of Pt catalyst/molecules per s g | |||
| Pt@CeO2 (6.7 nm) | 506 | 65.4 | 3.83 × 10²³ |
| Pt@CeO2 (13.8 nm) | 457 | 81.7 | 1.09 × 1024 |
| Pt@CeO2 (19.8 nm) | 469 | 70.6 | 6.85 × 10²³ |
| Pt/CeO2 | 564 | 82.3 | 1.37 × 10²³ |
| Bare CeO2 | 659 | 115.6 | 2.03 × 10²² |
Focusing on the core–shell samples, the oxidation reactivity varies with the ceria shell thickness. It was found that samples (2) and (3) with corresponding thicknesses of 13.8 nm and 19.8 nm show similar and, at the same time, maximum conversion capability, whereas sample (1), at 6.7 nm, exhibits relatively poor reactivity. The poor reactivity of sample (1) occurs mainly because the inherently short inter-distance between the Pt cores facilitates the formation of Pt aggregates and thus ensuing degradation of the performance. Fig. S6 and S7† show the morphological changes of the Pt cores in both samples (1) and (2) as a function of the annealing temperature. It was found that Pt particles in sample (1) are more easily sintered upon annealing, while those in sample (2) largely maintain their size constant. For example, the as-synthesized particles in sample (1), even without any post-annealing, already have larger Pt cores (15.2 ± 2.3 nm) than those (12.3 ± 1.4 nm) in sample (2). Furthermore, severe agglomeration occurs upon post-annealing at higher temperatures (>650 °C). Upon annealing at 850 °C, the core size in sample (1) dramatically increases: (26.9 ± 7.7 nm), whereas the Pt cores in sample (2) were nearly unchanged. These agglomeration behaviours of the Pt particles in sample (1) are reflected by the catalytic performance with lower conversion ratios at the early stage of the light-off curve (450–550 °C) and the sudden drop in the ratios at a temperature range between 650 °C and 800 °C, when compared to samples (2) and (3).
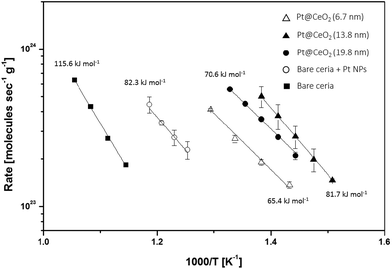
The kinetic rate data show the intrinsic activity difference among the catalysts. To observe the intrinsic material properties, we set the point below the 10% conversion ratio region. As shown in Fig. 8, sample (2) exhibits an eight times higher reaction rate compared to the rate of sample (4) (simply mixed catalysts), while it is 54 times higher than that of sample (5) (bare CeO2) under the same reaction conditions. However, the apparent activation energies of all of the catalysts except for the bare CeO2 are nearly similar (65.4 to 82.3 kJ mol−1), indicating that the characteristics of the reaction sites in all the cases here are similar (see Table 2), likely the Pt–CeO2 interfaces.38 N2 physisorption and H2 chemisorption results provide supporting evidence about the active sites in the composite catalysts. As shown in Table 1, even though, the surface area of sample (2), at 13.8 nm, is roughly ten times higher than that in sample (3), at 19.8 nm, there is not much difference in their catalytic activities for methane combustion, indicating that the combustion reactions are independent of the total surface area of the catalysts used in this study. On the other hand, the exposed Pt surface areas of the core–shell samples (both (2) and (3)) are around two times smaller than that of a bare mixture sample (sample (4)), while the catalytic activities for methane conversion with the core–shell catalysts are much higher than those in the bare mixture sample. Thus, one can also conclude that exposed metallic surface area is not an important factor governing the overall reaction rates. These results, in combination with the similar values for apparent activation among the composites and a bare mixture, support that the interfaces between Pt and ceria are the dominant reaction sites. In the core–shell structure, Pt cores are three-dimensionally connected by porous ceria shells with exceptionally high metal–oxide interfaces, and thus, have enhanced catalytic properties. The different catalytic activities among the samples are considered to be the result of the differing numbers of metal-support interface sites. A similar observation has also been reported by Cargnello et al. with Pd@CeO2 catalysts.38
We also compared the catalytic activities of the core–shell composite with previous studies.39–41 Here, the catalytic activity is defined as the converted CH4 volume per gram of catalyst per hour, at two temperature regions (600 °C and 700 °C). As shown in Fig. S8 and Table S2,† our samples show reasonably decent catalytic activity, compared to those in the previous reports. This is the case even though the size of the Pt particles used in our work is larger than those in the literature. Furthermore, to check the feasibility of the core–shell nanocomposites for high-temperature catalysts, we conducted a long-term stability test of methane oxidation at 700 °C. As shown in Fig. 9, methane is completely converted on the Pt@CeO2 sample (2) for more than 50 hours without any degradation, while the conversion ratio of sample (1) decreases during the first 20 hours of the test.
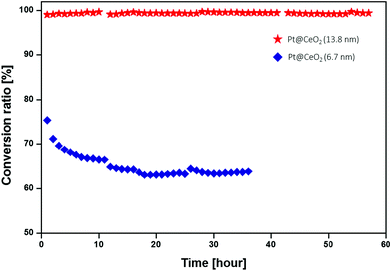 | ||
| Fig. 9 Long-term stability of core–shell nanocomposites with the shell thicknesses of 13.8 nm (red star), and 6.7 nm (blue diamond) for CH4 oxidation, measured at 700 °C. | ||
4. Conclusion
In conclusion, we successfully prepared shell-controllable Pt@CeO2 core–shell nanocomposites for a high-temperature oxidation reaction catalyst. To conduct control experiments, we fixed the diameter size of the Pt NPs at 10 nm and varied only the shell thickness on the nanoscale. When the shell is thicker, the stability of the core tends to be secured under high-temperature conditions. The activation energies for methane oxidation over the Pt-containing catalysts are similar (65.4 to 82.3 kJ mol−1), indicating that the core–shell structure enhances the catalytic activity and that an appropriate shell thickness is necessary to ensure the best performance. In the catalytic oxidation test of methane, core–shell nanocomposites with shell thicknesses of 13.8 nm and 19.8 nm exhibit similar and simultaneously the best performance in terms of their reactivity and thermal stability. Even after the oxidation reaction of methane at 700 °C for 50 hours, the core–shell nanocomposite effectively serves as an oxidation catalyst, maintaining a conversion ratio of methane of nearly 100% without degradation. This study provides a guideline for the design of catalysts for conditions involving elevated temperatures, improving both the stability against sintering and the catalytic activity during various useful reactions.Acknowledgements
This work was supported by the Korea CCS R&D Center (KCRC) grant funded by the Korea government (Ministry of Science, ICT & Future Planning) (2014M1A8A1049350). Additional support was provided by the National Research Foundation of Korea (NRF) grant funded by the Korea government (Ministry of Science, ICT & Future Planning) (2014R1A1A1003008).Notes and references
- J. A. Rodriguez, S. Ma, P. Liu, J. Hrbek, J. Evans and M. Perez, Science, 2007, 318, 1757–1760 CrossRef CAS PubMed.
- B. S. Yeo and A. T. Bell, J. Am. Chem. Soc., 2011, 133, 5587–5593 CrossRef CAS PubMed.
- C. H. Bartholomew, Appl. Catal., A, 2001, 212, 17–60 CrossRef CAS.
- J. A. Moulijn, A. E. van Diepen and F. Kapteijn, Appl. Catal., A, 2001, 212, 3–16 CrossRef CAS.
- P. Forzatti and L. Lietti, Catal. Today, 1999, 52, 165–181 CrossRef CAS.
- J. G. McCarty, M. Gusman, D. M. Lowe, D. L. Hildenbrand and K. N. Lau, Catal. Today, 1999, 47, 5–17 CrossRef CAS.
- A. Cao, R. Lu and G. Veser, Phys. Chem. Chem. Phys., 2010, 12, 13499–13510 RSC.
- A. Cao and G. Veser, Nat. Mater., 2010, 9, 75–81 CrossRef CAS PubMed.
- G. Prieto, J. Zecevic, H. Friedrich, K. P. de Jong and P. E. de Jongh, Nat. Mater., 2013, 12, 34–39 CrossRef CAS PubMed.
- S. H. Joo, J. Y. Park, C. K. Tsung, Y. Yamada, P. D. Yang and G. A. Somorjai, Nat. Mater., 2009, 8, 126–131 CrossRef CAS PubMed.
- P. M. Arnal, M. Comotti and F. Schuth, Angew. Chem., Int. Ed., 2006, 45, 8224–8227 CrossRef CAS PubMed.
- H. Shinjoh, Catal. Surv. Asia, 2009, 13, 184–190 CrossRef CAS.
- J. P. Gabaldon, M. Bore and A. K. Datye, Top. Catal., 2007, 44, 253–262 CrossRef CAS.
- M. Kruk, M. Jaroniec, Y. Sakamoto, O. Terasaki, R. Ryoo and C. H. Ko, J. Phys. Chem. B, 2000, 104, 292–301 CrossRef CAS.
- A. V. Neimark, P. I. Ravikovitch, M. Grun, F. Schuth and K. K. Unger, J. Colloid Interface Sci., 1998, 207, 159–169 CrossRef CAS PubMed.
- J. L. Lu, B. S. Fu, M. C. Kung, G. M. Xiao, J. W. Elam, H. H. Kung and P. C. Stair, Science, 2012, 335, 1205–1208 CrossRef CAS PubMed.
- Q. Fu, H. Saltsburg and M. Flytzani-Stephanopoulos, Science, 2003, 301, 935–938 CrossRef CAS PubMed.
- D. A. Hickman and L. D. Schmidt, Science, 1993, 259, 343–346 CAS.
- W. Jung, K. L. Gu, Y. Choi and S. M. Haile, Energy Environ. Sci., 2014, 7, 1685–1692 CAS.
- J. K. Norskov, T. Bligaard, A. Logadottir, J. R. Kitchin, J. G. Chen, S. Pandelov and J. K. Norskov, J. Electrochem. Soc., 2005, 152, J23–J26 CrossRef CAS.
- V. Viswanathan, H. A. Hansen, J. Rossmeisl and J. K. Norskov, ACS Catal., 2012, 2, 1654–1660 CrossRef CAS.
- S. Woo, J. Lee, S. K. Park, H. Kim, T. D. Chung and Y. Z. Piao, Curr. Appl. Phys., 2015, 15, 219–225 CrossRef.
- C. T. Campbell and C. H. F. Peden, Science, 2005, 309, 713–714 CrossRef CAS PubMed.
- N. J. Lawrence, J. R. Brewer, L. Wang, T. S. Wu, J. Wells-Kingsbury, M. M. Ihrig, G. H. Wang, Y. L. Soo, W. N. Mei and C. L. Cheung, Nano Lett., 2011, 11, 2666–2671 CrossRef CAS PubMed.
- W. C. Chueh, Y. Hao, W. Jung and S. M. Haile, Nat. Mater., 2012, 11, 155–161 CrossRef CAS PubMed.
- W. Jung, J. O. Dereux, W. C. Chueh, Y. Hao and S. M. Haile, Energy Environ. Sci., 2012, 5, 8682–8689 CAS.
- G. N. Vayssilov, Y. Lykhach, A. Migani, T. Staudt, G. P. Petrova, N. Tsud, T. Skala, A. Bruix, F. Illas, K. C. Prince, V. Matolin, K. M. Neyman and J. Libuda, Nat. Mater., 2011, 10, 310–315 CrossRef CAS PubMed.
- M. Cargnello, V. V. T. Doan-Nguyen, T. R. Gordon, R. E. Diaz, E. A. Stach, R. J. Gorte, P. Fornasiero and C. B. Murray, Science, 2013, 341, 771–773 CrossRef CAS PubMed.
- Y. C. Wei, Z. Zhao, J. Liu, C. M. Xu, G. Y. Jiang and A. J. Duan, Small, 2013, 9, 3957–3963 CrossRef CAS PubMed.
- C. X. Zhang, S. R. Li, T. Wang, G. W. Wu, X. B. Ma and J. L. Gong, Chem. Commun., 2013, 49, 10647–10649 RSC.
- X. Wang, D. P. Liu, S. Y. Song and H. J. Zhang, J. Am. Chem. Soc., 2013, 135, 15864–15872 CrossRef CAS PubMed.
- B. Liu, H. Y. Xu and Z. H. Zhang, Catal. Commun., 2012, 26, 159–163 CrossRef CAS.
- N. Zhang, X. Z. Fu and Y. J. Xu, J. Mater. Chem., 2011, 21, 8152–8158 RSC.
- L. Arroyo-Ramirez, C. Chen, M. Cargnello, C. B. Murray and R. J. Gorte, Catal. Today, 2015, 253, 137–141 CrossRef CAS.
- C. Wen, Y. Zhu, Y. C. Ye, S. R. Zhang, F. Cheng, Y. Liu, P. Wang and F. Tao, ACS Nano, 2012, 6, 9305–9313 CrossRef CAS PubMed.
- B. X. Li, T. Gu, T. Ming, J. X. Wang, P. Wang, J. F. Wang and J. C. Yu, ACS Nano, 2014, 8, 8152–8162 CrossRef CAS PubMed.
- H. Lee, S. E. Habas, S. Kweskin, D. Butcher, G. A. Somorjai and P. D. Yang, Angew. Chem., Int. Ed., 2006, 45, 7824–7828 CrossRef CAS PubMed.
- M. Cargnello, J. J. D. Jaen, J. C. H. Garrido, K. Bakhmutsky, T. Montini, J. J. C. Gamez, R. J. Gorte and P. Fornasiero, Science, 2012, 337, 713–717 CrossRef CAS PubMed.
- Y. Zhu, S. R. Zhang, J. J. Shan, L. Nguyen, S. H. Zhan, X. L. Gu and F. Tao, ACS Catal., 2013, 3, 2627–2639 CrossRef CAS.
- W. Tang, Z. P. Hu, M. J. Wang, G. D. Stucky, H. Metiu and E. W. McFarland, J. Catal., 2010, 273, 125–137 CrossRef CAS.
- P. Pantu and G. R. Gavalas, Appl. Catal., A, 2002, 223, 253–260 CrossRef CAS.
Footnote |
| † Electronic supplementary information (ESI) available: The effect of TTAB on core–shell morphologies, the results of reproducibility on Pt NPs, XRD results, concentration of Pt@CeO2 composites vs. reaction time, pore size distribution, and TEM images of core–shell nanocomposites after annealing. See DOI: 10.1039/c6nr00170j |
| This journal is © The Royal Society of Chemistry 2016 |


