
Charge transfer effects on the chemical reactivity of PdxCu1−x nanoalloys†
M. V.
Castegnaro
a,
A.
Gorgeski
a,
B.
Balke
b,
M. C. M.
Alves
c and
J.
Morais
*a
aInstituto de Física, Universidade Federal do Rio Grande do Sul (UFRGS), Avenida Bento Gonçalves, 9500, Bairro Agronomia, CP 15051, CEP 91501-970, Porto Alegre, RS, Brazil. E-mail: jonder@if.ufrgs.br
bInstitut für Anorganische und Analytische Chemie, Johannes Gutenberg-Universität, 55099 Mainz, Germany
cInstituto de Química, Universidade Federal do Rio Grande do Sul (UFRGS), Avenida Bento Gonçalves, 9500, Bairro Agronomia, CP 15003, CEP 91501-970, Porto Alegre, RS, Brazil
First published on 20th November 2015
Abstract
This work reports on the synthesis and characterization of PdxCu1−x (x = 0.7, 0.5 and 0.3) nanoalloys obtained via an eco-friendly chemical reduction method based on ascorbic acid and trisodium citrate. The average size of the quasi-spherical nanoparticles (NPs) obtained by this method was about 4 nm, as observed by TEM. The colloids containing different NPs were then supported on carbon in order to produce powder samples (PdxCu1−x/C) whose electronic and structural properties were probed by different techniques. XRD analysis indicated the formation of crystalline PdCu alloys with a nanoscaled crystallite size. Core-level XPS results provided a fingerprint of a charge transfer process between Pd and Cu and its dependency on the nanoalloy composition. Additionally, it was verified that alloying was able to change the NP's reactivity towards oxidation and reduction. Indeed, the higher the amount of Pd in the nanoalloy, less oxidized are both the Pd and the Cu atoms in the as-prepared samples. Also, in situ XANES experiments during thermal treatment under a reducing atmosphere showed that the temperature required for a complete reduction of the nanoalloys depends on their composition. These results envisage the control at the atomic level of novel catalytic properties of such nanoalloys.
1. Introduction
Facing the growing demand for energy and the wide use of fossil fuels, responsible for the large emission of gaseous pollutants, major academic and industrial efforts have been made towards the development of renewable and clean energy sources. The high efficiency of electrochemical conversion from energy stored in fuels (such as hydrogen or hydrogen-rich alcohols) to electrical energy has set fuel cells as one of the most potential energy conversion devices for mobile and stationary applications.1,2 The development of more efficient, poisoning-resistant and less expensive converters plays a key role towards making fuel cells commercially available. Most of these converters consist of electrocatalysts based on noble metal nanoparticles (NPs), such as Pt and Pd.1–6In this context, the synthesis and characterization of bimetallic or multimetallic NPs have attracted great interest, since they display novel physical and chemical properties, distinct from their monometallic counterparts.7–10 Additionally, the properties of nanoalloys can be tuned by changing their size, atomic arrangement and composition.7–10 Among the bimetallic systems, Pd–Cu is widely investigated due to its well-known reactivity not only for electrocatalysis but also for environmental applications, such as the reduction of NO, nitrite and nitrate,11,12 and oxidation of CO.12 The partial replacement of Pd for Cu atoms not only improves their catalytic properties, but also reduces their production cost.
PdCu bimetallic nanoalloys have been studied towards different catalytic reactions.3–6,13,14 Mattei and coworkers15 reported structural changes upon heating PdCu random nanoalloys embedded in silica, proving the formation of a Pd-rich core surrounded by a CuO shell upon heating under an oxidizing atmosphere. They have also observed the Pd migration towards the NP surface upon heating under a reducing atmosphere. Guy et al.11 studied PVP-stabilized PdCu nanoalloys (0–50% of Cu atoms) for the reduction of nitrate and nitrite in aqueous media, and they evidenced a strong correlation between composition and reactivity, as well as the NP size and lattice parameter. In a recent work,16 vapor deposited PdCu thin films have been studied as a model catalyst for the formic acid oxidation. XPS results showed changes in the electronic structure, for both the core and valence levels, of Pd and Cu atoms depending on the film thickness. Indeed, they demonstrated that these changes improved the catalytic properties of the PdCu model catalysts. The core-level binding energy shifts were explained in terms of charge transfer between Pd and Cu species, and have been described in many experimental and theoretical studies.4,13,16–20 However, there is still a lack of studies on PdCu nanoalloys produced by chemical reduction employing mild chemicals and conditions. Moreover, detailed investigations on the structural and electronic properties of PdCu nanoalloys with different compositions and similar sizes have not yet been reported to our knowledge.
Herein we demonstrate an approach to easily produce PdxCu1−x nanoalloys (x = 0.7, 0.5 and 0.3) under mild chemical reduction conditions: aqueous medium, ambient temperature and pressure, using ascorbic acid and sodium citrate as reducing and stabilizing agents. The synthetic procedure used here is a modification of those previously reported21,22 to obtain Pd, Pt and Ag NPs, and it is intended to minimize the hazards associated with the synthesis, as well as the consumption of energy and the use of costly materials. The as-synthesized PdxCu1−x nanoparticles were analyzed by TEM (transmission electron microscopy) and HRTEM (high resolution TEM). Later, the NPs were supported on carbon (C) and the formed PdxCu1−x/C powder samples were characterized by XRD (X-ray diffraction) to evaluate alloying. Synchrotron excited XPS (X-ray photoelectron spectroscopy) probed their core-level electronic structure. XPS is a powerful technique to probe the atomic chemical state and electronic structure, which are the major players that must be well known to fully understand the catalysts’ reactivity. The core-level binding energies observed by XPS were used here to probe the changes in the electronic structure and chemical environment of the PdxCu1−x/C samples. Additionally, in situ XANES measurements were used to probe the reactivity behaviour of each sample during exposure to a reducing CO atmosphere at temperatures up to 450 °C.
2. Experimental
2.1. Synthesis of PdxCu1−x nanoalloys and PdxCu1−x/C
The PdxCu1−x nanoalloys were obtained for x = 0.3, 0.5 and 0.7. Different molar ratios of PdCl2 (Sigma-Aldrich) and CuCl2·H2O (Sigma-Aldrich) were simultaneously reduced at room-temperature in deionized water employing 0.11 × 10⁻³ mol of trisodium citrate (C6H5O7Na3·2H2O, Sigma-Aldrich) and 2.72 × 10⁻³ mol of L-ascorbic acid (C6H8O6, Sigma-Aldrich). After 20 minutes under stirring, a black colloidal suspension was obtained. The colloids were stable and no precipitation was observed for months.The freshly prepared colloids were adsorbed on carbon black (Vulcan XC-72R, Cabot). For this purpose, the carbon was added to the colloids and stirred for 15 minutes. The solutions were centrifuged (4000 rpm), the precipitate was washed with deionized water and isopropyl alcohol and then dried at room temperature for 30 minutes under vacuum (approx. 1 Torr). The final PdxCu1−x/C samples were stored in flasks without any special procedure to prevent oxidation. The mass of carbon added to the colloids was measured to achieve 10 wt% (about 1.5 at%) of metals.
2.2. Characterization procedures
Transmission electron microscopy (TEM) analyses of the as-prepared nanoalloys were performed using a JEOL JEM-1200 EX II microscope at CME-UFRGS working at 100 kV. For each sample, a drop of the colloid was placed on a Formvar-coated copper grid (300 mesh, TED PELLA) and dried in a desiccator. About 900 NPs from different parts of the images were considered (Image J 1.45) in order to estimate the size distribution of each sample. The size distributions were fitted considering a Gaussian–Lorentzian product function. The high-resolution TEM (HRTEM) analyses were carried out using a JEOL JEM-3010 URP microscope at LNNano (Brazilian Nanotechnology National Laboratory) working at 300 kV. For this, a drop of the respective colloid was placed on a copper grid coated with an ultrathin carbon film supported by a lacey carbon film (400 mesh, TED PELLA).The composition of the PdxCu1−x/C was determined by Rutherford backscattering spectrometry (RBS) at the Ion Implantation Lab (UFRGS) using 2.0 MeV incident He+ ions and measuring the kinetic energy of the backscattered ions at 165°. The samples were previously pressed (2 MPa) to prepare homogeneous pellets. The total metal loadings and the Pd/Cu ratios were calculated from the heights of the RBS signals corresponding to Pd, Cu and C in the spectra.23 The elemental compositions were also verified by energy dispersive spectroscopy (EDS) using a scanning electron microscope JEOL JIB-4500 (LCN-UFRGS), working at an accelerating voltage of 15 kV. The compositional maps were constructed using the emission lines of Pd, Cu and C. The as-prepared PdxCu1−x/C was dispersed on a carbon tape for these measurements.
The crystalline structure of PdxCu1−x/C was probed by XRD, performed with a Siemens D500 using Cu Kα radiation (λ = 1.542 Å, 40 kV, 17.5 mA). The step size was 0.05° and the acquisition time was 1 s per point, ranging from 20° to 90°. The diffraction peaks were indexed using the ICSD database. The peak positions and FWHM of the Bragg peaks were fitted with a Lorentzian function, and Scherrer's equation was applied (supposing spherical crystallites) to estimate the crystallite mean size.
Synchrotron excited X-ray photoemission spectroscopy (XPS) was employed to probe the core-level electronic structure of the carbon supported nanoalloys. The XPS measurements were performed at the SXS beamline24 of the LNLS (Brazilian Synchrotron Light Laboratory) using monochromatized 1840 eV exciting photons and a hemispherical electron analyzer (SPECS model PHOIBOS 150). The PdxCu1−x/C samples were fixed on stubs using a conducting carbon tape and the measurements were made at room temperature using a 45° takeoff angle. The Pd 3d and Cu 2p regions were measured using 30 eV pass energy and an energy step of 0.1 eV. Thin foils of Pd, Cu and Pd0.6Cu0.4 alloy, as well as reference monometallic Pd and Cu nanoparticles supported on Vulcan, were used as standards. The analyzer's energy calibration was performed using the Au 4f7/2 peak (84.0 eV (ref. 25)), measured from a standard Au foil. To correct any charging effects, the C 1s peak (284.5 eV (ref. 25)) was used as an internal reference. All peaks were adjusted (XPSPeak 4.1) with an asymmetric Gaussian–Lorentzian sum function (30% L–G) and a Shirley background.26 During the data fitting, the FWHM of metal–oxygen and metal–metal components, as well as the binding energy of metal–oxygen components, were fixed for all samples.
The in situ XANES experiments were performed in XAFS1 LNLS beamline.27 The XANES spectra were collected in transmission mode at the Cu K edge using a channel-cut Si (220) crystal. A standard Cu foil was used as an energy reference. Each spectrum was acquired in the range of 8910 to 9040 eV with a 1 eV step and 1 s per point. Considering the acquisition time and the time spent in the monochromator movements, each scan took 3.6 minutes.
For the experiments, the PdxCu1−x/C samples were pressed to prepare homogeneous pellets and placed in a tubular furnace. The samples were heated (7.5 °C min−1) from room temperature up to 75 °C under a He flux (300 mL min−1). At 75 °C, they were exposed to a CO flux (5% CO in He, 300 mL min−1) for 60 minutes, showing no sign of an ongoing reduction process due to the low temperature exposure to a reducing atmosphere. Subsequently, the samples were heated up to 450 °C (7.5 °C min−1) under a CO flux as the reduction process was monitored by XAS.
The XANES data acquired during the complete reaction were analysed to extract information on the behaviour of PdxCu1−x/C samples by heating under a CO atmosphere. A linear combination of each XANES spectrum was used to extract the evolution of the oxidized copper fraction present in each sample during the reaction. The ATHENA program of the IFEFFIT package28 was used in this procedure. The following equation was used for the linear combinations: μLC = Ciμi + Cfμf, where μi and μf are, respectively, the as-prepared and the reduced (the last) spectra acquired for each sample.29 The corresponding linear coefficients were normalized (Ci + Cf = 1) and limited between 0 and 1. The μLC was the calculated absorption spectrum that best adjusts to the experimental data.
3. Results and discussion
3.1. TEM and HRTEM analysis
The TEM image of the as-prepared Pd0.5Cu0.5 nanoalloy is shown in Fig. 1. The particle average size obtained by fitting the histogram is 4.1 ± 1.1 nm. The TEM images and histograms for the x = 0.3 and 0.7 samples are available in the ESI.† The NP morphologies were similar to that seen in Fig. 1 and the average sizes were 4.2 ± 1.1 nm and 3.8 ± 0.9 nm for x = 0.3 and 0.7, respectively. Thereby, the synthesis method allows the production of NPs with nearly the same size in the compositional range tested here. Fig. 2(a–c) show the HRTEM images of isolated PdxCu1−x NPs for x = 0.3, 0.5 and 0.7, respectively.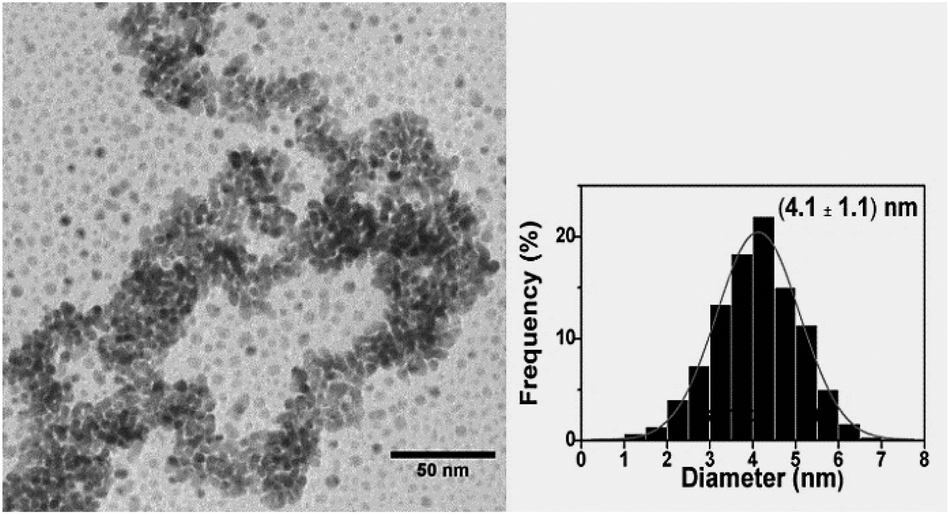 | ||
| Fig. 1 Representative TEM image and histogram of the Pd0.5Cu0.5 NP size distribution. | ||
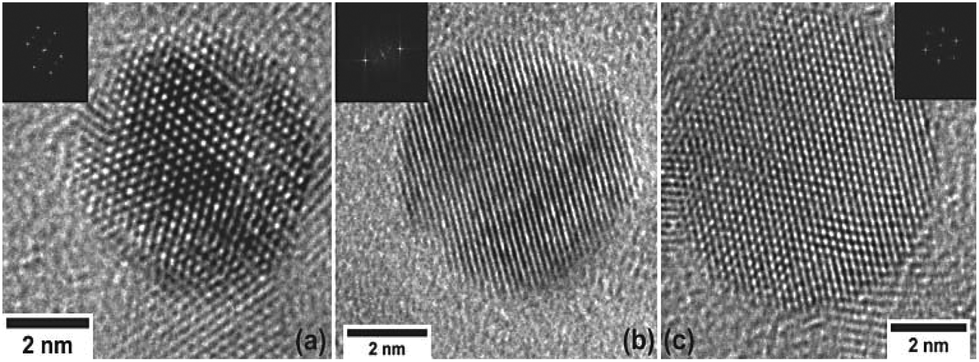 | ||
| Fig. 2 HRTEM images of PdxCu1−x NPs for x = 0.7 (a), 0.5 (b) and 0.3 (c). The insets show the Fourier Transform of each image. | ||
These images confirmed the quasi-spherical shape of the nanoalloys. It is noteworthy that previous studies30,31 have detected twinned structures for nanoalloys, as well as for monometallic particles, but for the compositional range investigated in the present work, no twinned particles have been observed.
The local lattice parameter obtained from the fast Fourier transforms (3.76 Å, for x = 0.3 and 0.5, and 3.77 Å for x 0 = 0.7) is approximately that of the fcc alloy phase of Pd and Cu (ICSD codes: 103082, 103085 and 166153). During the analysis, no external layer has been observed, neither composed of an oxide phase nor a residual capping agent.
3.2. RBS and SEM/EDS analysis
The chemical composition of the carbon supported PdxCu1−x nanoalloys was investigated by RBS and SEM/EDS. Table 1 presents the results from these analyses, and Fig. 3 shows a representative SEM image of Pd0.5Cu0.5/C and the EDS elemental distribution maps obtained for the same region. The RBS and EDS results for the Pd/Cu atomic ratios are close to the expected values, as can be seen in the last two columns in Table 1, where the x value was obtained for each PdxCu1−x/C sample from the EDS and RBS data.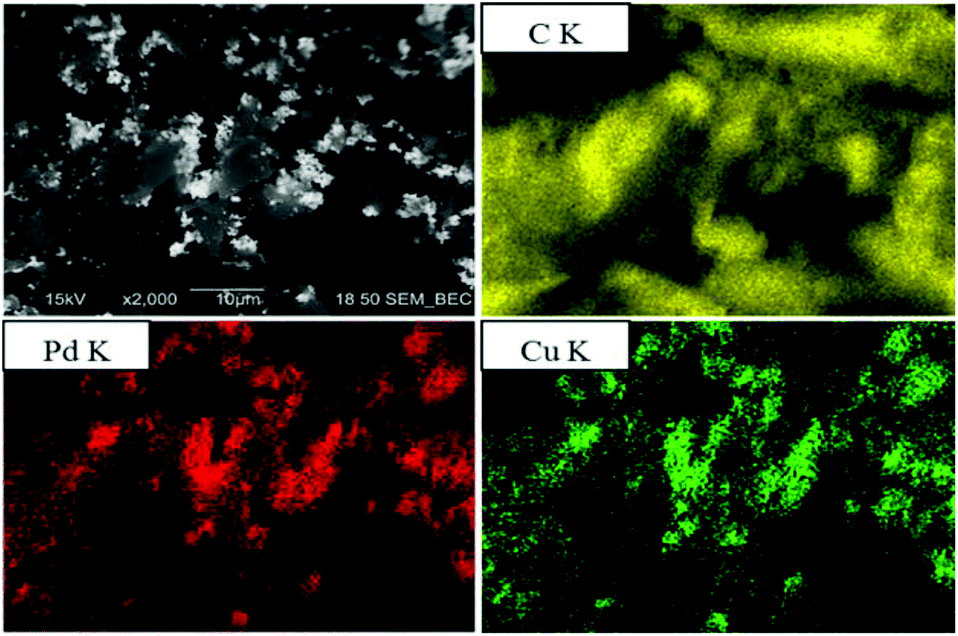 | ||
| Fig. 3 Micrograph using the backscattered electron signal, in compositional mode (upper in the left column), and maps of the elemental distribution of C, Pd and Cu. | ||
| Sample (PdxCu1−x/C) | Metal loading (wt%) | Pd/Cu ratio | x value | |||
|---|---|---|---|---|---|---|
| RBS | EDS | RBS | EDS | RBS | EDS | |
| Pd0.7Cu0.3/C | 8.64 | 10.24 | 2.13 | 2.18 | 0.68 | 0.69 |
| Pd0.5Cu0.5/C | 8.58 | 10.21 | 0.93 | 0.99 | 0.48 | 0.50 |
| Pd0.3Cu0.7/C | 8.39 | 10.18 | 0.37 | 0.40 | 0.27 | 0.29 |
The total metal loadings obtained from the RBS analysis are lower than those obtained by EDS, but both are close to the expected value (10 wt%). A possible explanation for such difference rests in the fact that EDS provides information from the surface of the PdxCu1−x/C, where the NPs are expected to be anchored, while the RBS signal came from a deeper region.
In fact, the NPs are mainly hosted on the surface of the carbon grains, as can be seen for the Pd0.5Cu0.5/C case in Fig. 3 (upper image in the left column). The contrast in this image, which has been acquired using the backscattered electron signal in the compositional mode, depends on the average atomic number of the region where the electrons are backscattered. Consequently, the bright regions have higher atomic numbers (metals rich regions) than the dark ones (carbon). The EDS maps (Fig. 3) also indicate the formation of coincidental Cu- and Pd-rich regions on the carbon surface, stating the formation of bimetallic clusters.
3.3. XRD measurements
The long range order of the PdxCu1−x/C samples was investigated by XRD. The diffraction patterns are shown in Fig. 4, where neither the characteristic peaks for fcc Pd (ICSD code: 76148) nor fcc Cu (ICSD code: 64669) phases are noticeable. But instead, broad peaks were observed around 41°, 48° and 70°, which are related to a Pd–Cu alloy in the fcc phase (ICSD codes: 103082, 103085 and 166153). Additionally no crystalline phases of metal oxide or metal carbide have been observed.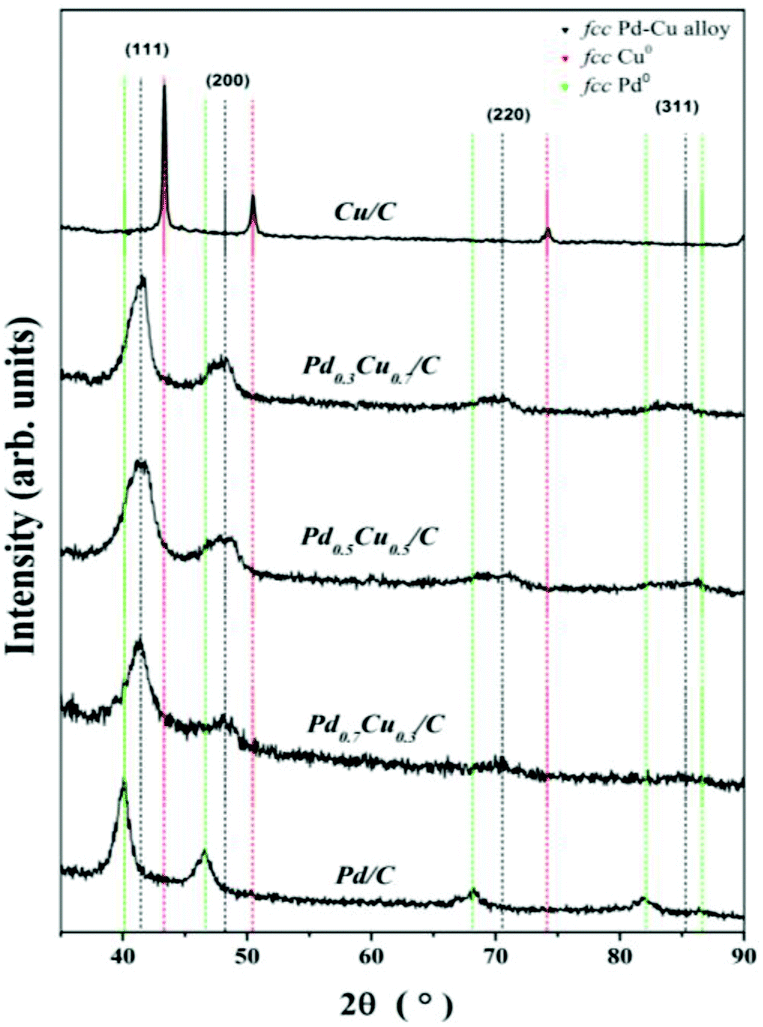 | ||
| Fig. 4 XRD patterns of the PdxCu1−x/C samples. The vertical dashed lines indicate the expected peak positions for fcc Cu (red, ICSD code: 64669), fcc Pd (green, ICSD code: 76148) and Pd–Cu alloy (black, ICSD code: 166153). | ||
Table 2 displays the results obtained from the XRD analysis of the PdxCu1−x/C samples. For comparison, it also shows the results for monometallic Cu and Pd NPs prepared by a similar method. The peak positions, 2θ, obtained for the (111) diffraction peaks have been used to determine the interplanar distance, d111, for each system. Additionally, the lattice parameter, a, was calculated using the interplanar distance d111 of each case. The resulting a values match those obtained from the HRTEM analysis, and they are similar to the ones found in the literature3,5,6,32,33 and in the ICSD database for bulk Pd–Cu alloys (3.75 Å).
| System | 2θ (°) | d 111 (Å) | a (Å) | D (nm) |
|---|---|---|---|---|
| a Interplanar distances calculated using the peak position from fitted data. b Lattice parameter using d111 and 2θ. c Crystallite size calculated via Scherrer's equation using the FWHM and peak position obtained from data fitting. | ||||
| Pd/C | 39.979 | 2.242 | 3.901 | 5.31 |
| Pd0.7Cu0.3/C | 41.281 | 2.184 | 3.784 | 4.21 |
| Pd0.5Cu0.5/C | 41.340 | 2.181 | 3.778 | 4.19 |
| Pd0.3Cu0.7/C | 41.419 | 2.177 | 3.771 | 4.28 |
| Cu/C | 43.392 | 2.083 | 3.607 | 16.45 |
The average size of crystallites was obtained for the most intense diffraction peak in each pattern. The values found for x = 0.3, 0.5 and 0.7 were 4.28 ± 1.10 nm, 4.19 ± 1.06 nm and 4.21 ± 1.08 nm, respectively. These values are in agreement with the TEM results and confirm the formation of a nanosized alloy phase of Pd and Cu with three different compositions, as probed by RBS and EDS.
3.4. XPS measurements
The core-level binding energies (BE) of the Pd and Cu atoms of PdxCu1−x/C samples are displayed in Fig. 5. The plot at the left refers to the Cu 2p3/2 photoelectron peaks of all samples, including for comparison, the monometallic case. In the upper spectrum, corresponding to pure carbon supported Cu NPs (Cu/C), two chemical components were necessary to fit the data. One at BE = 933.8 eV, that is related to Cu–O in CuO25,33 and the other at 932.0 eV due to Cu–Cu in Cu0. In the bimetallic samples this zero-valent component has been labelled Cu–M, where M can be Pd or Cu. When comparing the Cu 2p3/2 XPS measured for Cu/C to those obtained for the bimetallic samples, one can observe that a progressive shift to lower BE occurs for NPs with higher Pd concentration.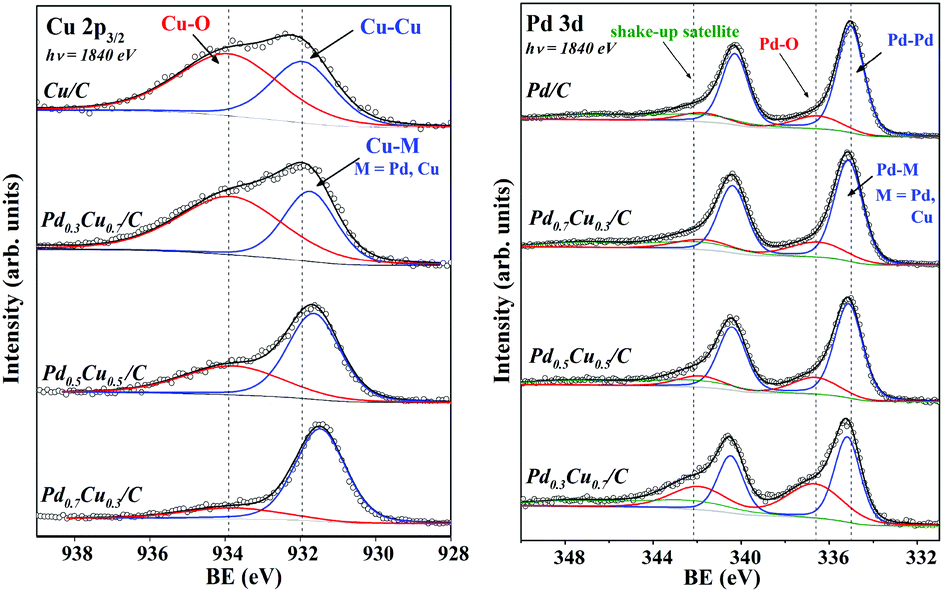 | ||
| Fig. 5 XPS spectra of the Cu 2p3/2 (left) and Pd 3d (right) regions of PdxCu1−x/C samples. The open circles indicate the raw data and the overlying continuous black lines represent the sum of the components (represented as colour lines). The grey lines represent the Shirley background. The vertical lines indicate the BE of the observed chemical components for the upper spectra. | ||
The BE shift in core-level electrons is typically observed in Pd–Cu alloys, and corroborates the alloy formation in the carbon supported PdxCu1−x NPs. It has been reported in both experimental and theoretical papers13,16–19 that, for bulk and thin-film Pd–Cu alloys, the magnitude of BE shifts (relative to the pure metallic Cu) observed for Cu 2p photoelectrons increase linearly with the Pd![[thin space (1/6-em)]](https://www.rsc.org/images/entities/char_2009.gif) :Cu ratio. This effect has been explained in terms of charge transfer upon the alloying between Pd and Cu species.13,16–19 A similar shift, but with a lower magnitude, has also been described for the Pd 3d electronic level in Pd–Cu alloys.13,17,19
:Cu ratio. This effect has been explained in terms of charge transfer upon the alloying between Pd and Cu species.13,16–19 A similar shift, but with a lower magnitude, has also been described for the Pd 3d electronic level in Pd–Cu alloys.13,17,19
In the Pd 3d photoemission spectrum of the Pd/C sample (upper spectrum to the right side of Fig. 5), three components were used, as labelled in the graph. The component at the lowest BE (335.2 eV) corresponds to Pd–Pd in Pd0.21,25,33 At a higher BE 7.2 eV, there is a 3d-electron shake-up satellite, which has been related to the zero-valent Pd.25,34 In the bimetallic samples this zero-valent component has been labelled Pd–M, where M can be Pd or Cu. Another peak was observed at 336.6 eV, which corresponds to Pd–O in PdO.25,34,35 For comparison, reference Pd, Cu and Pd0.6Cu0.4 (bulk alloy) were analysed under the same conditions. These results are available as the ESI.†
Fig. 6(a) shows a plot of the Cu 2p3/2 (left axis, red triangles) and Pd 3d5/2 (right axis, green circles) BE shift relative to the pure Cu and Pd NP dependence on the Pd concentration in the three as-prepared PdxCu1−x/C samples. The shift observed in the Cu 2p3/2 level towards lower BE values increases with the amount of Pd. Similarly, the Pd 3d5/2 shift towards lower BE values increases with the Cu amount.
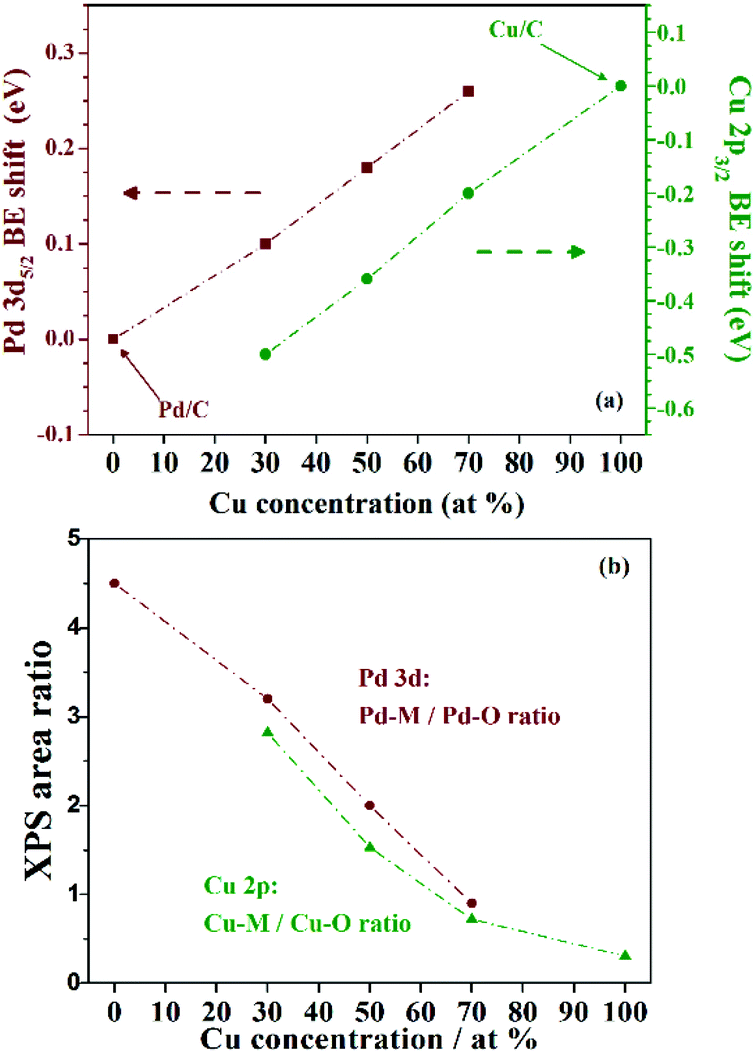 | ||
| Fig. 6 Dependence on the alloy composition of: (a) the Pd 3d5/2 (left axis, red triangles) and Cu 2p3/2 (right axis, green circles) BE shift relative to the BE measured for pure Pd and Cu NPs, respectively; and (b) the oxidation (in terms of the area ratio of the metallic and oxide components) of Cu (red triangles) and Pd (green circles) species in the NPs. | ||
It is noteworthy that the composition plays a significant role on the core-level electronic structure of the carbon supported PdxCu1−x alloy, and it might be responsible for changes in the reactivity during catalytic reactions. Here, XPS already evidenced that the NP oxidation rate due to exposition to air depends on the nanoalloy composition.
In fact, Fig. 5 qualitatively indicates that for higher Pd fractions, less oxidized are the Pd and Cu species on the nanoalloys. The XPS peak area ratio between the metallic and the oxide components can be used to estimate the degree of surface oxidation presented by the different NPs. The metallic to oxide ratios obtained from the XPS fitting of PdxCu1−x/C, and also of Pd/C and Cu/C are plotted in Fig. 6(b). The ratios obtained for the Cu 2p (green circles) and Pd 3d (red triangles) signals suggest a similar behaviour, stating that the nanoalloys were less (Cu case) or more (Pd case) oxidized than the monometallic counterparts. Thus the alloying between Pd and Cu species prevents the oxidation of Cu species, and the higher the Pd amount in the nanoalloys, the less oxidized are both the Pd and the Cu atoms.
3.5. In situ XANES experiments
In order to confirm the influence of charge transfer effects on the nanoalloy reactivity, XANES spectra were collected during the reaction under CO of Cu/C and Pd0.5Cu0.5/C samples (Fig. 7). In each graph, the absorption is presented as a function of the X-ray energy and the reaction temperature. The thermal treatment under CO induces the reduction of the Cu species present in both samples, as can be inferred from the increase of feature A and decrease of feature B, as well as from the arising structures C and D, which are typical of Cu0 8.36–38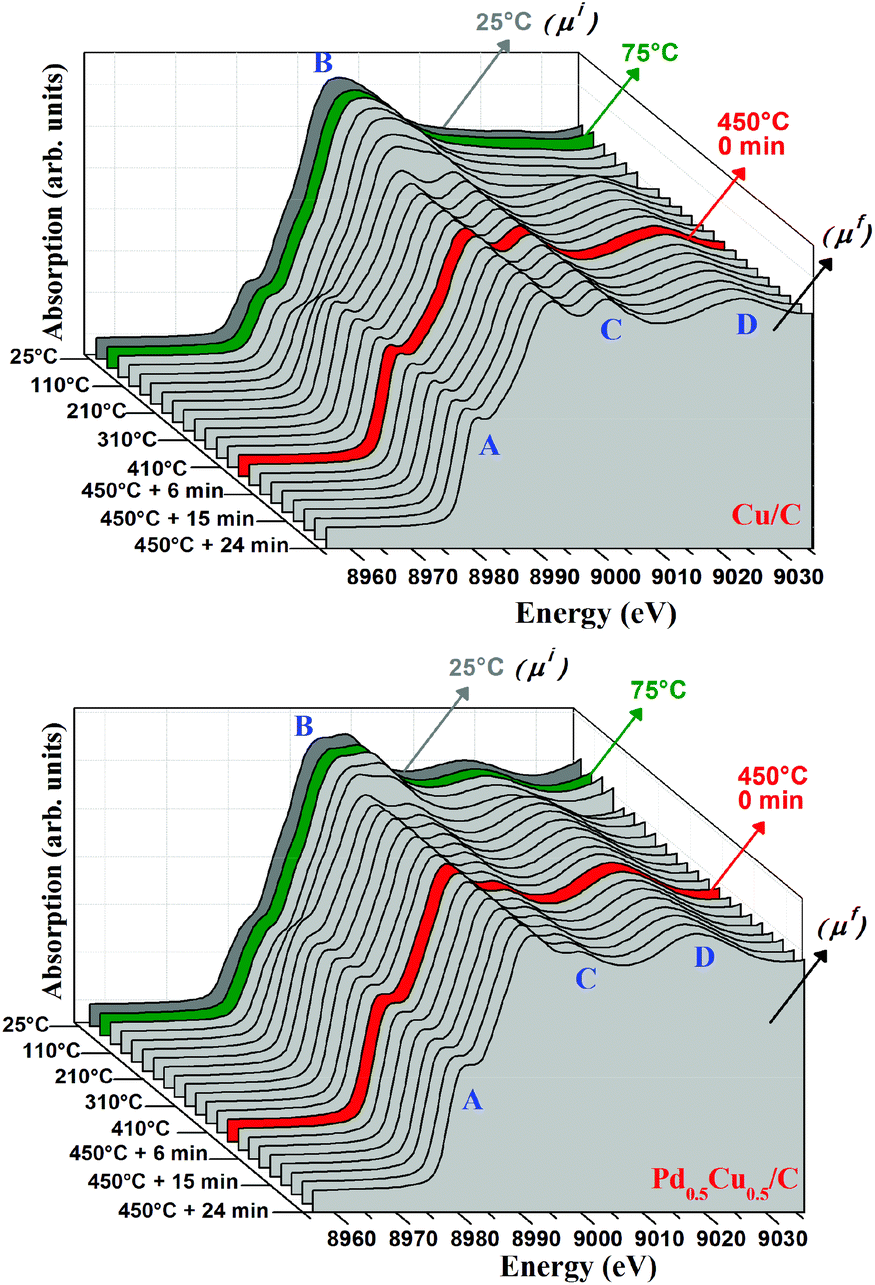 | ||
| Fig. 7 Evolution of the Cu–K edge XANES spectra collected for Cu/C (left) and Pd0.5Cu0.5/C during the reactions. | ||
To quantify the Cu0 contribution to each spectrum, linear combinations were performed for each sample using the final reduced spectrum of the respective sample (μf) and the CuO spectrum (μi). Examples of the linear combination done in this work can be seen in the ESI.†Fig. 8 presents the temperature dependence of reduced Cu contribution to the Cu–K edge XANES spectra collected for the PdxCu1−x/C samples during their exposure to He (from RT to 75 °C), and to CO (from 75 °C to 450 °C).
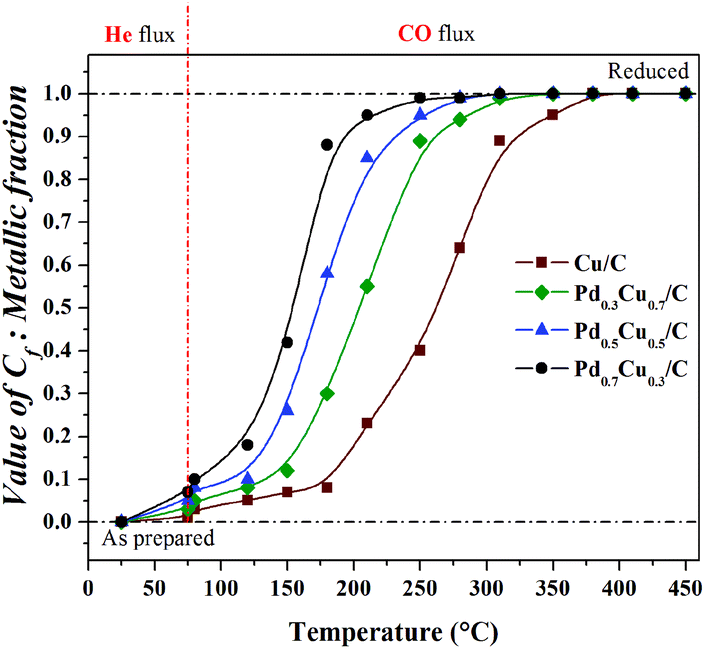 | ||
| Fig. 8 Temperature dependence of Cf coefficient used in linear combinations: measure of the reduced Cu atoms present on PdxCu1−x/C samples during heating under CO atmosphere. | ||
In Fig. 8, one can see that: (i) heating under a He flux and the exposure to CO at constant temperature did not induce significant changes in the chemical state of the Cu atoms present in the samples; (ii) all the samples were totally reduced during heating up to 450 °C under a CO flux; and (iii) the Cu-rich samples required higher temperatures to reach total reduction than the Pd-rich ones. This composition dependent behaviour, as well as the surface oxidation observed in the as-prepared samples by XPS, shows that the Pd-rich nanoalloys are less susceptible to oxidation than the Cu-rich ones. This composition dependent effect is related to the electronic structure modifications induced by alloying.
Conclusions
This work described a simple and eco-friendly method for obtaining carbon supported PdxCu1−x nanoalloys (x = 0.3, 0.5 and 0.7). The nanoalloys are highly crystalline with an average diameter of about 4 nm and their Pd:Cu ratios are in agreement with the expected metal loadings.
It was also demonstrated that the binding energy of the core-level states of both metal species depends on the nanoalloy composition. Such a charge transfer process between Pd and Cu atoms is able to prevent the NP oxidation due to air exposure, and the higher the Pd amount present in the nanoalloy, less oxidized are both the atoms. Additionally, the temperature required for a complete reduction of the nanoalloys under a CO flux at 450 °C takes place at lower temperatures for the Pd-rich samples.
Therefore, the core level signature of the charge transfer process between Pd and Cu envisages that the catalytic activity of the nanoalloys can be optimized by tailoring their composition. The observed effects may be used for tuning the PdxCu1−x/C reactivity and selectivity for other reactions in environmental catalysis or in electrocatalysis fields. Future investigations are planned in order to further deepen the understanding of the reactivity of these green-synthesized nanoalloys under different reactive conditions.
Acknowledgements
This work was funded by CAPES, CNPq, FAPERGS, LNLS (SXS-15314 and XAFS1-17120 proposals) and LNNano (TEM-HR-14037 and TEM-HR 15294 proposals). The authors would like to thank Dr Siham Ouardi, Dr Richard Landers and Dr Abner de Siervo for the metal foils used as references in this work, and to the LNLS, LNNano, LII-UFRGS, LCN-UFRGS and CME-UFRGS staff for their support. M. V. Castegnaro thanks CAPES and CAPES/DAAD/PROBRAL for his PhD fellowships.Notes and references
- Y. Wang, K. S. Chen, J. Mishler, S. C. Cho and X. C. Adroher, Appl. Energy, 2011, 88, 981 CrossRef CAS.
- T. S. Zhao, Y. S. Li and S. Y. Shen, Front. Energy Power Eng. China, 2010, 4, 443 CrossRef.
- N. N. Kariuki, X. Wang, J. R. Mawdsley, M. S. Ferrandon, S. G. Niyogi, J. T. Vaughey and D. J. Myers, Chem. Mater., 2010, 22, 4144 CrossRef CAS.
- H. L. Tierney, A. E. Baber and E. C. H. Sykes, J. Phys. Chem. C, 2009, 113, 7246 CAS.
- C. Xu, Y. Zhang, L. Wang, L. Xu, X. Bian, H. Ma and Y. Ding, Chem. Mater., 2009, 21, 3110 CrossRef CAS.
- C. Xu, Y. Liu, J. Wang, H. Geng and H. Qiu, J. Power Sources, 2012, 199, 124 CrossRef CAS.
- R. Ferrando, J. Jellinek and R. L. Johnston, Chem. Rev., 2008, 108, 845 CrossRef CAS PubMed.
- S. Shan, J. Luo, J. Wu, N. Kang, W. Zhao, H. Cronk, Y. Zhao, P. Joseph, V. Petkov and C.-J. Zhong, RSC Adv., 2014, 4, 42654 RSC.
- J. I. Park, M. G. Kim, Y. W. Jun, J. S. Lee, W. R. Lee and J. Cheon, J. Am. Chem. Soc., 2004, 126, 9072 CrossRef CAS PubMed.
- S. Alayoglu, A. U. Nilekar, M. Mavrikakis and B. Eichhorn, Nat. Mater., 2008, 7, 333 CrossRef CAS PubMed.
- K. A. Guy, H. Xu, J. C. Yang, C. J. Werth and J. R. Shapley, J. Phys. Chem. C, 2009, 113, 8177 CAS.
- M. Fernandez-Garcia, A. Martinez-Arias, C. Belver, J. A. Anderson, J. C. Conesa and J. Soria, J. Catal., 2000, 190, 387 CrossRef CAS.
- S. K. Sengar, B. R. Mehta and G. Gupta, Appl. Phys. Lett., 2011, 98, 193115 CrossRef.
- D. C. Martinez-Casillas, G. Vazquez-Huerta, J. F. Perez-Robles and O. Solorza-Feria, J. Power Sources, 2011, 196, 4468 CrossRef CAS.
- G. Mattei, C. Maurizio, P. Mazzoldi, F. D'Acapito, G. Battaglin, E. Cattaruzza, C. D. J. Fernandez and C. Sada, Phys. Rev. B: Condens. Matter, 2005, 71, 195418 CrossRef.
- S. Hu, L. Scudiero and S. Ha, Electrochim. Acta, 2012, 83, 354 CrossRef CAS.
- W. Olovsson, C. Goransson, L. V. Pourovskii, B. Johansson and I. A. Abrikosov, Phys. Rev. B: Condens. Matter, 2005, 72, 064203 CrossRef.
- G. G. Kleiman and R. Landers, J. Electron Spectrosc. Relat. Phenom., 1998, 88, 435 CrossRef.
- K. R. Harikumar, S. Ghosh and C. N. R. Rao, J. Phys. Chem. A, 1997, 101, 536 CrossRef CAS.
- A. de Siervo, E. A. Soares, R. Landers, T. A. Fazan, J. Morais and G. G. Kleiman, Surf. Sci., 2002, 504, 215 CrossRef CAS.
- M. V. Castegnaro, A. S. Kilian, I. M. Baibich, M. C. M. Alves and J. Morais, Langmuir, 2013, 29, 7125 CrossRef CAS PubMed.
- M. V. Castegnaro, J. Alexandre, I. M. Baibich, M. C. M. Alves and J. Morais, Mater. Res. Express, 2014, 1, 044001 CrossRef.
- F. C. Stedile and J. H. Z. dos Santos, Nucl. Instrum. Methods Phys. Res., Sect. B, 1998, 136, 1259 CrossRef.
- M. Abbate, F. C. Vicentin, V. Compagnon-Cailhol, M. C. Rocha and H. Tolentino, J. Synchrotron Radiat., 1999, 6, 964 CrossRef CAS.
- J. F. Moulder, W. F. Stickle, P. E. Sobol and K. D. Bomben, in Handbook of X-ray Photoelectron Spectroscopy, ed. J. Chastain, Perkin-Elmer Corporation, Eden Prairie, MN, 1992 Search PubMed.
- S. Tougaard and C. Jansson, Surf. Interface Anal., 1993, 20, 1013 CrossRef CAS.
- H. C. N. Tolentino, A. Y. Ramos, M. C. M. Alves, R. A. Barrea, E. Tamura, J. C. Cezar and N. Watanabe, J. Synchrotron Radiat., 2001, 8, 1040–1046 CrossRef CAS PubMed.
- B. Ravel and M. Newville, J. Synchrotron Radiat., 2005, 12, 537–541 CrossRef CAS PubMed.
- A. Martinez-Arias and M. Fernandez-Garcia, J. Phys. Chem. C, 2011, 115, 23237 CAS.
- F. Baletto and R. Ferrando, Rev. Mod. Phys., 2005, 77, 371 CrossRef CAS.
- F. Baletto, R. Ferrando, A. Fortunelli, F. Montalenti and C. Mottet, J. Chem. Phys., 2002, 116, 3856 CrossRef CAS.
- M. Friedrich and M. Armbruester, Chem. Mater., 2009, 21, 5886 CrossRef CAS.
- S. Poulston, P. M. Parlett, P. Stone and M. Bowker, Surf. Interface Anal., 1996, 24, 811 CrossRef CAS.
- A. S. Kilian, F. Bernardi, A. Pancotti, R. Landers, A. de Siervo and J. Morais, J. Phys. Chem. C, 2014, 118, 20452 CAS.
- A. Pancotti, A. de Siervo, M. F. Carazzolle, R. Landers and G. G. Kleiman, J. Electron Spectrosc. Relat. Phenom., 2007, 156, 307 CrossRef.
- L. Wang, J.-J. Zhai, K. Jiang, J.-Q. Wang and W.-B. Cai, Int. J. Hydrogen Energy, 2015, 40(4), 1726–1734 CrossRef CAS.
- M. FernandezGarcia, J. A. Anderson and G. L. Haller, J. Phys. Chem., 1996, 100, 16247 CrossRef CAS.
- A. Edelmann, W. Schiesser, H. Vinek and A. Jentys, Catal. Lett., 2000, 69(1–2), 11–16 CrossRef CAS.
Footnote |
| † Electronic supplementary information (ESI) available: TEM characterization of Pd0.3Cu0.7 and Pd0.7Cu0.3 nanoparticles; XPS spectra of metal foils; XANES linear combinations obtained for Cu/C and Pd0.5Cu0.5/C samples at 210 °C. See DOI: 10.1039/c5nr06685a |
| This journal is © The Royal Society of Chemistry 2016 |