Tuning photoluminescence and surface properties of carbon nanodots for chemical sensing†
Zhaomin
Zhang
,
Yi
Pan
,
Yaning
Fang
,
Lulu
Zhang
,
Junying
Chen
and
Changqing
Yi
*
Key Laboratory of Sensing Technology and Biomedical Instruments (Guangdong Province), School of Engineering, Sun Yat-Sen University, Guangzhou, China. E-mail: yichq@mail.sysu.edu.cn; Tel: +86-20-39342380
First published on 23rd November 2015
Abstract
Obtaining tunable photoluminescence (PL) with improved emission properties is crucial for successfully implementing fluorescent carbon nanodots (fCDs) in all practical applications such as multicolour imaging and multiplexed detection by a single excitation wavelength. In this study, we report a facile hydrothermal approach to adjust the PL peaks of fCDs from blue, green to orange by controlling the surface passivation reaction during the synthesis. This is achieved by tuning the passivating reagents in a step-by-step manner. The as-prepared fCDs with narrow size distribution show improved PL properties with different emission wavelengths. Detailed characterization of fCDs using elemental analysis, Fourier transform infrared spectroscopy, and X-ray photoelectron spectroscopy suggested that the surface chemical composition results in this tunable PL emission. Surface passivation significantly alters the surface status, resulting in fCDs with either stronger surface oxidation or N element doping that ultimately determine their PL properties. Further experiments suggested that the as-prepared orange luminescent fCDs (O-fCDs) were sensitive and specific nanosensing platforms towards Fe3+ determination in a complex biological environment, emphasizing their potential practical applications in clinical and biological fields.
1. Introduction
Fluorescent carbon nanodots (fCDs) which comprise a graphene-based core and carbonaceous surface, promote the development of high performance nanosensors, novel biomedical imaging probes, and multifunctional nano-composites for theranostics, because of their superior optical and nontoxic features.1–10 Various approaches, such as laser ablation, electrochemical etching, microwave and ultrasonic shearing, plasma-etching and pyrolysis, have been demonstrated to prepare fCDs with different emission wavelengths.4–10 Those attempts have significance for the development and applications of fCDs, but exploring approaches to synthesize fCDs with tunable emission is still a great challenge, due to the lack of sufficient theoretical and experimental knowledge on fCDs. The difficulty in preparing long-wavelength emissive fCDs constitutes another major disadvantage of current synthesis strategies.Obtaining tunable photoluminescence (PL) and improved quantum yields is crucial for successfully implementing fCDs in all practical applications such as multicolour imaging and multiplexed detection by a single excitation wavelength.11–33 It has been reported that most fCDs exhibit excitation-dependent PL characteristics where the emission-peaks shift towards longer wavelength with much weaker intensity than their dominant emission when varying the excitation wavelength bathochromically.27–33 However, that does not constitute true tuning and is usually undesired in practical applications.19 Therefore, tremendous effort has been made on developing rational strategies to investigate intrinsic PL properties of fCDs and thus tuning their emission.11–34 It has been reported that fCDs with luminescence emission across the entire visible spectrum can be finely tuned by controlling the dehydrating agents, the reaction temperature and time to control the nucleation and growth kinetics.16,19,20,22,26 Through simply adjusting the molar ratio of the reactants, the tunable emission of fCDs can be achieved using one-pot pyrolysis approaches.11,15,17 Doping fCDs with heteroatom such as N, S, or Se, is another important route to tune their PL properties.12–14 By varying the applied potentials and carbonization temperature using top-down strategies, fCD size can be tuned, and thus their PL properties.18,24,25 Despite this, continued efforts should be exerted to explore efficient strategies for synthesizing fCDs with tunable emission, especially with long-wavelength emission which favors the in vitro and in vivo bioimaging, since it is still elusive thus far.
Herein, we report a facile hydrothermal approach to adjust the PL peaks of fCDs from blue, green to orange by controlling the surface passivation reaction during the synthesis. This is achieved by tuning the passivating reagents in a step-by-step manner. Our synthetic route is illustrated in Fig. 1. Firstly, fCDs with blue emission (B-fCDs) were prepared by a one-step hydrothermal route using non-conjugated polymer PEG400 (polyethylene glycol (PEG) with a molecular weight of 400 g mol−1) as the sole carbon source.35 Then, PEG1000 (PEG with a molecular weight of 1000 g mol−1) was added into the reaction system for surface passivating the resultant B-fCDs to synthesize fCDs with green emission (G-fCDs). Finally, further surface passivation of the resultant G-fCDs with 2,2′-(ethylene-dioxy)-bis(ethylamine) (EDA, H2NCH2CH2OCH2CH2OCH2CH2NH2) enabled the preparation of fCDs with orange emission (O-fCDs). This new bottom-up synthetic strategy leads to highly stable crystalline fCDs with tunable PL and surface properties in high reproducibility. Moreover, the potential of the orange luminescent fCDs as a nanosensing platform towards sensitive Fe3+ detection was explored.
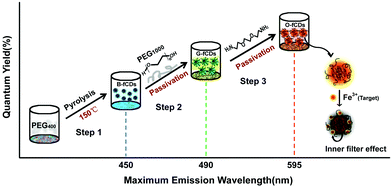 | ||
| Fig. 1 Schematic illustration of the synthetic routes for fCDs with different emission colors and the mechanism of O-fCDs as specific nanoprobes towards Fe3+ detection. | ||
2. Experimental
2.1 Apparatus
The morphology and size distribution of the fCDs were characterized with a transmission electron microscope (TEM, JEOL JEM-1400) and a NanoZS90 instrument (Malvern), respectively. UV-Vis, fluorescence and 1H NMR spectra were recorded using a DU730 UV-Vis spectrometer (Beckman), a Fluoromax-4P spectrometer (Horiba) and an INOVA500NB NMR spectrometer (Varian), respectively. Fluorescence lifetimes and the absolute quantum yields of the fCDs were measured on a Fluorolog-3 spectrometer equipped with Quanta-ϕ accessory and Photoluminescence Quantum Yields (PLQY) software package (Horiba). Characterization of fCD surface properties was conducted on a VERTEX 70 spectrometer (Bruker) and an ESCALab250 spectroscope (Thermo Fisher), respectively. Elemental analysis results were obtained on a VarioEL elemental analyzer (Elementar).2.2 Synthesis of fCDs with different emission colors
B-fCDs were synthesized by low temperature pyrolysis of PEG400 (Sinopharm Chemical Reagent Co., Ltd), according to a previous report by Fan and co-workers.35 Briefly, 15 mL PEG400 was added into a round-bottom flask and heated at 150 °C for 12 hours until a faint yellow solution was formed. The solution was subsequently subjected to dialysis for 3 days to collect B-fCDs. For the preparation of G-fCDs, 2 g PEG1000 was added into the above faint yellow solution and allowed to react for another 6 h at 150 °C, until a golden yellow solution was formed. Subsequently, the solution was subjected to dialysis for 3 days to collect G-fCDs. In order to obtain highly luminescent O-fCDs, 200 μL EDA was added into the above golden yellow solution and allowed to react for another 1.0–1.5 h at 150 °C, until a brown solution was formed. D.I. water was gradually added into the brown solution and centrifuged at 10![[thin space (1/6-em)]](https://www.rsc.org/images/entities/char_2009.gif) 000 rpm for 15 min. Then, the supernatant was subjected to dialysis for 3 days to collect O-fCDs. The as-prepared fCDs were purified by silica gel column chromatography, as described in detail elsewhere.29,36 Finally, the purified fCDs were lyophilized and stored at 4 °C before further usage.
000 rpm for 15 min. Then, the supernatant was subjected to dialysis for 3 days to collect O-fCDs. The as-prepared fCDs were purified by silica gel column chromatography, as described in detail elsewhere.29,36 Finally, the purified fCDs were lyophilized and stored at 4 °C before further usage.
2.3 Metal ion detection
The metal ion solutions were prepared from FeCl3, NiCl2, AgNO3, CoCl2, ZnCl2, CrCl3, CdCl2, AlCl3, Pb(NO3)2, HgCl2, GdCl3, Cu(AC)2, and Mn(SO4)2 in distilled water with a concentration of 50 μM. For metal ion detection, a calculated amount of Fe3+ (0, 1, 3, 5, 15, 20, 50, 100, 500, and 1000 μM) was added to 1 mL Tris-HCl buffer solution (10 mM, pH = 7.4) containing 500 μg O-fCDs, and allowed to react for 1 min under gentle shaking. Then, photographs were taken and fluorescence spectra were recorded. The interference assays were carried out by mixing 50.0 μM metal ions with the O-fCDs (500 μg mL−1) under optimized experimental conditions for the Fe3+ detection. All experiments were performed at room temperature.3. Results and discussion
3.1 Synthesis of fCDs with different emission colors
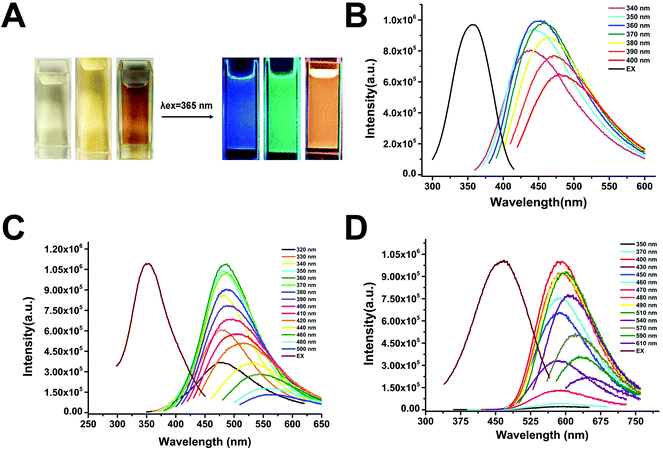
Due to its non-toxic and non-immunogenic features, PEG has been extensively used as a passivating agent or a solvent to fabricate biocompatible fCDs.35,37–39 Our synthetic route for fCDs with different emission colors starts from the B-fCDs which are prepared by a one-step hydrothermal route using PEG400 as the sole carbon source.35 After the hydrothermal reaction, the colorless and non-emissive PEG solution changed to faint yellow, where the resultant B-fCDs were well dispersed in water with transparent appearance and emitted blue PL under UV irradiation (Fig. 2A).Although the exact mechanism is still an open question, fCD's light emission can be attributed to quantum-size effects, emissive traps, structural defects induced by finite size and element doping, electron–hole recombination, and bandgap transitions corresponding to conjugated π-domains.5–10 It has been demonstrated that fCDs having the appropriate surface functionalization could become semiconductor-like to exhibit bandgap-like electronic transition.39,40 Therefore, it is possible to tune the quantum yield, life time, and the color of fCDs by passivating their surface. Enlightened by Sun's work, the surface passivation of B-fCDs using PEG1000 was carried out. As anticipated, after the surface passivation of B-fCDs using PEG1000, not only the emission color was turned to green (Fig. 2A), but also the life time was significantly increased from 1.54 ns to 4.76 ns (Fig. S1† and Table 1).
| Sample | Quantum yield (%) | Life time (ns) |
|---|---|---|
| B-fCDs | 4.61 | 1.54 |
| G-fCDs | 4.85 | 4.76 |
| O-fCDs | 5.32 | 7.74 |
It is believed that C–N bonds can alter the electronic structures of fCDs and/or generate additional low-energy band-gaps in fCDs, thus tuning their emission.13,14,16,26–28,39–42 And it has been reported recently that the energy gap in the fCDs relies on the relative amount of different types of carbon bonding with N and O.19 Therefore, in order to regulate the emission of fCDs towards longer wavelengths, EDA was chosen for further surface passivating G-fCDs.42 After the surface passivation reaction, the golden yellow solution of G-fCDs changed to a brown solution which contains highly dispersible O-fCDs (Fig. 2A). Again, as expected, the emission color of fCDs was turned to orange (Fig. 2A), and the life time was further increased to 7.74 ns (Fig. S1† and Table 1).
As designed, the prepared fCDs exhibited different emission colors (blue, green and orange) under single-wavelength UV irradiation (Fig. 2A). The strongest emission peaks of B-fCDs, G-fCDs and O-fCDs which reflect their dominant energy gap are around 450, 490, and 590 nm at the max excitation wavelength of 360, 360, 470 nm, respectively (Fig. 2B–D). All fCDs exhibited a characteristic wavelength-dependent emission, for example, the emission peak of O-fCDs shifted from 590 to 640 nm under 400–610 nm excitation (Fig. 2D), which may be attributed to a quantum confinement of emissive energy traps to the particle surface.36–40 The exact fluorescence lifetimes for B-fCDs, G-fCDs and O-fCDs are listed in Table 1. The fluorescence lifetime of fCDs was significantly increased from 1.54 to 7.74 ns, possibly due to the suppression of non-radiative energy transitions induced by surface passivation.12 All the prepared fCDs have fluorescence lifetimes within the timescale of ns, indicating the singlet state nature of their emission.19 Not only the fluorescence lifetime, but also the quantum yield (QY) of fCDs was obviously increased through step-by-step surface passivation, where the QYs of B-fCDs, G-fCDs and O-fCDs were 4.61%, 4.85% and 5.31%, respectively. It is believed that the transformation of the pyrrolic N into graphite N under the hydrothermal condition can significantly improve the QY of fCDs.44 All these results validate the significantly improved PL properties of fCDs through surface passivation.
3.2 Characterization of fCDs with different emission colors
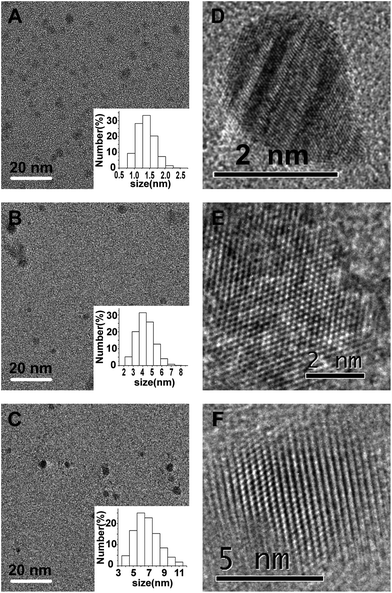
According to TEM observation, all the prepared fCDs are uniform in size, spherical in shape, and well dispersed in water (Fig. 3A–C). Dynamic light scattering (DLS) measurements reveal that B-fCDs, G-fCDs and O-fCDs exhibit narrow size distribution in the range of 0.8–2.2, 2.0–7.0, and 4.0–10.0 nm, and have an average diameter of 1.5, 4.5 and 6.5 nm, respectively (insets of Fig. 3A–C). As shown in the high-resolution TEM images, all the prepared fCDs, including B-fCDs, G-fCDs and O-fCDs, have lattice spacing of 0.20–0.22 nm which is consistent with that of (100) diffraction planes of graphite (Fig. 3D–F), suggesting the surface passivation did not change the core crystalline structure of fCDs. These results are well correlated with the selected-area electron diffraction (SAED) patterns of B-fCDs, G-fCDs and O-fCDs (Fig. S2†).Engineering the surface compositions of fCDs plays key roles not only in regulating their emission through tailoring their surface-related defective sites, but also in connecting fCDs with fascinating applications.1 The surface chemical compositions of fCDs were characterized by elemental analysis, FTIR and XPS. The elemental analysis shows that all fCDs contain C, H, and O elements, while additional N element is presented in O-fCDs (Table S1†). It is obvious from the elemental analysis results that all fCDs consist predominantly of C and O elements. In our synthetic route, more O element is expected to be incorporated into the fCD's surface after the first step surface passivating B-fCDs with PEG1000 to produce G-fCDs. In the second step surface passivation using EDA as the passivation reagent, N element is expected to be doped into the resultant O-fCD's surface, thus changing the relative amount of carbon bonding with N and O. The composition variation correlated well with our synthetic route (Table S1†).
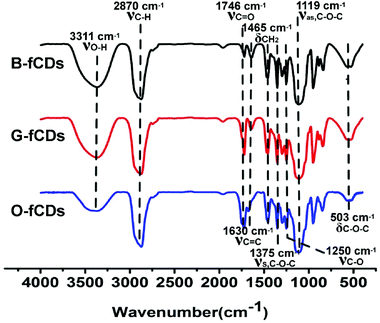
To further investigate the surface composition and their chemical state, fCDs were characterized by FTIR. The FTIR spectra of B-fCDs, G-fCDs and O-fCDs are presented in Fig. 4, revealing the existence of sufficient hydrophilic oxygen-containing functional groups. The broad band at ca. 3311 cm−1 is ascribed to the stretching vibration of −OH, whereas the bands at ca. 1375, 1119, and 503 cm−1 correspond to the asymmetric and symmetric stretching vibration, and the bending vibration of C–O–C, respectively. The band at ca. 1746 cm−1 is ascribed to the stretching vibration of C![[double bond, length as m-dash]](https://www.rsc.org/images/entities/char_e001.gif) O. These oxygen-containing functional groups on fCDs surface were originated from the PEG which cracked into small fragments containing the glycol structure during the hydrothermal synthesis,35 since the dehydration and carbonization are the major formation paths of fCDs.5–10 Compared to B-fCDs, the absorption peak of νC
O. These oxygen-containing functional groups on fCDs surface were originated from the PEG which cracked into small fragments containing the glycol structure during the hydrothermal synthesis,35 since the dehydration and carbonization are the major formation paths of fCDs.5–10 Compared to B-fCDs, the absorption peak of νC![[double bond, length as m-dash]](https://www.rsc.org/images/entities/char_e001.gif) O at ca. 1746 cm−1 with significantly enhanced intensity and the absorption peak of νO–H at ca. 3311 cm−1 with obviously weakened intensity, was observed in the FTIR spectra of G-fCDs and O-fCDs. This result is quite important and provides strong evidence for successful surface oxidation of B-fCDs, since the hydrothermal process can generate lots of peroxyl radicals (HOO˙) which can oxidize the surface hydroxyl groups into carbonyl groups.35,43 It has been reported previously that a higher degree of surface oxidation leads to the red-shifted PL emission, because surface defects caused by surface oxidation could introduce emission sites onto fCDs, thus varying the PL emission.24
O at ca. 1746 cm−1 with significantly enhanced intensity and the absorption peak of νO–H at ca. 3311 cm−1 with obviously weakened intensity, was observed in the FTIR spectra of G-fCDs and O-fCDs. This result is quite important and provides strong evidence for successful surface oxidation of B-fCDs, since the hydrothermal process can generate lots of peroxyl radicals (HOO˙) which can oxidize the surface hydroxyl groups into carbonyl groups.35,43 It has been reported previously that a higher degree of surface oxidation leads to the red-shifted PL emission, because surface defects caused by surface oxidation could introduce emission sites onto fCDs, thus varying the PL emission.24
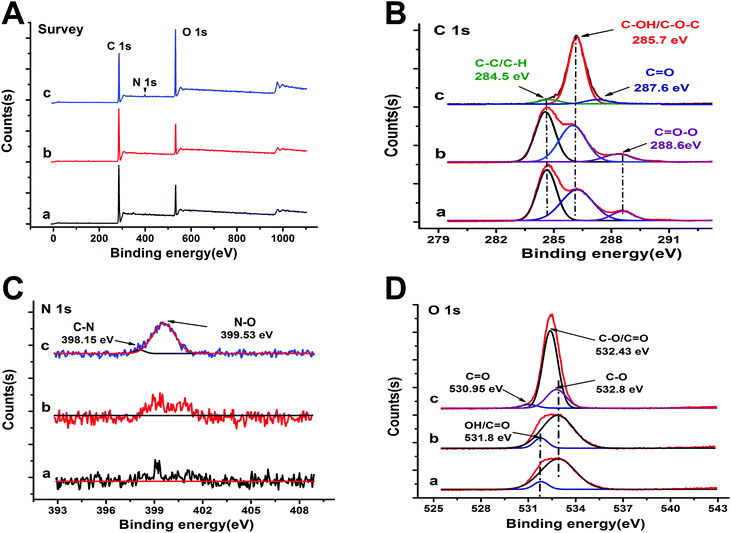
XPS survey spectra confirm that B-fCDs and G-fCDs have the same elemental composition, showing the characteristic peaks corresponding to C 1s (286.2 eV) and O 1s (532.4 eV), while, as expected, O-fCDs showed an additional characteristic peak corresponding to N 1s (399.5 eV), confirming the successful doping of N element after the second step surface passivation using EDA (Fig. 5A). The deconvoluted XPS C 1s spectra presenting a peak at the binding energy of ∼284.5 eV indicates the presence of graphitic sp2 carbon structure in all fCDs (Fig. 5B),17,28 which agree well with SAED pattern results. The dominant peak centered at binding energies of 285.7 eV and the shoulder peak centered at binding energies of 288.6 eV is attributed to C–O and C![[double bond, length as m-dash]](https://www.rsc.org/images/entities/char_e001.gif) O groups, respectively (Fig. 5B). It is obvious from the change of the C
O groups, respectively (Fig. 5B). It is obvious from the change of the C![[double bond, length as m-dash]](https://www.rsc.org/images/entities/char_e001.gif) O group intensity in Fig. 5B that the surface oxidation degree was continuously deepened along with the step-by-step surface passivation reactions. These results confirm the presence of sufficient hydrophilic oxygen-containing functional groups on the fCD's surface, correlating well with the FTIR result (Fig. 4). And the diversity of oxygen containing functional groups possibly result in different emitting species in fCDs.12,19 The high-resolution XPS N 1s spectra of O-fCDs exhibited a peak at 399.5 eV corresponding to N–O, while no such peak could be detected for B-fCDs and G-fCDs (Fig. 5C). One peak centered at binding energies of ∼532 eV which is attributed to C–O groups, is presented in the deconvoluted O 1s XPS spectra (Fig. 5D).
O group intensity in Fig. 5B that the surface oxidation degree was continuously deepened along with the step-by-step surface passivation reactions. These results confirm the presence of sufficient hydrophilic oxygen-containing functional groups on the fCD's surface, correlating well with the FTIR result (Fig. 4). And the diversity of oxygen containing functional groups possibly result in different emitting species in fCDs.12,19 The high-resolution XPS N 1s spectra of O-fCDs exhibited a peak at 399.5 eV corresponding to N–O, while no such peak could be detected for B-fCDs and G-fCDs (Fig. 5C). One peak centered at binding energies of ∼532 eV which is attributed to C–O groups, is presented in the deconvoluted O 1s XPS spectra (Fig. 5D).
Through carefully analysis of the above elemental analysis, FTIR and XPS data, the possible mechanism for tuning PL emission through step-by-step surface passivation is proposed. During hydrothermal synthesis, the PEG is cracked into small fragments containing the glycol structure for forming B-fCDs through dehydration and carbonization. In the first step surface passivation of B-fCDs using PEG1000, the surface of B-fCDs is oxidized possibly by peroxyl radicals (HOO˙) which are generated by the hydrothermal process.35,43 Since surface oxidation can bring more surface defects and introduce more emission sites onto fCDs,24 the PL emission of B-fCDs can be tuned to longer wavelengths to form G-fCDs. The FTIR results that the significantly enhanced absorption peak of νC![[double bond, length as m-dash]](https://www.rsc.org/images/entities/char_e001.gif) O and the obviously weakened absorption peak of νO–H, strongly support the oxidization of surface hydroxyl groups into carbonyl groups (Fig. 4A). And the elemental analysis results showing that the oxygen-to-carbon ratio of fCDs is increased from 0.777 to 0.781 after the surface passivation also support our hypothesis. Then, in the second step surface passivation of G-fCDs using EDA, the surface of G-fCDs is doped with N elements. Since doping N elements can alter the electronic structures of fCDs and/or generate additional low-energy band-gaps in fCDs,13,14,16,26–28,39–42 the PL emission of G-fCDs can be tuned to longer wavelengths to form O-fCDs. The presence of a peak corresponding to C–N in the XPS spectra and the elemental analysis result, provide strong evidence for successful N-doping in O-fCDs. Actually, N-doping might be a determinant factor for the synthesis of long-wavelength emissive fCDs, since no fCDs with emission wavelengths longer than 570 nm can be synthesized without heteroatom (N, S, P, Se etc.) doping thus far. Therefore, surface passivation significantly alters the surface status, resulting in fCDs with either stronger surface oxidation or N element doping that ultimately determine their photoluminescence properties. These relationships are believed, at least partially, to be responsible for this tunable PL emission of fCDs, and may help the community to control their PL properties. Definitely, more in depth studies are still required for further elucidation.
O and the obviously weakened absorption peak of νO–H, strongly support the oxidization of surface hydroxyl groups into carbonyl groups (Fig. 4A). And the elemental analysis results showing that the oxygen-to-carbon ratio of fCDs is increased from 0.777 to 0.781 after the surface passivation also support our hypothesis. Then, in the second step surface passivation of G-fCDs using EDA, the surface of G-fCDs is doped with N elements. Since doping N elements can alter the electronic structures of fCDs and/or generate additional low-energy band-gaps in fCDs,13,14,16,26–28,39–42 the PL emission of G-fCDs can be tuned to longer wavelengths to form O-fCDs. The presence of a peak corresponding to C–N in the XPS spectra and the elemental analysis result, provide strong evidence for successful N-doping in O-fCDs. Actually, N-doping might be a determinant factor for the synthesis of long-wavelength emissive fCDs, since no fCDs with emission wavelengths longer than 570 nm can be synthesized without heteroatom (N, S, P, Se etc.) doping thus far. Therefore, surface passivation significantly alters the surface status, resulting in fCDs with either stronger surface oxidation or N element doping that ultimately determine their photoluminescence properties. These relationships are believed, at least partially, to be responsible for this tunable PL emission of fCDs, and may help the community to control their PL properties. Definitely, more in depth studies are still required for further elucidation.
3.3 Detection of Fe3+
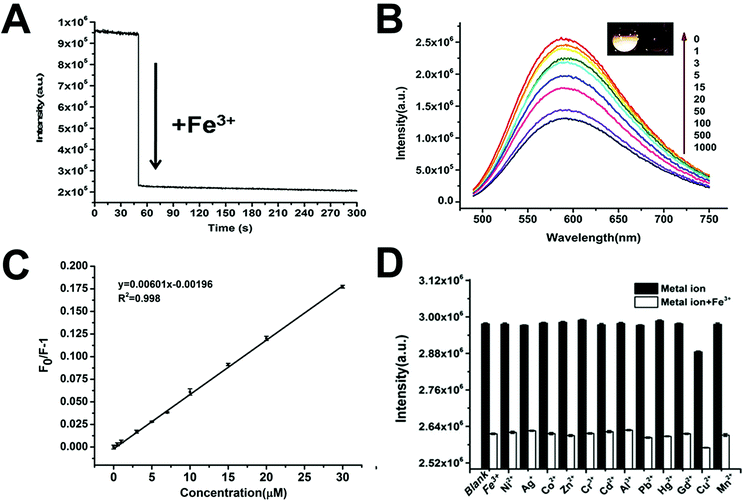
The oxygen functional groups on the surface of fCDs can not only facilitate their high water solubility, but also provide a possibility as a nanosensing platform for the metal ion detection due to the strong coordination between the oxygen functional groups and metal ions.11,12,45–48 Considering that long-wavelength PL and excitation are critical and needed in biomedical detection and bioimaging, we explored the feasibility of the O-fCDs as an optical nanoprobe for the detection of metal ions in aqueous solutions. As shown in Fig. 6A, when 50.0 μM Fe3+ ions were introduced into the solution containing 500 μg mL−1 of O-fCDs, a dramatic PL quenching was observed within 5 seconds, suggesting the rapid response of the present nanosensing system towards Fe3+. The PL intensity of O-fCDs at 595 nm decreases linearly along with the increase of the Fe3+ concentration from 0.5 to 30.0 μM, while the quantification of Fe3+ could be achieved with a correlation coefficient of 0.998, indicating the excellent sensing properties towards trace Fe3+ detection (Fig. 6B and C). The fluorescence quenching data follow the Stern–Volmer equation: F0/F = 1 + K[Q] (Fig. 6C), where [Q] is the concentration of Fe3+, and F0 and F are the PL intensities of O-fCDs at 595 nm in the absence and presence of Fe3+, respectively. The lowest detection limit (LOD) is calculated to be 0.43 μM based on the standard deviation (SD) of the response and the slope (S) of the calibration curve at levels approximating the LOD according to the formula: LOD = 3.0 (SD/S). It has been reported that the concentration of Fe3+ in serum is in the range of 7.52–11.8 mM, therefore, the O-fCD based sensing platform can satisfy the requirements of biomedical analysis such as iron metabolism monitoring and anemia diagnosis.The response of O-fCDs towards other metal ions, including Ag+, Cu2+, Zn2+, Co2+, Hg2+, Al3+, Mn2+, Pb2+, Cd2+, Cr3+, Gd3+ and Ni2+, was investigated in the absence and presence of Fe3+, in order to evaluate the specificity of the present nanosensing platform. As shown in Fig. 6D, no obvious PL changes were observed for any inspected metal ions, except that a small interference on the O-fCD-based nanosensing platform was detected for Cu2+. Anyway, Fe3+ shows the most obvious quenching effect on the PL intensity of O-fCDs, as compared with other metal ions. The high sensitivity together with the high specificity which might be attributed to the strong affinity between Fe3+ and oxygen-containing groups on the O-fCD surface,12,46,47 enables the O-fCD a promising nanosensing platform for Fe3+ detection with high efficiency.
Recently, tremendous attention has been paid on developing new probes for Fe3+ detection in biomedical samples with higher efficiency, because as an indispensable metal in life forms, deficiency or excess accumulation of Fe3+ would induce serious health problems.49–56 Compared to the other reported Fe3+ sensing platform, the present O-fCD based nanosensing platform showed a better performance, such as wider detection range, rapider response, and especially longer wavelength excitation which favors the biomedical detection (Table S2†), emphasizing its potential applications in bioanalysis and biomedical detection.
To test the practicality of the O-fCD based nanosensing platform, we extended it to determine the concentration of Fe3+ in human serum. As an internationally recognized standard method, inductively coupled plasma mass spectrometry (ICP-MS) experiments were performed to determine the Fe3+ content in the same human serum samples. The PL intensity of O-fCDs decreased when the human serum samples were spiked with Fe3+ standard solutions. The recoveries of Fe3+ in all samples were in the range of 100–103% (Table 2), and there was no systematic difference between the present method and ICP-MS as suggested by a paired Student's t-test. These results illustrate the feasibility and capabilities of the O-fCD based nanosensing platform for the determination of Fe3+ in a complicated biological environment.
| Sample | Spiked (μM) | Found by ICP-MS (μM) | Found by the present assay (μM) | Recovery ± SD (%, n = 3) |
|---|---|---|---|---|
| Human serum 1 | 0 | 9.87 | 10.17 ± 0.06 | 103.04 ± 0.60 |
| Human serum 2 | 14.61 | 23.96 | 24.55 ± 0.09 | 100.26 ± 0.38 |
| Human serum 3 | 16.56 | 25.77 | 27.16 ± 0.28 | 102.76 ± 1.08 |
4. Conclusions
In summary, a facile hydrothermal approach is illustrated to adjust PL peaks of fCDs from blue, green to orange by tuning the passivating reagents in a step-by-step manner during the synthesis. Surface passivation significantly alters the surface status, resulting in fCDs with either stronger surface oxidation or N element doping that ultimately determine their PL properties. Further experiments demonstrate the feasibility and capabilities of the O-fCD based nanosensing platform for the determination of Fe3+ with high sensitivity and specificity in a complicated biological environment, providing an opportunity for its practical applications in clinical and biological fields.Acknowledgements
The financial support from the Pearl River S&T Nova Program of Guangzhou (2013J2200053), Tip-top Scientific and Technical Innovative Youth Talents of Guangdong special support program (2014TQ01R417), and Guangdong Innovative Research Team Program (2009010057) is gratefully acknowledged.Notes and references
- C. Q. Ding, A. W. Zhu and Y. Tian, Acc. Chem. Res., 2014, 47, 20 CrossRef CAS PubMed.
- H. Li, Z. Kang, Y. Liu and S. T. Lee, J. Mater. Chem., 2012, 22, 24230 RSC.
- H. J. Sun, L. Wu, W. L. Wei and X. G. Qu, Mater. Today, 2013, 16, 433 CrossRef CAS.
- S. N. Baker and G. A. Baker, Angew. Chem., Int. Ed., 2010, 49, 6726 CrossRef CAS PubMed.
- P. G. Luo, S. Sahu, S. T. Yang, S. K. Sonkar, J. P. Wang, H. F. Wang, G. E. LeCroy, L. Cao and Y. P. Sun, J. Mater. Chem. B, 2013, 1, 2116 RSC.
- L. P. Lin, M. C. Rong, F. Luo, D. M. Chen, Y. R. Wang and X. Chen, TrAC, Trends Anal. Chem., 2014, 54, 83 CrossRef CAS.
- Y. F. Wang and A. G. Hu, J. Mater. Chem. C, 2014, 2, 6921 RSC.
- K. Hola, Y. Zhang, Y. Wang, E. P. Giannelis, R. Zboril and A. L. Rogach, Nano Today, 2014, 9, 590 CrossRef CAS.
- Y. F. Wang and A. G. Hu, J. Mater. Chem. C, 2014, 2, 6921 RSC.
- S. Y. Lim, W. Shen and Z. Q. Gao, Chem. Soc. Rev., 2015, 44, 362 RSC.
- H. Y. Liu, Z. M. He, L. P. Jiang and J. J. Zhu, ACS Appl. Mater. Interfaces, 2015, 7, 4913 Search PubMed.
- S. W. Yang, J. Sun, X. B. Li, W. Zhou, Z. Y. Wang, P. He, G. Q. Ding, X. M. Xie, Z. H. Kang and M. H. Jiang, J. Mater. Chem. A, 2014, 2, 8660 RSC.
- S. Do, W. Kwon and S. W. Rhee, J. Mater. Chem. C, 2014, 2, 4221 RSC.
- D. Sun, R. Ban, P. H. Zhang, G. H. Wu, J. R. Zhang and J. J. Zhu, Carbon, 2013, 64, 424 CrossRef CAS.
- J. Zhou, Y. Yang and C. Y. Zhang, Chem. Commun., 2013, 49, 8605 RSC.
- Y. Q. Zhang, D. K. Ma, Y. Zhuang, X. Zhang, W. Chen, L. L. Hong, Q. X. Yan, K. Yu and S. M. Huang, J. Mater. Chem., 2012, 22, 16714 RSC.
- Z. C. Yang, M. Wang, A. M. Yong, S. Y. Wong, X. H. Zhang, H. Tan, A. Y. Chang, X. Li and J. Wang, Chem. Commun., 2011, 47, 11615 RSC.
- C. Hu, C. Yu, M. Y. Li, X. N. Wang, J. Y. Yang and Z. B. Zhao, Small, 2014, 10, 4926 CrossRef CAS PubMed.
- S. L. Hu, A. Trinchi, P. Atkin and I. Cole, Angew. Chem., Int. Ed., 2015, 54, 2970 CrossRef CAS PubMed.
- L. Bao, C. Liu, Z. L. Zhang and D. W. Pang, Adv. Mater., 2015, 27, 1663 CrossRef CAS PubMed.
- B. P. Qi, H. Hu, L. Bao, Z. L. Zhang, B. Tang, Y. Peng, B. S. Wang and D. W. Pang, Nanoscale, 2015, 7, 5969 RSC.
- K. Jiang, S. Sun, L. Zhang, Y. Lu, A. G. Wu, C. Z. Cai and H. W. Lin, Angew. Chem., Int. Ed., 2015, 54, 5360 CrossRef CAS PubMed.
- S. J. Zhu, J. H. Zhang, S. J. Tang, C. Y. Qiao, L. Wang, H. Y. Wang, X. Liu, B. Li, Y. F. Li, W. L. Yu, X. F. Wang, H. C. Sun and B. Yang, Adv. Funct. Mater., 2012, 22, 4732 CrossRef CAS.
- L. Bao, Z. L. Zhang, Z. Q. Tian, L. Zhang, C. Liu, Y. Lin, B. P. Qi and D. W. Pang, Adv. Mater., 2015, 23, 5801 CrossRef PubMed.
- X. H. Li and Z. W. Zhao, RSC Adv., 2014, 4, 57615 RSC.
- S. K. Bhunia, A. Saha, A. R. Maity, S. C. Ray and N. R. Jana, Sci. Rep., 2013, 3, 1473 CrossRef PubMed.
- H. Tetsuka, R. Asahi, A. Nagoya, K. Okamoto, I. Tajima, R. Ohta and A. Okamoto, Adv. Mater., 2012, 24, 5333 CrossRef CAS PubMed.
- Y. Q. Dong, R. X. Wang, H. Li, J. W. Shao, Y. W. Chi, X. M. Lin and G. N. Chen, Carbon, 2012, 50, 2810 CrossRef CAS.
- Z. C. Yang, M. Wang, A. M. Yong, S. Y. Wong, X. H. Zhang, H. Tan, A. Y. Chang, X. Li and Y. Wang, Chem. Commun., 2011, 47, 11615 RSC.
- S. H. Jin, D. H. Kim, G. H. Jun, S. H. Hong and S. Jeon, ACS Nano, 2013, 7, 1239 CrossRef CAS PubMed.
- S. Zhu, Q. Meng, L. Wang, J. Zhang, Y. Song, H. Jin, K. Zhang, H. Sun, H. Wang and B. Yang, Angew. Chem., Int. Ed., 2013, 52, 3953 CrossRef CAS PubMed.
- Y. P. Shi, Y. Pan, H. Zhang, Z. M. Zhang, M. J. Li, C. Q. Yi and M. S. Yang, Biosens. Bioelectron., 2014, 56, 39 CrossRef CAS PubMed.
- Z. M. Zhang, Y. P. Shi, Y. Pan, X. Cheng, L. L. Zhang, J. Y. Chen, M. Li and C. Q. Yi, J. Mater. Chem. B, 2014, 2, 5020 RSC.
- V. Strauss, J. T. Margraf, C. Dolle, B. Butz, T. J. Nacken, J. Walter, W. Bauer, W. Peukert, E. Spiecker, T. Clark and D. M. Guldi, J. Am. Chem. Soc., 2014, 136, 17308 CrossRef CAS PubMed.
- R. J. Fan, Q. Sun, L. Zhang, Y. Zhang and A. H. Lu, Carbon, 2014, 71, 87 CrossRef CAS.
- Y. P. Shi, Y. Pan, J. Zhong, J. Yang, J. H. Zheng, J. L. Cheng, R. Song and C. Q. Yi, Carbon, 2015, 93, 742 CrossRef CAS.
- A. S. Karakoti, S. Das, S. Thevuthasan and S. Seal, Angew. Chem., Int. Ed., 2011, 50, 1980 CrossRef CAS PubMed.
- R. L. Liu, D. Q. Wu, S. H. Liu, K. Koynov, W. Knoll and Q. Li, Angew. Chem., Int. Ed., 2009, 48, 4598 CrossRef CAS PubMed.
- Y. P. Sun, B. Zhou, Y. Lin, W. Wang, K. A. S. Fernando, P. Pathak, M. J. Meziani, B. A. Harruff, X. Wang, H. F. Wang, P. J. G. Luo, H. Yang, M. E. Kose, B. L. Chen, L. M. Veca and S. Y. Xie, J. Am. Chem. Soc., 2006, 128, 7756 CrossRef CAS PubMed.
- X. Wang, L. Cao, S. T. Yang, F. S. Lu, M. J. Meziani, L. L. Tian and K. W. Sun, Angew. Chem., Int. Ed., 2010, 49, 5310 CrossRef CAS PubMed.
- L. Cao, X. Wang, M. J. Meziani, F. Lu, H. Wang, P. G. Luo, Y. Lin, B. A. Harruff, L. M. Veca, D. Murray, S. Y. Xie and Y. P. Sun, J. Am. Chem. Soc., 2007, 129, 11318 CrossRef CAS PubMed.
- G. E. LeCroy, S. K. Sonkar, F. Yang, L. M. Veca, P. Wang, K. N. Tackett, J. J. Yu, E. Vasile, H. J. Qian, Y. M. Liu, P. J. Luo and Y. P. Sun, ACS Nano, 2014, 8, 4522 CrossRef CAS PubMed.
- S. Zhu, S. Tang, J. Zhang and B. Yang, Chem. Commun., 2012, 48, 4527 RSC.
- D. Qu, M. Zheng, L. G. Zhang, H. F. Zhao, Z. G. Xie, X. B. Jing, R. E. Haddad, H. Y. Fan and Z. C. Sun, Sci. Rep., 2014, 4, 5294 CrossRef CAS PubMed.
- C. F. Wang, D. Sun, K. L. Zhuo, H. C. Zhang and J. J. Wang, RSC Adv., 2014, 4, 54060 RSC.
- Y. Liu, N. Xiao, N. Q. Gong, H. Wang, X. Shi, W. Gu and L. Ye, Carbon, 2014, 68, 258 CrossRef CAS.
- Y. L. Zhang, L. Wang, H. C. Zhang, Y. Liu, H. Y. Wang, Z. H. Kang and S. T. Lee, RSC Adv., 2013, 3, 3733 RSC.
- Y. B. Song, S. J. Zhu, S. Y. Xiang, X. H. Zhao, J. H. Zhang, H. Zhang, Y. Fu and B. Yang, Nanoscale, 2014, 6, 4676 RSC.
- Y. Y. Du, M. Chen, Y. X. Zhang, F. Luo, C. Y. He, M. J. Li and X. Chen, Talanta, 2013, 106, 261 CrossRef CAS PubMed.
- R. R. Crichton, D. T. Dexter and R. J. Ward, Monatsh. Chem., 2011, 142, 341 CrossRef CAS.
- R. H. Crabtree, Science, 1994, 266, 1591 CrossRef CAS PubMed.
- D. Carolan and H. Doyle, Nanoscale, 2015, 7, 5488 RSC.
- L. He, J. N. Li and J. H. Xin, Biosens. Bioelectron., 2015, 70, 69 CrossRef CAS PubMed.
- A. Ananthanarayanan, X. W. Wang, P. Routh, B. Sana, S. Lim, D. H. Kim, K. H. Lim, J. Li and P. Chen, Adv. Funct. Mater., 2014, 24, 3021 CrossRef CAS.
- S. W. Zhang, J. X. Li, M. Y. Zeng, J. Z. Xu, X. K. Wang and W. P. Hu, Nanoscale, 2014, 6, 4157 RSC.
- S. N. Qu, H. Chen, X. M. Zheng, J. S. Cao and X. Y. Liu, Nanoscale, 2013, 5, 5514 RSC.
Footnote |
| † Electronic supplementary information (ESI) available. See DOI: 10.1039/c5nr06534h |
| This journal is © The Royal Society of Chemistry 2016 |

