
 Open Access Article
 This Open Access Article is licensed under a
 Creative Commons Attribution 3.0 Unported Licence
Detection of nerve gases using surface-enhanced Raman scattering substrates with high droplet adhesion†
Aron
Hakonen
*a,
Tomas
Rindzevicius
b,
Michael Stenbæk
Schmidt
b,
Per Ola
Andersson
c,
Lars
Juhlin
c,
Mikael
Svedendahl
a,
Anja
Boisen
b and
Mikael
Käll
a
aDepartment of Applied Physics, Chalmers University of Technology, Gothenburg, Sweden. E-mail: Hakonen@chalmers.se
bDTU Nanotech, Technical University of Denmark, Department of Micro- and Nanotechnology, Ørsteds Plads, Building 345 east, 2800 Kgs. Lyngby, Denmark
cSwedish Defense Research Agency FOI, Dept CBRN Def & Security, SE-90182 Umeå, Sweden
First published on 10th December 2015
Abstract
Threats from chemical warfare agents, commonly known as nerve gases, constitute a serious security issue of increasing global concern because of surging terrorist activity worldwide. However, nerve gases are difficult to detect using current analytical tools and outside dedicated laboratories. Here we demonstrate that surface-enhanced Raman scattering (SERS) can be used for sensitive detection of femtomol quantities of two nerve gases, VX and Tabun, using a handheld Raman device and SERS substrates consisting of flexible gold-covered Si nanopillars. The substrate surface exhibits high droplet adhesion and nanopillar clustering due to elasto-capillary forces, resulting in enrichment of target molecules in plasmonic hot-spots with high Raman enhancement. The results may pave the way for strategic life-saving SERS detection of chemical warfare agents in the field.
Nerve gases are polar organic liquids at ambient conditions and most of them are organophosphorus esters that are similar in structure to insecticides.1 VX (Fig. 1a) is a member of the highly toxic V-series chemical warfare agents. It is approximately ten times more deadly than the infamous Sarin (GB),2 while Tabun (GA, Fig. 1b) belongs to the G-series agents and has Sarin-like toxicity.2 VX, Tabun and most other nerve gases irreversibly inhibits the enzyme acetylcholine esterase, leading to rapid acetylcholine build-up and signal loss in the nervous system. A single droplet of VX can cause human death in 15 minutes1 and its persistence makes it into a long-lasting environmental hazard. The extreme toxicity means that all studies of nerve gases has to be conducted in certified laboratories, where synthesis, handling and destruction can be performed under safe conditions and according to strict regulations.3 Synthesis routes are classified.
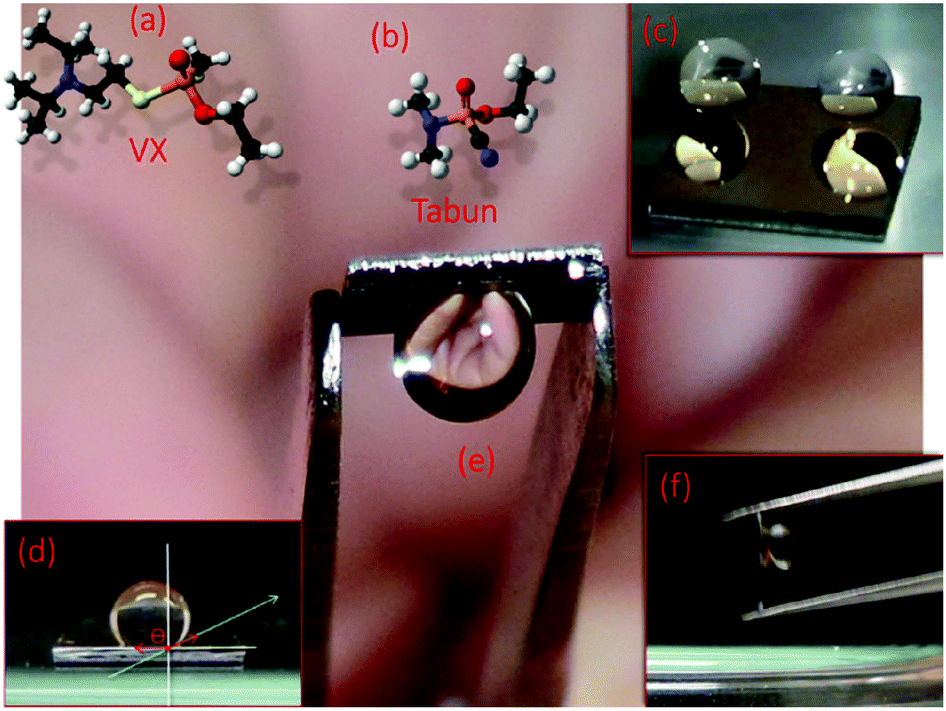 | ||
| Fig. 1 Target molecules and SERS substrate properties. Molecular models of (a) VX and (b) Tabun. (c and d) A superhydrophobic gold nanopillar surface (∼5 × 5 mm) with a contact angle, θ ≈ 152°, to water droplets (2 μl). (e and f) The substrate tilted with the droplet sticking firmly at all angles, without sliding. | ||
Surface-enhanced Raman scattering (SERS) based molecular analysis methods display highly attractive properties in terms of sensitivity, speed, cost, multiplexing and portability.4–6 SERS has been used to resolve conjugated nitro explosives down to attomolar levels7–10 while nerve gases has previously only been detected at high concentrations, 1–5% range in organic solvents,11,12 which is far from relevant in situ conditions. We used mask-less lithography combined with reactive ion etching (RIE)13–15 to fabricate Si/Au nanopillar SERS substrates with excellent wetting and enhancement properties (Fig. 1c–f). The methodology allows us to analyze VX and Tabun with detection limits of ∼13 and ∼670 fmol, respectively, which are five to six orders of magnitude lower than reported previously for SERS, here even using a small and simple handheld Raman device.
Drop-casting is a common delivery method in SERS applications.13,16,17 We studied the wetting properties of the gold nanopillar substrates by placing water droplets on the sample surface (Fig. 1c–f). The substrates showed low water adhesion at initial contact and the water droplets did not stick to the surface until it had been held still for at least several seconds. The contact angle, θ, between the droplet and the surface after this initial step was found to be 152° ± 10 (standard deviation, n = 6). When releasing 10 μl droplets onto a slightly tilted substrate (∼10°), the droplets rapidly rolls off (the so-called “Lotus effect”). These observations classifies the substrate surface as initially superhydrophobic.18 However, after this initial state, the droplets firmly stick to the surface and they do not slide no matter the orientation of the surface (Fig. 1e and f), even when shaking the substrate. This indicates a transition from an initial Cassie–Baxter19 state, with no wetting of the fine structures and a small sliding angle, towards a Wenzel-like state where water penetrates the surface by capillary forces, thereby greatly increasing droplet adhesion.19–21 Further support for this interpretation comes from a comparison of scanning electron microscopy (SEM) images of pristine surfaces (Fig. 2a and b) and surface regions exposed to droplets (Fig. 2c). In the latter case, the gold-coated nanopillars have clearly been pulled together due to elasto-capillary forces,22 which indicates that the droplet has at least partly penetrated into the local structure. We note in passing that a number of intermediates between the Cassie and Wenzel states have been described in the literature. One such state, with similar properties to what is observed here, is the so-called “gecko-state” proposed by Wang and Jiang.18 The gecko-state is characterized by some of the fine structure being wetted and some not wetted, a phenomenon that is attributed to trapped air within the structure that still is connected to ambient air via a nano-porous network. However, a detailed understanding of the fascinating switch between superhydrophobic and hydrophilic adhesive behavior observed here clearly require further analysis.
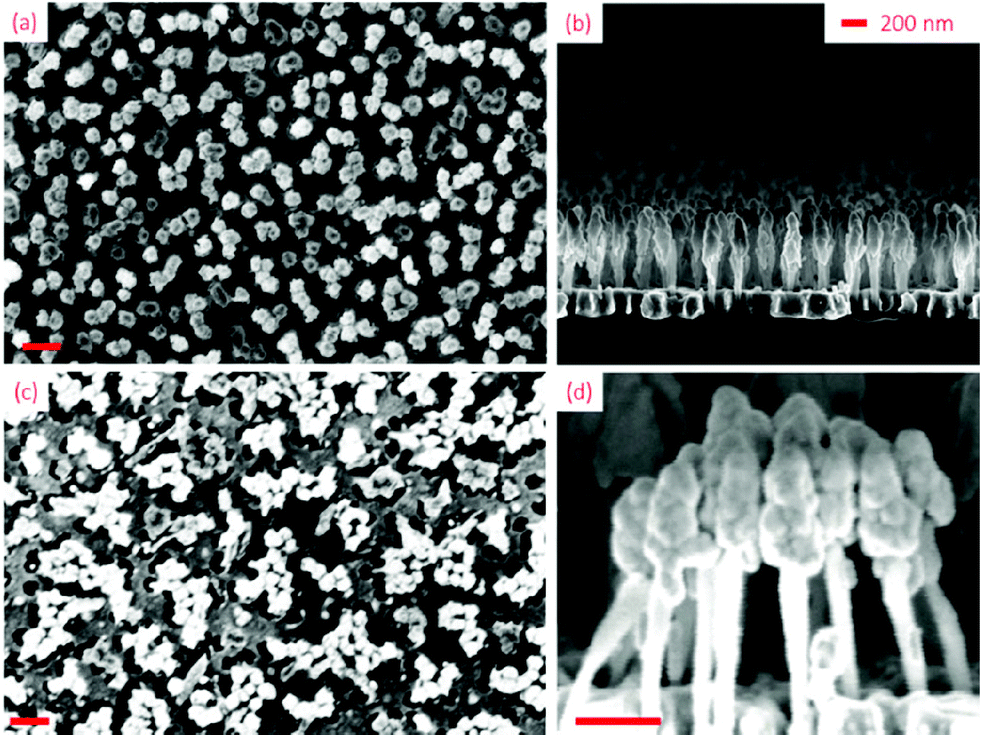 | ||
| Fig. 2 (a) Top view SEM image of the Au covered Si nanopillar substrate. (b) SEM side view of a substrate. (c) SEM image of the nanopillars clustered together by water droplet evaporation. (d) SEM image side view of a nanopillar cluster leaning together. | ||
The wetting properties of our nanopillar substrates provide two distinct advantages from a SERS analysis point-of-view. First, superhydrophobic SERS substrates are known to be effective for detection of low concentration analytes in aqueous solution because the small contact area between a water droplet and the sensor surface leads to accumulation of target molecules as the droplet slowly evaporates.16,23–30 However, this effect is of little use in practice, for example for detection of hazardous substances in the field, unless a droplet also sticks to the surface before evaporation, which is the case here. Secondly, as seen in Fig. 2c, elasto-capillarity forces the flexible nanopillars to lean together such that the gold-covered surface region resembles colloidal metal particle aggregates, which are well-known to be highly efficient SERS substrates because of the strong plasmonic optical near-fields that are induced in the gaps and crevices between the particles.31 It thus appears likely that the wetting properties of the substrates lead to a significant accumulation of molecules not only at the macroscopic scale but more importantly within nanoscopic SERS hot-spots formed locally by the elasto-capillarity aggregated nanopillars.
After dropcasting and subsequent evaporation of 2 μl droplets on the nanopillar surfaces, SERS measurements of the nerve agents were performed with a small handheld device (First Defender RMX, Fig. 3a). The device contains non-moving optics, a 785 nm diode laser and an un-cooled CCD detector. VX SERS (0.75 nmol, 100 ppm) and Raman (pure) spectra can be seen in Fig. 3b. In the SERS spectrum, two groups of peaks appears at approximately 450–600 and 630–800 cm−1, a quite significant peak at just above 890 cm−1 and then many peaks all the way up to ∼1500 cm−1. The spectral profiles compare well with previous reports.12 The strong 890 cm−1 peak has been tentatively assigned to a OPC and/or CCN stretch-modes,12 which may indicate that the nitrogen preferentially bind to the gold, thus causing additional enhancement. The ordinary Raman spectrum shows corresponding peaks at approximately 460, 520, 660, 700, 740, 775, 890 and 1100 cm−1.
 | ||
| Fig. 3 (a) The handheld Raman instrument. (b) SERS spectrum of 0.75 nmol VX and normal Raman spectrum of >98% VX solution. (c) Detection of ultra-low quantities of VX. (d) Calibration curve. | ||
The detection limit for SERS measurements on VX was calculated using the major peak signal (890 cm−1). Fig. 3c shows the SERS peak at 890 cm−1 for 0, 75, 750 and 7500 femtomol VX applied on the substrate. The smallest detected amount of VX (75 fmol, 0.01 ppm) is approximately six orders of magnitude lower than previous reports of VX SERS (10 mg ml−1, or 1% = 10![[thin space (1/6-em)]](https://www.rsc.org/images/entities/char_2009.gif) 000 ppm).12,32 The signal at 890 cm−1 was also compared to the zero level noise divided by a linear slope to the first concentration level multiplied by a factor 3 and 10 for the limit of detection (LOD) and quantification (LOQ), respectively.33 This yields a LOD of 13 femtomol and LOQ 45 femtomol.
000 ppm).12,32 The signal at 890 cm−1 was also compared to the zero level noise divided by a linear slope to the first concentration level multiplied by a factor 3 and 10 for the limit of detection (LOD) and quantification (LOQ), respectively.33 This yields a LOD of 13 femtomol and LOQ 45 femtomol.
In Fig. 4a, a normal Raman spectrum of pure Tabun is shown together with a 1.2 nmol (100 ppm) SERS spectrum. Corresponding peaks here are close to 890 and 2195 cm−1. Also here the 890 cm−1 peak can be assumed to arise from the CCN stretch, while the 2195 cm−1 peak originates in the cyanide group (CN) triple bond vibration which has a strong Raman resonance.34 However, the two lower concentrations are completely lacking the 2195 cm−1 peak, while rather having a 2135 cm−1 peak. In the previously demonstrated SERS at high concentration both these peaks are present and attributed to CN stretch vibration,11 and only the 2195 peak was present in normal Raman spectra reported by Christesen et al.35 It is likely that the 2135 cm−1 peak originates from the cyanide group formally coordinated to the gold by complex, ionic or covalent bonding, hence damping the stretch vibration to slightly lower energy. This is also consistent with Mohamed et al. who found a shift in cyanide stretch from 2192 to 2146 cm−1 when Hg(CN)2 was coordinated to dinuclear gold amidinate.36
 | ||
| Fig. 4 (a) SERS and Raman spectrum of Tabun at 1.4 nanomol and >98% Tabun solution, respectively. (b) 2135 cm−1 SERS peak at low concentrations. (c) Calibration curve. (d) Confocal microscope SERS image of the 2135 cm−1 peak for a 2 μl evaporated droplet with 14 pikomol Tabun. | ||
Fig. 4b shows SERS spectra around the strongest peak (2135 cm−1) for 0, 1.4, 14 and 140 pikomol Tabun applied on the substrate, and 4c shows the corresponding calibration curve. As calculated above, the LOD and LOQ was 0.67 and 2.2 pikomol, respectively. The lowest explicitly showed concentration (1.4 pmol = 0.1 ppm) can be compared with the only existing study showing detection of 5% = 50000 ppm Tabun, that is, 5 × 10⁵ higher concentration.11Fig. 4d, which shows a confocal SERS map of the 2135 cm−1 peak for an evaporated 2 μl droplet containing 14 pmol Tabun, illustrates the concentration effect resulting from the adhesive and superhydrophobic properties of the SERS substrate.
For the highest tested VX concentration (1000 ppm), the droplet initially formed the same nice sphere as seen in Fig. 1. However, after a few minutes (full evaporation took almost 20 min) the droplet collapsed, while for a concentration 10 times lower the droplet remained intact during the whole evaporation. This implies that VX affects the substrate and at a too high concentration destroys the macroscopic substrate superhydrophobicity. Additionally, when four different concentrations (0–1–10–100 ppm) were applied on a single substrate, the higher concentration droplets seemed to evaporate faster than the droplets with lower concentrations. A unified explanation for these two observations is that it is related to the surface tension at the accumulation sites. VX and Tabun has a surface tension of 33.7 ± 3.0 dyne per cm and 39.6 ± 3.0 dyne per cm, respectively, which can be compared to water, which has a surface tension of 72.3 ± 3.0 dyne per cm. Thus, the surface tension of the solutions decreases with increasing molecular concentration, which is likely to lead to the eventual wetting of the bottommost substrate and the collapse of the whole droplet. For Tabun at the highest (1000 ppm) concentration the droplets remained intact, which is due to the slightly higher surface tension compared to VX.
Conclusions
SERS has the potential to provide effective in-field detection of chemical warfare agents due to the combination of high label-free sensitivity molecular fingerprinting ability. To date, SERS of VX and Tabun has only been reported at very high concentrations in organic solvents. In this work, we have presented SERS spectra of these nerve gases at more than five orders of magnitude lower concentrations in water solution. The detection limits were estimated to ∼13 and ∼670 fmol, respectively, for VX and Tabun. The measurements were performed using gold coated Si-nanopillar substrates that are initially superhydrophobic but which rapidly switch a to a state characterized by high droplet adhesion, presumably due to elasto-capillary forces. We argue that the high sensitivity obtained is partly due to this interesting wetting behaviour, which provides distinct advantages from a SERS analysis point-of-view, that is, a small droplet contact area and target molecule accumulation within SERS hot-spots formed by clustered nanopillars. Furthermore, the applicability for real in-field use was demonstrated by using a portable, handheld, device for the Raman measurements. The results indicate that preventive and life-saving detection of nerve gases, and most likely many other deadly substances, can be achieved using suitable SERS substrates and easy-to-use measurement technology.Acknowledgements
Funding was received from The Swedish Foundation for Strategic Research. TR, MS and AB acknowledges funding from the Danish Council for Independent Research for supporting the Sapere Aude project “NAPLAS”. POA acknowledge financial support from the Swedish Defence Materiel Administration, FMV (E4884).Notes and references
- Y. C. Yang, Acc. Chem. Res., 1999, 32, 109 CrossRef CAS.
- US Department of the Army Toxic Chemical Agent Safety Standards: 2012, Vol. Pamphlet 385–61.
- B. Díaz de Greñu, D. Moreno, T. Torroba, A. Berg, J. Gunnars, T. Nilsson, R. Nyman, M. Persson, J. Pettersson, I. Eklind and P. Wästerby, J. Am. Chem. Soc., 2014, 136, 4125 CrossRef PubMed.
- S. Lee, J. Choi, L. Chen, B. Park, J. B. Kyong, G. H. Seong, J. Choo, Y. Lee, K. H. Shin, E. K. Lee, S. W. Joo and K. H. Lee, Anal. Chim. Acta, 2007, 590, 139 CrossRef CAS PubMed.
- R. A. Halvorson and P. J. Vikesland, Environ. Sci. Technol., 2010, 44, 7749 CrossRef CAS PubMed.
- F. Yan and T. Vo-Dinh, Sens. Actuators, B, 2007, 121, 61 CrossRef CAS.
- J. Lee, B. Hua, S. Park, M. Ha, Y. Lee, Z. Fan and H. Ko, Nanoscale, 2014, 6, 616 RSC.
- H. B. Zhou, Z. P. Zhang, C. L. Jiang, G. J. Guan, K. Zhang, Q. S. Mei, R. Y. Liu and S. H. Wang, Anal. Chem., 2011, 83, 6913 CrossRef CAS PubMed.
- H. Ko, S. Chang and V. V. Tsukruk, ACS Nano, 2009, 3, 181 CrossRef CAS PubMed.
- A. Hakonen, P. O. Andersson, M. S. Schmidt, T. Rindzevicius and M. Käll, Anal. Chim. Acta, 2015, 893, 1 CrossRef CAS PubMed.
- S. Farquharson, P. Maksymiuk, K. Ong and S. D. Christesen, in Vibrational Spectroscopy-Based Sensor Systems, ed. S. D. Christesen and A. J. Sedlacek, Spie-Int Soc Optical Engineering, Bellingham, 2002, vol. 4577, p. 166 Search PubMed.
- S. Farquharson, A. Gift, P. Maksymiuk and F. Inscore, Appl. Spectrosc., 2005, 59, 654 CrossRef CAS PubMed.
- M. S. Schmidt, J. Hubner and A. Boisen, Adv. Mater., 2012, 24, OP11 CAS.
- J. Yang, M. Palla, F. G. Bosco, T. Rindzevicius, T. S. Alstrøm, M. S. Schmidt, A. Boisen, J. Ju and Q. Lin, ACS Nano, 2013, 7, 5350 CrossRef CAS PubMed.
- K. Wu, T. Rindzevicius, M. S. Schmidt, K. B. Mogensen, A. Hakonen and A. Boisen, J. Phys. Chem. C, 2015, 119, 2053 CAS.
- F. De Angelis, F. Gentile, F. Mecarini, G. Das, M. Moretti, P. Candeloro, M. L. Coluccio, G. Cojoc, A. Accardo, C. Liberale, R. P. Zaccaria, G. Perozziello, L. Tirinato, A. Toma, G. Cuda, R. Cingolani and E. Di Fabrizio, Nat. Photonics, 2011, 5, 683 CrossRef.
- A. Hakonen, M. Svedendahl, R. Ogier, Z.-J. Yang, K. Lodewijks, R. Verre, T. Shegai, P. O. Andersson and M. Käll, Nanoscale, 2015, 7, 9405 RSC.
- S. Wang and L. Jiang, Adv. Mater., 2007, 19, 3423 CrossRef CAS.
- A. B. D. Cassie and S. Baxter, Trans. Faraday Soc., 1944, 40, 0546 RSC.
- R. N. Wenzel, Ind. Eng. Chem., 1936, 28, 988 CrossRef CAS.
- E. Bittoun and A. Marmur, Langmuir, 2012, 28, 13933 CrossRef CAS PubMed.
- B. Roman and J. Bico, J. Phys.: Condens. Matter, 2010, 22, 493101 CrossRef CAS PubMed.
- B. Kiraly, S. K. Yang and T. J. Huang, Nanotechnology, 2013, 24, 10 CrossRef PubMed.
- Q. X. Zhang, Y. X. Chen, Z. Guo, H. L. Liu, D. P. Wang and X. J. Huang, ACS Appl. Mater. Interfaces, 2013, 5, 10633 CAS.
- Y. W. Hu, S. Liu, S. Y. Huang and W. Pan, Thin Solid Films, 2010, 519, 1314 CrossRef CAS.
- B. B. Xu, Y. L. Zhang, W. Y. Zhang, X. Q. Liu, J. N. Wang, X. L. Zhang, D. D. Zhang, H. B. Jiang, R. Zhang and H. B. Sun, Adv. Opt. Mater., 2013, 1, 56 CrossRef.
- W. C. Ye, J. X. Liu, Q. Z. Liu, F. Zhou and W. M. Liu, Electrochim. Acta, 2010, 55, 8649 CrossRef CAS.
- X. S. Zhang, B. Meng, F. Y. Zhu, W. Tang and H. X. Zhang, Sens. Actuators, A, 2014, 208, 166 CrossRef CAS.
- J. M. Rui Tan, J. J. Ruan, H. K. Lee, I. Y. Phang and X. Y. Ling, Phys. Chem. Chem. Phys., 2014, 16, 26983 RSC.
- Y. W. Wu, T. Hang, J. Komadina, H. Q. Ling and M. Li, Nanoscale, 2014, 6, 9720 RSC.
- L. M. Tong, H. X. Xu and M. Käll, MRS Bull., 2014, 39, 163 CrossRef CAS.
- S. Farquharson, A. Gift, P. Maksymiuk, F. Inscore, W. Smith, K. Morrisey and S. D. Christesen, in Chemical and Biological Point Sensors for Homeland Defense, ed. A. J. Sedlacek, S. D. Cjristesen, R. Colton and T. VoDinh, Spie-Int Soc Optical Engineering, Bellingham, 2004, vol. 5269, p. 16 Search PubMed.
- A. Hakonen, Anal. Chem., 2009, 81, 4555 CrossRef CAS PubMed.
- K.-h. Yea, S. Lee, J. B. Kyong, J. Choo, E. K. Lee, S.-W. Joo and S. Lee, Analyst, 2005, 130, 1009 RSC.
- S. D. Christesen, J. P. Jones, J. M. Lochner and A. M. Hyre, Appl. Spectrosc., 2008, 62, 1078 CrossRef CAS PubMed.
- A. A. Mohamed, H. E. Abdou and J. P. Fackler, Inorg. Chem., 2005, 45, 11 CrossRef PubMed.
Footnote |
| † Electronic supplementary information (ESI) available. See DOI: 10.1039/c5nr06524k |
| This journal is © The Royal Society of Chemistry 2016 |