
A biocompatibility study of new nanofibrous scaffolds for nervous system regeneration†
A.
Raspa
ab,
A.
Marchini
a,
R.
Pugliese
ab,
M.
Mauri
c,
M.
Maleki
ab,
R.
Vasita
d and
F.
Gelain
*ab
aCenter for Nanomedicine and Tissue Engineering (CNTE), A.O. Ospedale Niguarda Cà Granda, Piazza dell'ospedale maggiore 3, 20162 Milan, Italy. E-mail: gelain@mit.edu; Fax: +39 02 87073821; Tel: +39 02 64447527
bIRCCS Casa Sollievo della Sofferenza, Opera di San Pio da Pietrelcina, Viale Cappuccini 1, San Giovanni Rotondo, FG 71013, Italy
cDipartimento di Scienza dei Materiali, Università degli Studi di Milano Bicocca, Via Roberto Cozzi, 55, 20125 Milano, Italy
dSchool of Life Sciences, Central University of Gujarat, Sector-30, Gandhinagar-382030, Gujarat, India
First published on 13th November 2015
Abstract
The development of therapeutic approaches for spinal cord injury (SCI) is still a challenging goal to achieve. The pathophysiological features of chronic SCI are glial scar and cavity formation: an effective therapy will require contribution of different disciplines such as materials science, cell biology, drug delivery and nanotechnology. One of the biggest challenges in SCI regeneration is to create an artificial scaffold that could mimic the extracellular matrix (ECM) and support nervous system regeneration. Electrospun constructs and hydrogels based on self-assembling peptides (SAPs) have been recently preferred. In this work SAPs and polymers were assembled by using a coaxial electrospinning setup. We tested the biocompatibility of two types of coaxially electrospun microchannels: the first one made by a core of poly(ε-caprolactone) and poly(D,L-lactide-co-glycolide) (PCL–PLGA) and a shell of an emulsion of PCL–PLGA and a functionalized self-assembling peptide Ac-FAQ and the second one made by a core of Ac-FAQ and a shell of PCL–PLGA. Moreover, we tested an annealed scaffold by PCL–PLGA microchannel heat-treatment. The properties of coaxial scaffolds were analyzed using scanning electron microscopy (SEM), Fourier transform spectroscopy (FTIR), contact angle measurements and differential scanning calorimetry (DSC). In vitro cytotoxicity was assessed via viability and differentiation assays with neural stem cells (NSCs); whereas in vivo inflammatory response was evaluated following scaffold implantation in rodent spinal cords. Emulsification of the outer shell turned out to be the best choice in terms of cell viability and tissue response: thus suggesting the potential of using functionalized SAPs in coaxial electrospinning for applications in regenerative medicine.
1. Introduction
Spinal Cord Injury (SCI) in adult mammals causes an initial physical trauma followed by a secondary process of tissue destruction arising from robust and persistent inflammatory responses, ischemia, edema, and demyelination1 resulting in the development of large zones of necrosis at the site of injury, ultimately creating cavities that prevent communication between brain and spinal cord.In order to recover spinal functionality, it is crucial to regenerate the lost tissue at least partially. Tissue engineered scaffolding, aimed at mimicking the native extracellular matrix (ECM), is an increasingly popular strategy for the treatment of SCI.2 In fact, neural tissue ECM consists of aligned collagen-based fibers, whose fiber/fibril diameter and alignment encourages the guided growth of neural cells.
The ability to synthesize nanofibrous scaffolds in the shape of conduits or of aligned microfibers using an electrospinning technique has increased the possible applications in neural tissue engineering. Nonetheless, these scaffolds must be deeply characterized in order to control and optimize their final properties and, among them, biocompatibility. Biomaterials designed for spinal cord repair should provoke minimal chronic inflammation and immune response when implanted in the Central Nervous System (CNS).3,4
Among others, in chronic and acute SCI, various efforts have been focused on designing new biomaterials capable of stimulating and promoting sensory and motor axonal regeneration when delivered at the site of injury by providing permissive microenvironments mimicking the native ECM.5 In this regard, biodegradable electrospun scaffolds based on aliphatic polyesters, such as poly(D,L-lactide-co-glycolide) (PLGA) and poly(ε-caprolactone) (PCL), have been widely studied for various biomedical applications6,7 due to their biocompatibility, biodegradability, excellent fiber-forming properties8,9 and their approval by Food and Drug Administration (FDA) for clinical usage.
PCL electrospun nanofibers have good mechanical strength but also a prolonged biodegradation profile, making them unsuited for neural implantation where scaffold remains may hamper tissue regeneration. Moreover, its inert nature can affect protein adsorption eventually yielding unfavorable cell adhesion sites. On the other hand, injectable scaffolds, made of SAPs, belong to the hydrogel family and show a remarkable regenerative potential because of their good biocompatibility, tailorability for slow drug release and, most importantly, easy functionalization with bioactive motifs.10,11 Thus, despite the large numbers of synthetic polymer-based scaffolds, self-assembling peptides (SAPs) are still the preferred choice for SCI regenerative therapies. In our previous publication a SAP named Ac-FAQ (Ac-FAQRVPP-GGG-(LDLK)3-CONH2), selected also in this work, demonstrated significant locomotor recovery when injected into rats with acute SCI: it did not alter the physiological inflammatory response and enhanced neural regeneration.12
Several studies have explored the usage of electrospun nanofibrous scaffolds to guide neural cell growth.13,14 Combination of SAPs with electrospun fibers could be the next promising step for neural prostheses. Blended PCL–PLGA with biologically active peptide sequences may presumably not only change the electrospun scaffold surface properties but also enhance the regeneration process at the site of implant. The integration of bioactive SAPs with polymeric nanofibers will immobilize SAPs for a longer time whereas the nanofibers will provide substrate for guided cell growth. In the current study, SAPs and polymers were integrated by using a coaxial electrospinning setup by itself or by using, in addition to that, emulsified solutions of the two together. The core–shell scaffolds allow for encapsulation of biologically active molecules despite the different solvent systems used for spinning the two solutions.15–19 Moreover, coaxial arrangement enhanced the loading capacity, reduced the loss of bioactivity and demonstrated the sustained release of biomolecules from the core.16,17
Briefly, we introduced here and tested two types of SAP encapsulated PCL–PLGA coaxial electrospun scaffolds: one having Ac-FAQ in the core and PCL–PLGA in the shell and the other containing an emulsion of PCL–PLGA with Ac-FAQ in the shell and PCL–PLGA in the core. We also tested a thermally annealed PCL–PLGA microchannel to assess the effects of scaffold fused fibers and decreased porosity on the overall biocompatibility and on the likely decreased ectopic cell infiltration.
The physical and chemical properties of coaxial scaffolds were analyzed using scanning electron microscopy (SEM), Fourier transform spectroscopy (FTIR), contact angle measurements and differential scanning calorimetry (DSC). These studies pointed out the nanofibrous nature of scaffolds and minuscule alterations in the surface and bulk properties of PCL–PLGA nanofibers. Cytotoxicity was evaluated via in vitro viability and differentiation assays of neural stem cells (NSCs). Furthermore, in vivo studies were conducted to evaluate inflammatory response following scaffold implantation in rodent spinal cords, examining the distribution of activated macrophages/microglia and reactive astrocyte response.
In in vitro experiments the scaffolds featuring nanofiber shells of PCL–PLGA emulsified with Ac-FAQ were demonstrated to be comparable to positive control, while in in vivo experiments most of the implanted scaffolds showed values of immune reaction similar to a sham-operated group; thus suggesting that the core–shell electrospun scaffolds mixed with SAPs may be promising implants to be adopted in the field of nervous system regeneration.
2. Results
2.1 Fiber preparation and characterization
In the current study PCL–PLGA was combined with 1% w/v of Ac-FAQ with the objective of enhancing the bioactivity of implants. Two types of PCL–PLGA/peptide nanofibers were electrospun and are shown in Table 1. In all samples fiber orientation was random with an average fiber diameter of 600 nm and a diameter range of 200–1000 nm. Scanning electron micrographs (Fig. 1a) revealed a continuous and smooth morphology with no perceivable difference between coaxial I and coaxial II. | ||
Fig. 1 (a) Scanning electron micrographs of the following tested samples: coaxial I, coaxial II and annealed. FT-infrared spectra of electrospun nanofibrous scaffolds: (b) amide I & II stretching due to the peptide in coaxial II, in comparison with blend. (c) Reduction in C![[double bond, length as m-dash]](https://www.rsc.org/images/entities/char_e001.gif) O stretching spectra from blend to all other samples. (d) DSC traces recorded during first heating of nanomesh samples, containing information on the stability of the polymer morphologies resulting from each preparation. The reference PCL trace is not shown: its melting point is outlined with the dashed vertical line. Differences in the melting point are apparent, with the coaxial II sample presenting a melting peak at 55.5°, whereas coaxial I and blend nanofibers both melt around 61 °C, and reference pure PCL melts at 67 °C. O stretching spectra from blend to all other samples. (d) DSC traces recorded during first heating of nanomesh samples, containing information on the stability of the polymer morphologies resulting from each preparation. The reference PCL trace is not shown: its melting point is outlined with the dashed vertical line. Differences in the melting point are apparent, with the coaxial II sample presenting a melting peak at 55.5°, whereas coaxial I and blend nanofibers both melt around 61 °C, and reference pure PCL melts at 67 °C. | ||
| Sample | Jet | Core | Shell | Structure |
|---|---|---|---|---|
| Blend | Single | No | No |
|
| Coaxial I | Coaxial | PCL–PLGA | Emulsion PCL–PLGA with Ac-FAQ |
|
| Coaxial II | Coaxial | Ac-FAQ | PCL–PLGA |
|
| Annealed | Single | No | No |
|
The annealed sample instead presents thicker fibers and beads due to partial melting and agglomeration of the fibers during annealing at 60 °C. This temperature is slightly below the melting point of PCL and reduces sample porosity without disrupting the shape of the implantable microchannel: thus we could single out the effect of the nanostructure on the infiltration of inflammatory cells within the implanted scaffold.
2.2 Water contact angle (WCA) measurement
This study was performed to understand the effect of peptide/peptide solution on the nanofibrous surface, although low concentrations of peptides were not expected to make any significant change except on the nanofiber surface texture due to evaporation of water from the emulsion. Statistical analysis showed that no statistically significant difference existed between the wettability of the coaxial I and coaxial II electrospun mats (p = 0.7076, α = 0.05) while the difference is considered to be statistically significant between the blend and other samples. As expected a marginal increase in contact angles of coaxial I and coaxial II fibers has been observed (see Table 2). This marginal increase both on coaxial I and coaxial II nanofibers can be attributed to a change (decrease) in the surface coverage of the CO group because of their anticipated interactions with peptide chains. Furthermore, the contact angle of water droplets on nanofibrous meshes was recorded up to 5 minutes at 30 seconds interval to study the dynamic contact angle. However, none of the samples showed any change in the contact angle from the first measurement to the last measurement. We speculate that incorporation of 1% peptide could not change the fiber surface physical properties enough to be detected through this methodology.
| Sample name | Contact angle | Contact angle |
|---|---|---|
| Left | Right | |
| Blend | 129° ± 1 | 129° ± 1 |
| Coaxial I | 135° ± 3 | 135° ± 3 |
| Coaxial II | 134° ± 2 | 134° ± 2 |
2.3 FTIR analysis
FTIR spectroscopy was used to identify the change in surface chemistry after blending or co-spinning of peptides with PCL–PLGA nanofibers. The infrared spectrum of the blend sample was to a large extent similar to the spectrum of the coaxial samples. However, a number of small peaks belonging to peptides (amide I and amide II) and the changes in the CO surface coverage have been observed (Fig. 1b and c). Most of the PCL and PLGA peaks were overlapping except for 865 cm−1, which represent PLGA in the blend. The presence of PCL was confirmed by 2948 cm−1 (C–H stretch), 1725 cm−1 (CO stretch) and 1177 cm−1 (C–O stretch). In case of the 1755 cm−1 peak, which represents CO stretching, a significant decrease in intensity for coaxial samples was shown. This observation can be attributed to the possible interactions between the CO and peptide chains which eventually reduce their exposure on the fiber surface. Another possible region for finding the presence of peptide on the nanofiber surface was amide I and II peaks at ∼1618 and ∼1543 respectively. However, only coaxial I nanofibers which contain peptides in the shell region showed amide I & II signature peaks. These results clearly indicated that the peptides were incorporated into nanofibers.
2.4 Thermal analysis
The thermal properties of blend and the PCL–PLGA combined with peptides were investigated by DSC, whose results are reported in Table 3 together with the characterization of the raw materials PCL and PLGA. The raw materials display standard thermal properties, thus in Fig. 1d only the nanostructured samples are plotted on the graph.| Sample name | 1st Heating cycle peak (°C) | ΔHfus (J g−1) | Crystallinity fraction χ | 2nd Heating segment: peak (°C) | ΔHfus (J g−1) |
|---|---|---|---|---|---|
| PCL | 67 ± 1 | 98 ± 6 | 0.71 ± 0.05 | 56.5 ± 1 | 78 ± 7 |
| Blend | 61 ± 1 | 67 ± 6 | 0.71 ± 0.08 | 56 ± 1 | 54 ± 5 |
| Coaxial I | 60 ± 1 | 64 ± 5 | 0.68 ± 0.07 | 57 ± 1 | 48 ± 4 |
| Coaxial II | 55.5 ± 0.5 | 55 ± 4 | 0.57 ± 0.05 | 53 ± 1 | 46 ± 4 |
| PLGA | T g = 46 °C | 0 | T g = 43 °C | ||
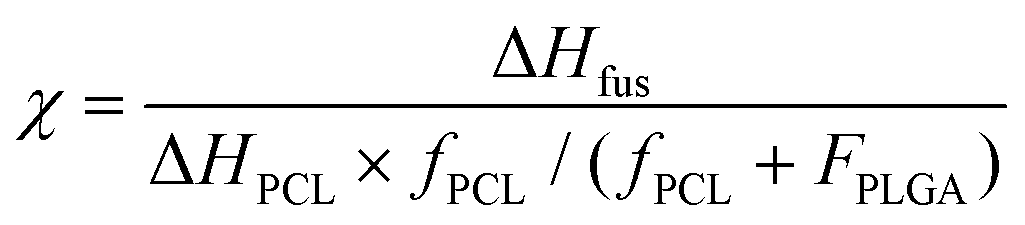
For analyzing the phase transition, we considered the two polymers separated at the local scale,20 and thus treated the DSC traces as linear combinations of the reference PLGA and PCL weighted by the respective ratios (4![[thin space (1/6-em)]](https://www.rsc.org/images/entities/char_2009.gif) :5.5). Thus, after baseline correction the endothermal peak was integrated and the crystallinity χ was measured using the following equation:
:5.5). Thus, after baseline correction the endothermal peak was integrated and the crystallinity χ was measured using the following equation:
Data acquired during the first and second heating segments of the DSC are separately reported in Table 3: the first scan (Fig. 1d) is the most informative of the thermo-mechanical history of each sample and highlights the differences due to the preparation of each nanofibrous mesh. During this first heating, the sample melts and loses its mesh structure: the second scan provides preparation-independent information on the polymers. On the first heating the melting points of blend and coaxial I are similar, and they are both more than 5 °C lower than the melting point of reference PCL. The coaxial II sample has a further significant lowering (>5 °C) in the melting point relative to blend and coaxial I.
A comparison between blend and coaxial I indicates that the presence of 1% w/v peptide did not change the structure and thermal properties of the polymer. Instead, the coaxial II sample presents a significant decrease in the enthalpy, indicating a reduced quality of the crystals, compatible with a system with a higher interface, as in the case of “hollow” fibers, or due to kinetic reasons like the disruption of forming crystals due to water evaporation, as expected under conditions where the core itself was constituted by a water peptide solution (Table 3). As predicted, values measured during the second heating are much less differentiated, since the first heating melts the samples and resets their morphology, erasing the features associated with microfabrication.
2.5 In vitro results
Cell viability assays are crucial to test the potential of newly developed biomaterials for tissue engineering applications. Also, assessments of cell adhesion, spreading and proliferation give precious information regarding the possible interactions between scaffolds and cells of the host tissues. The functionalized self-assembling peptide Ac-FAQ used in coaxial I and coaxial II has already been demonstrated to support NSC growth, yielding percentages of neurons and oligodendrocytes significantly higher when compared to the progenies cultured on Cultrex.12Hence NSC proliferative and differentiating potentials of co-electrospun scaffolds deposited on glass coverslips have been tested in vitro. All tests were performed after 7 days in vitro (7 DIV) and Cultrex coated coverslips were used as positive controls.
The MTS assay was performed to determine mNSC viability on electrospun circular glass coverslips (Fig. 2a): it showed larger populations of viable mNSCs on coaxial I substrates, indeed no significant difference was detected with Cultrex, while significantly less viable cells were observed on blend, coaxial II and annealed substrates. These results indicate that coaxial I, comprising the emulsion of Ac-FAQ and PCL–PLGA in the outer shell, was the best choice for cell proliferation and viability.
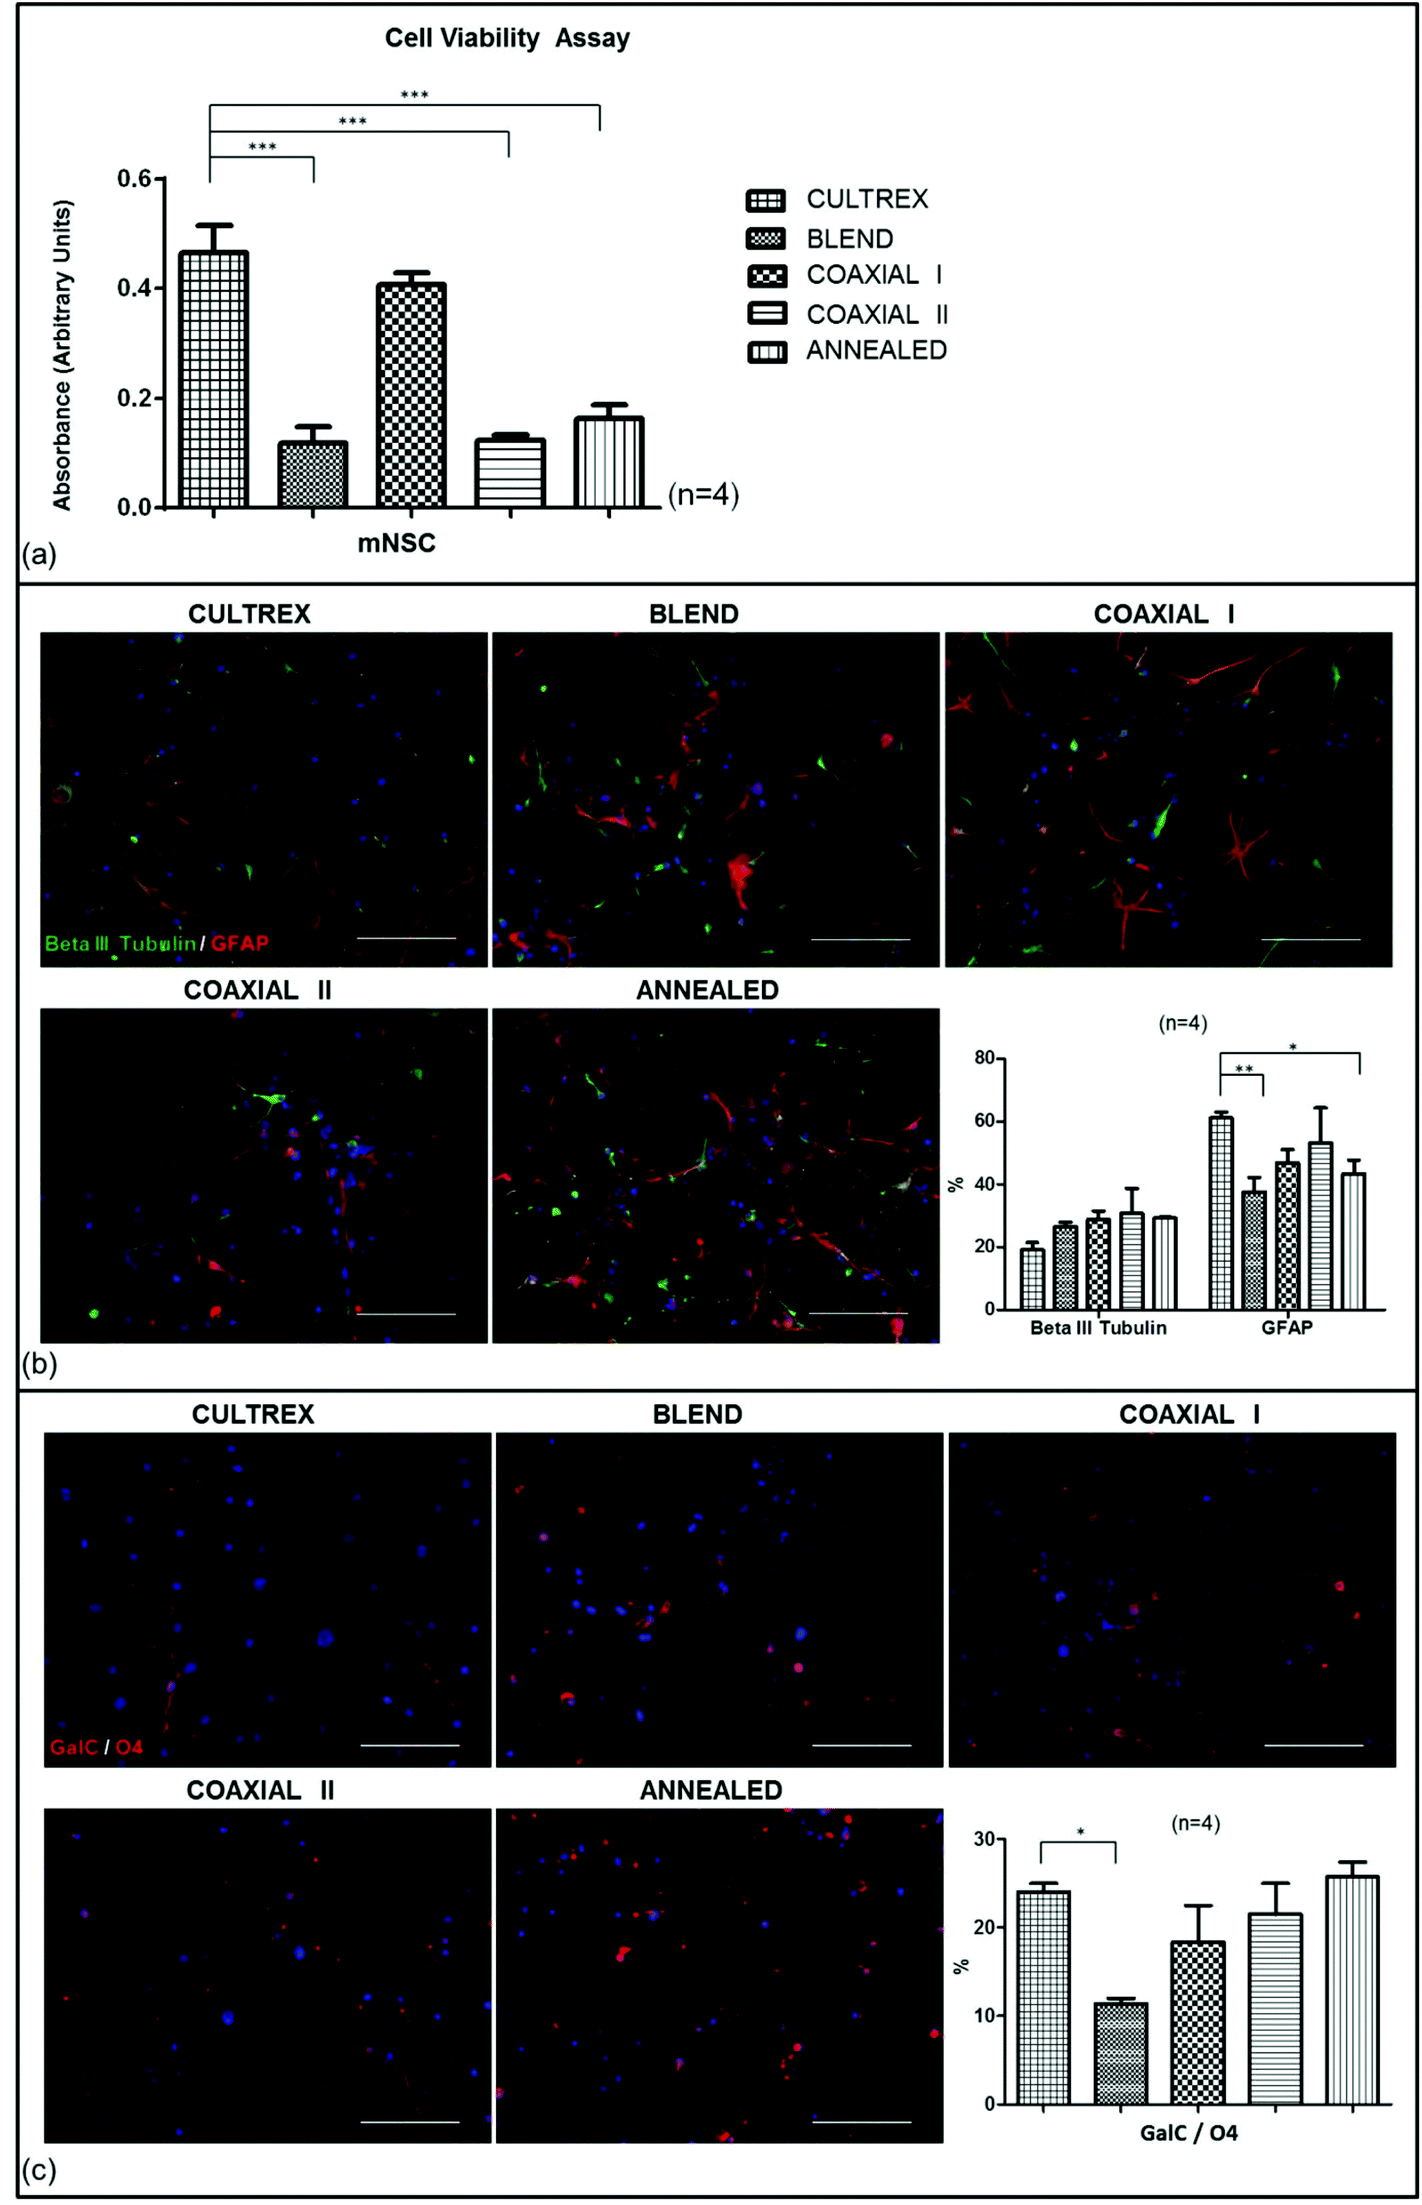 | ||
| Fig. 2 In vitro study: (a) MTS assay for cell viability of mNSCs cultured on Cultrex, blend, coaxial I, coaxial II and annealed scaffolds at 7 DIV. Results point out significant differences between blend, coaxial II and annealed vs. Cultrex (***p < 0.001). No significant difference was detected between Cultrex and coaxial I. Cell nuclei are visualized with DAPI (blue). (b) Neural/astroglial differentiation assessment: quantification of mNSC differentiation shows no significant differences between all scaffolds and Cultrex for beta III tubulin+ (green) cells, while there are significant differences among blend and annealed scaffolds vs. Cultrex for GFAP+ (red) cells (**p < 0.01; *p < 0.05). (c) Oligodendroglial differentiation assessment: quantification of GalC/O4+ cells (red) shows significant difference between blend vs. Cultrex (*p < 0.05). Scale bars = 100 μm. | ||
Immunofluorescence against post-mitotic neurons (beta III tubulin), astrocytes (GFAP) and oligodendrocytes (GalC–O4) was performed for each condition (Fig. 2b and c). mNSCs cultured on scaffolds exhibited neural branching similar to that found on Cultrex. Quantitative results are expressed as a percentage of the total cell population (DAPI cell nuclei staining). In the case of beta III tubulin the blend, coaxial I, coaxial II and annealed samples showed respectively 26.53 ± 1.37%, 28.81 ± 2.68%, 30.84 ± 7.84% and 29.25 ± 0.29% of positive cells. In the case of Cultrex we detected 19.22 ± 2.34% of cells positive to beta III tubulin. Lacking any significant difference among the just mentioned results, the percentage of beta III tubulin+ cells was comparable to mNSCs differentiating on Cultrex.
Of all the scaffolds tested, coaxial I and coaxial II exhibited the highest percentage of positive cells for the astrocyte marker GFAP (46.85 ± 4.28% for coaxial I; 53.16 ± 11.12% for coaxial II). These values are similar to those found with Cultrex (61.12 ± 1.89% GFAP+ cells). In the case of blend and annealed we detected 37.54 ± 4.61% and 43.33 ± 4.40% of cells positive to GFAP: values significantly lower than Cultrex.
On the other hand, the percentage of oligodendrocytes of mNSCs on blend, coaxial I, coaxial II and annealed were respectively 11.35 ± 0.74%, 18.32 ± 4.83%, 21.52 ± 4.04% and 25.74 ± 2.92%. Statistical analysis pointed out significant differences of GalC/O4+ murine cells on Cultrex (21.48 ± 3.27%) vs. blend, while all other substrates gave data comparable to Cultrex.
2.6 In vivo results
To evaluate the host tissue reaction to the implanted electrospun scaffolds they were inserted intramedullary into rats and processed after one month (see the Method section for details). We examined the implants, stub wounds and the surrounding spinal cord tissues. We determined the effect of scaffolds on inflammatory cell activation by histological analysis. We evaluated the cell density of IBA1+ and CD68+ cells in the spinal cord tissue surrounding (Fig. 3a) and within the implants (see the ESI and Fig. S1† for details).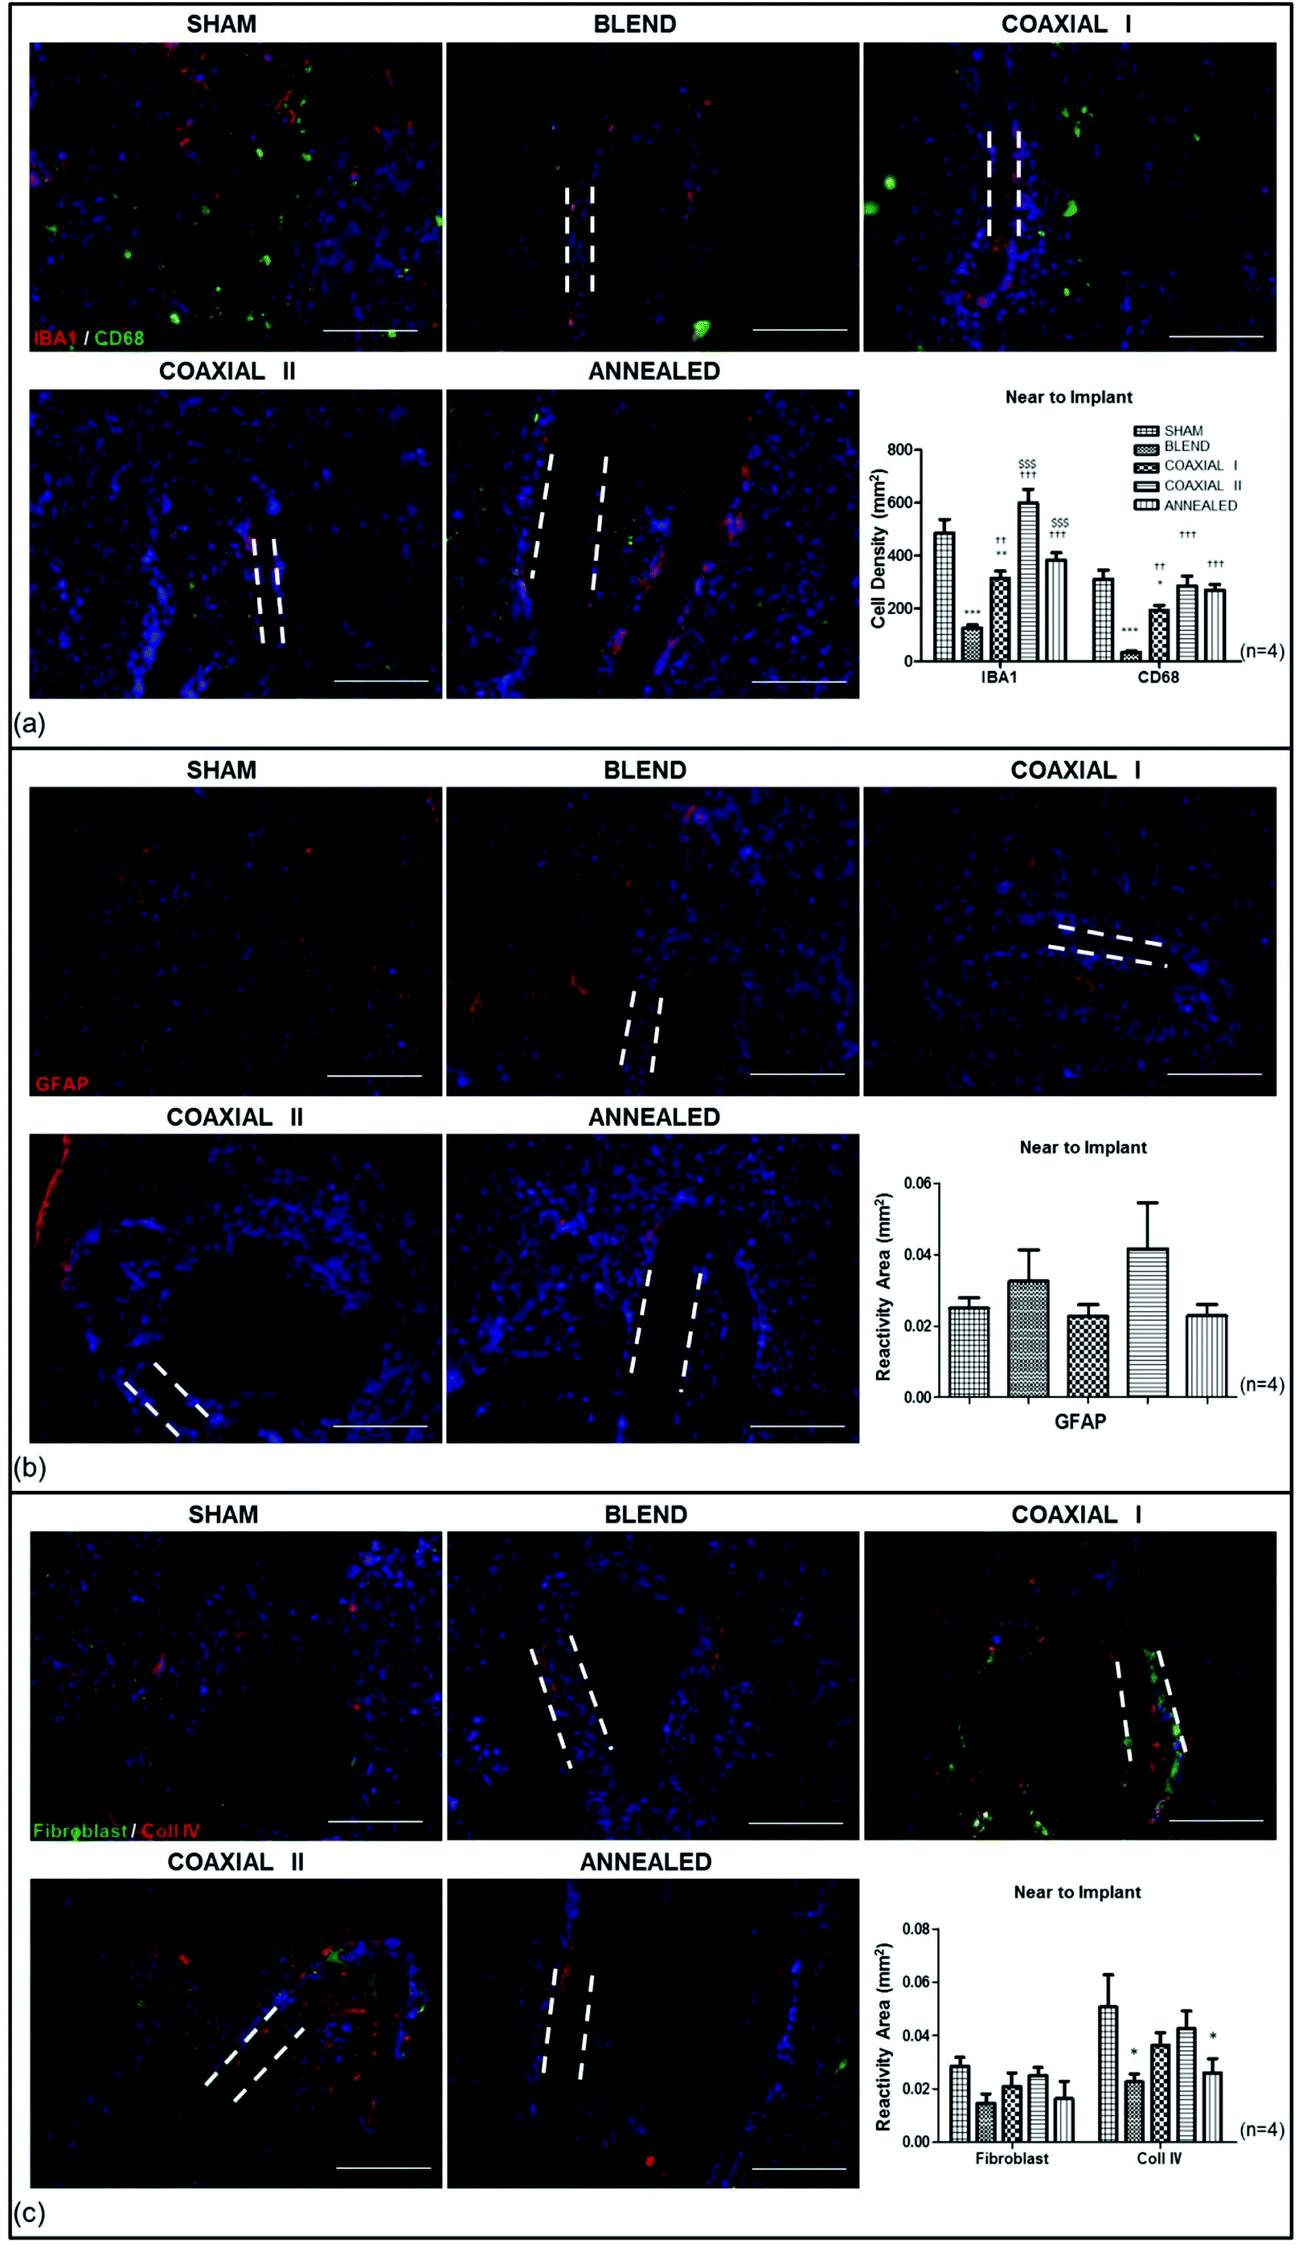 | ||
| Fig. 3 In vivo assays to evaluate tissue reaction in sham-operated animals and those receiving blend, coaxial I, coaxial II and annealed scaffolds. Immunofluorescence staining for IBA1, CD68, GFAP, fibroblast and Coll IV markers. Cell nuclei are visualized with DAPI (Blue). (a) IBA1+ (red) and CD68+ (green) cells were counted and the graph shows the density of cells near to implant. As for cell density (mm2) near to implant the IBA1 quantification for all scaffolds was significantly different depending on the type of scaffold implanted (sham vs. blend ***p < 0.001; sham vs. coaxial I **p < 0.01; blend vs. coaxial I ††p < 0.01; blend vs. coaxial II †††p < 0.001; blend vs. annealed †††p < 0.001; coaxial I vs. coaxial II $$$p < 0.001; coaxial II vs. annealed $$$p < 0.001). Statistical differences for CD68+ cell density (mm2) were similar to IBA1 (sham vs. blend ***p < 0.001; sham vs. coaxial I *p < 0.05; blend vs. coaxial I ††p < 0.01; blend vs. coaxial II †††p < 0.001; blend vs. annealed †††p < 0.001). (b) Reactive area of GFAP+ cells (red) detected near to implant shows no significant difference among the experimental groups. The same methodology for (c) fibroblast (green) and Coll IV (red) + cells. In the case of fibroblast marker the results show no statistical differences among all scaffolds; while, for collagen IV, there were significant differences among blend and annealed vs. sham (*p < 0.05). Scale bar = 100 μm. Dashed lines outline scaffold walls. | ||
IBA1 is a microglia/macrophage-specific calcium-binding protein: the IBA1+ cell density in sham-operated animals was 486.2685 ± 51.485 cells per mm2; while the average number of IBA1+ cells in tissues receiving the scaffolds was 125.3480 ± 13.031 cells per mm2, 314.3095 ± 27.128 cells per mm2, 598.8207 ± 53.163 cells per mm2, 383.8618 ± 27.751 cells per mm2 for tissues surrounding blend, coaxial I, coaxial II and annealed implants respectively (Fig. 3a). The microglial response for all scaffolds was significantly different depending on the type of implanted scaffold. At 1 month, blend and coaxial I scaffolds had fewer IBA1+ cells at the implant site than sham-operated animals (***p < 0.001, sham vs. blend; **p < 0.01, sham vs. coaxial I). The density of IBA1+ cells in the coaxial II and annealed group animals seems to have no significant differences with respect to the sham group, although between coaxial II vs. annealed there was a considerable difference ($$$p < 0.001). The number of IBA1+ cells for blend scaffolds was very low, showing a significant difference compared to all other scaffolds (††p < 0.01, blend vs. coaxial I; †††p < 0.001, blend vs. coaxial II; †††p < 0.001, blend vs. annealed). Finally, significant differences between the coaxial I and coaxial II groups were detected ($$$p < 0.001).
On the other hand the number of CD68+ cells was lower in all animals receiving implants. The CD68+ cells were 311.9259 ± 33.014 cells per mm2 in the sham-operated group; 34.7812 ± 4.453 cells per mm2 in the blend group; 192.9280 ± 19.604 cells per mm2 in the coaxial I group; 285.2787 ± 37.598 cells per mm2 in the coaxial II group; 270.3423 ± 20.559 cells per mm2 in the annealed group. Statistical analysis showed significant differences between blend and coaxial I vs. sham (***p < 0.001 and *p < 0.05 respectively), coaxial I vs. blend (††p < 0.01), and lastly coaxial II and annealed vs. blend (†††p < 0.001).
We also measured the cell density of IBA1+ and CD68+ cells within the walls of implanted microchannels (see the ESI and Fig S1† for details). The IBA1+ cells were 268.2055 ± 71.214 cells per mm2 in the blend group; 241.1217 ± 71.631 in coaxial I; 230.2426 ± 58.503 cells per mm2 in coaxial II; 39.7989 ± 17.014 in annealed animals. In this case statistical analysis showed similar results in almost all scaffolds giving no significant differences, except for annealed that had the lowest density of IBA1+ cells (*p < 0.05 annealed vs. blend, coaxial I and coaxial II). Again, in the case of CD68 the cell density is smaller than IBA1+ cells. The results calculated for channel walls showed: 157.6573 ± 37.085 CD68+ cells per mm2 in blend; 61.9298 ± 17.059 cells per mm2 in coaxial I; 82.3591 ± 20.536 cells per mm2 in coaxial II; lastly 9.3980 ± 2.654 cells per mm2 in annealed. Statistical analysis showed no significant differences in terms of CD68+ cells infiltrated into the walls of all scaffolds.
GFAP staining showed reactive astrocytosis surrounding each implant at 1 month (Fig. 3b): GFAP were present at the borders of the scaffold areas, forming an intense glial border. Their response occurs often later than the microglial one and is associated with a cytotrophic process. GFAP immunoreactivity was 0.0250 ± 0.002 mm2, 0.0325 ± 0.006 mm2, 0.0227 ± 0.002 mm2, 0.0416 ± 0.006 mm2, 0.0228 ± 0.002 mm2 respectively in sham-operated, blend, coaxial I, coaxial II and annealed experimental groups.
We also tested the implantation site for the reactivity against fibroblast and collagen IV markers (Fig. 3c). Fibroblasts play an essential role in the synthesis of all collagens and, in particular, of collagen IV, one of the main components of the basement membrane in the nervous tissue. The averaged reactivity area for fibroblasts in sham-operated animals was 0.0285 ± 0.003 mm2, whereas it was 0.0147 ± 0.003 mm2, 0.0209 ± 0.005 mm2, 0.0251 ± 0.003 mm2, and 0.0164 ± 0.006 mm2 in the blend, coaxial I, coaxial II and annealed experimental groups respectively. No significant difference was observed. On the other hand the averaged reactivity area for collagen IV was 0.0507 ± 0.012 mm2 in sham operated animals; 0.0227 ± 0.003 in the blend experimental group; 0.0364 ± 0.005 in coaxial I; 0.0426 ± 0.007 in coaxial II and 0.0260 ± 0.005 in animals receiving annealed scaffolds. The results show significantly greater reactivity of collagen IV in the sham group in comparison with the annealed and blend groups (*p < 0.05).
According to Fig S2 in the ESI,† one month after transplantation of the new nanofibrous scaffolds, the implant was found to integrate well into the healthy host spinal cord: numerous cells stained by DAPI were detected throughout the implants. To assess axonal regeneration immunolabeling with GAP43, a marker for axonal growth, showed single fibers infiltrating the scaffold nanofibers. Fluorescence microscopy showed regenerating axons clearly visible in the conduits.
3. Discussion
In the last decade, nanofibrous scaffolds have entered the group of the most promising scaffolds for tissue engineering applications, providing novel alternative approaches for neural regeneration.21Electrospinning is a promising technology for the fabrication of nano- and micro-fibrous scaffolds for tissue engineering.22–24 Our previous studies showed that electrospun polymeric guidance channels loaded with functionalized SAPs, when transplanted into the cavity caused by chronic SCI, provided a significant ingrowth of newly formed nerve tissue among and within the guidance channels over a six-month period, fostering functional regeneration and behavioral recovery.5
Moving a step forward from nanofibrous polymeric microchannels, in the current study we synthesized and characterized coaxial nanofibrous scaffolds made of polymers and SAPs with a core–sheath structure using coaxial electrospinning. In this work PCL has been used as a flexible biopolymer to overcome the brittle properties of PLGA, in return PLGA improved the hydrophilicity of PCL25 to enhance cellular adhesion.26 Nonetheless SAPs have already been shown to provide superior biochemical properties and biocompatibility, whereas lacking in user handling and spatial arrangement design tailorability. Incorporation of Ac-FAQ, a functionalized SAP with considerable neuroregenerative potential, aimed at improving cell adhesion and migration in the case of neural tissue engineering.12 Therefore, in the current study we compared the neuroregenerative potential of PCL–PLGA microchannels coaxially co-spun with encapsulated/emulsionated SAPs. Reference materials include conventionally electrospun PCL–PLGA and an annealed coaxial sample. The SEM images (Fig. 1a) display in coaxial I and coaxial II samples continuous and smooth cylindrical morphology, and randomly oriented fibers with a fairly uniform diameter. Annealed samples are characterized by fibers melted in patches and beads, but with a clearly visible porous structure.
Indeed in FTIR analysis, a number of small peaks typical of peptides were detected in SAP blended scaffolds: these results clearly indicated that the peptides were incorporated into nanofibers on coaxial I and coaxial II.
DSC indicates that electrospinning produces slightly less ordered crystals, with a more than 5 °C decrease in melting point compared to pure PCL, in the blend and coaxial I samples. This difference is not so intense as to cause a decrease in the local mechanical properties. However in the coaxial II sample the decrease is more pronounced (≈12 °C): this should be considered in evaluating the performance of this material due to its reduced mechanical properties.
Biological response was evaluated by seeding mNSCs onto flat electrospun covered coverslips. At 7 DIV in differentiating media mNSCs cultured on coaxial I scaffolds showed a spread and branched morphology comparable to those of Cultrex-treated wells, similar to adult neural cells evenly covering the scaffold top surfaces. Along this line no significant difference was detected between cells on coaxial I and on Cultrex, obtaining values similar to the cell viability assay.
On the contrary smaller mNSC populations were observed over blend and annealed scaffolds, with poorly branched round cell clusters, resembling immature mNSCs proliferated as neurospheres. In this case, MTS results showed significant differences compared to mNSCs on Cultrex. Instead mNSCs showed cell populations on coaxial II with a branched cell morphology similar to coaxial I but not similar cell viability: this may be given by an imperfect coaxial spinning (burst effect of the water solvent used for the inner core) that, on the other hand, still kept most of the Ac-FAQ SAP within the inner core of the electrospun fibers.27 This result is probably due to the absence of adhesion site surface coating on blend, annealed and coaxial II scaffolds, whereas naturally derived materials, as Cultrex, contain biological adhesion proteins such as fibronectin and laminin.
On the other hand coaxial I contains Ac-FAQ functionalized SAP in the outer shell that promotes mNSC attachment, whereas blend, annealed and coaxial II polymeric scaffolds lack specific cell adhesion sites.28
Besides low cytotoxicity of the tested biomaterials, an ideal scaffold for stem cell transplantation in neural regenerative therapy should also coax the differentiation of NSCs to be transplanted.29 In this direction, we then assessed the phenotypes of differentiated mNSC progenies. In every scaffold, neuronal and glial phenotypes were present. Immunofluorescence imaging of neurons showed an organized network which resembles mature neurons obtained on Cultrex and in all scaffolds the percentage of beta III tubulin positive cells confirmed morphological observations.
The one-week differentiation of mNSCs on implants revealed that the GFAP+ cells with a star shape were the dominant cell type in all circumstances, but in the blend and annealed samples these glial cells significantly decreased with respect to Cultrex, probably due to the hydrophobic characteristics of PCL that leads to lower cell adhesion; therefore, the present studies demonstrate that the blend and annealed scaffolds could discourage the mNSC differentiation into astrocytes, which is much desirable in therapy targeting SCI.30,31
In addition, with GalC/O4 markers the topography of blend and annealed samples is different: blended nanofibres lead to reduction of cell population positive for GalC/O4 and these data are probably due to the fiber diameter because the annealed scaffold presents thicker fibers compared to the blend.32
One of the important goals of this study was to study host tissue response to the implantation of coaxial scaffolds in healthy spinal cords. Macrophages are the primary cells of chronic inflammation and are known to be responsible for producing numerous biologically active agents to implanted biomaterials.4 Macrophage interactions with foreign and implanted materials have been extensively reported in the literature.33,34
Here scaffolds were implanted intramedullary and the overall histology showed good integration of all scaffolds into CNS without cavities between scaffolds and host-tissue.
Measures of the inflammation response to the implanted biomaterials were studied by activated microglia and macrophage responses. IBA1–CD68 positive cells were found at 1 month in all cases including sham-operated tissue: largely as a result of the incision surgery to the spinal cord during implantation.
IBA1 and CD68 cell densities near to implant showed similar observations in sham-operated and in coaxial II groups; but these results in comparison with the coaxial I sample showed significant differences, suggesting that Ac-FAQ functionalized SAP, contained in the shell, did not exacerbate the inflammatory response.12 By evaluating the cell densities of IBA1+ and CD68+ cells within implant walls we demonstrated that in the annealed scaffolds there was a significant reduction of IBA1+ cells with respect to the others due to fused fibers hampering cell infiltration. In all wall scaffolds the activated macrophages (CD68+ cells) are less than IBA1+ cells, indicating that these scaffolds when implanted into the spinal cords elicit a foreign body response similar to conventional blend scaffolds.5 GFAP positive reactive astrocytes were also present around the implants. The post-surgery response of astrocytes is characterized by hyperplasia and hypertrophy of cell bodies.35,36 Some studies demonstrated that astrocytes positively influence the neural repair process: they facilitate neuronal sprouting37,38 and exert a cytotrophic effect on neurons through the secretion of growth factors and guidance molecules.38,39 A majority of the GFAP reactivity was attributed to surgery and not as a direct effect of the implanted biomaterials because there weren't significant differences among the sham-operated and all other experimental groups.
Lastly we studied immunofluorescence staining for collagen IV, one the main structural components of the basement membrane in the nervous system. In our previous study, collagen IV deposition has been detected both nearby and within the conduit inner walls in concurrence with regenerated fibers.40 The reactivity area positive for collagen IV in coaxial I and coaxial II near to implant had values comparable with data obtained in the sham group. These values suggest the preservation of a permissive microenvironment for the regeneration of CNS tissue. On the other hand, the amount of collagen IV was significantly lower in the case of blended and annealed nanofibers. These studies clearly demonstrated the superiority of SAP blended/encapsulated coaxial nanofiber scaffolds.
Based on these facts, the in vivo results show that coaxial I displays immune response lower than the sham-operated group and the highest NSC viability in vitro.
Using the GAP43 antibody, we found many axons growing inside the implants along the biomaterial conduits: some of those co-localized with SMI31 immunostaining.
The biofunctionalization with the FAQ motif has improved NSC cultures as expected but may also have improved interactions with host tissues by simply displaying the peptide functional motifs. This seems to favor coaxial I as a scaffold for nervous system regeneration, in particular if NSC transplantation is considered a part of the multi-disciplinary therapeutic approach.
Coaxial techniques show great potential for controlled drug delivery applications and, supported by our results, can be further improved with emulsifications of functionalized SAPs to be used in the field of regenerative medicine with various applications such as promoting nervous system regeneration in SCI.5
4. Conclusion
Functionalization and spatial orientation of ECM mimicking nanofibers are desirable for neural tissue regeneration. Therefore we here reported the functionalization of electrospun nanofibrous microchannels for SCI. Blending and encapsulation of functionalized self-assembling peptides via coaxial electrospinning circumvented the use of chemical cross-linking or immobilization reactions for specific biofunctionalizations. The smooth and continuous coaxial nanofibers did not show any significant change in the surface as well as bulk properties due to incorporation of SAPs. On the other hand in vitro and in vivo studies showed a profound effect due to SAP incorporation. In in vitro experiments NSCs were used for their potential use in neural tissue engineering as well as their ability to differentiate into various neural cells.41–43 Our results proved promising interactions of the tested scaffolds with cells from the CNS. On the other hand in vivo experiments showed a satisfactory low host response to the novel implants, thus paving the way to their application in experiments for regeneration of the damaged tissue caused by chronic SCI in the near future.55. Method
Ac-FAQ was synthesized as previously described.12 PLGA, (75:25, MW 66000–107000) and PCL (MW 80000) were purchased from Sigma Aldrich, USA. Chloroform and methanol (HPLC grade) solvents used for electrospinning were obtained from VWR.
5.1 Fabrication of microfibrous meshes and microchannels
The electrospinning setup used in this study was designed specifically for this project and consisted of a syringe pump (NewEra Pump System Inc., USA), a high voltage power supply (Spellman, USA), a copper plate for collection of fibers on glass cover slips and an adjustable rotatory mandrel for microchannel fabrication. For coaxial electrospinning a coaxial needle was purchased from Ramehart, USA with the following diameters: shell needle: 0.8192 mm (outer diameter) and 0.51 mm (inner diameter), core needle: 0.4636 mm (outer diameter) and 0.260 mm (inner diameter). The 9.5% w/w PCL (5.5% w/w) + PLGA (4% w/w) polymer solution was prepared in 3:1 chloroform and methanol solution. PCL/PLGA solution was prepared 24 hours prior to the experiment. Before the experiment an emulsion with Ac-FAQ was prepared with the PCL–PLGA solution. A 33G microneedle (Hamilton needle, outer diameter = 200 μm) as the target was fixed in the rotating arm of the mandrel and the grounding electrode (8 mm copper plate) was placed just below the needle and connected with a grounding cable. The polymer solutions were loaded into a syringe and mounted on a syringe pump. A co-axial needle was connected with both syringes. Before electrospinning the mandrel was turned on and inspected for a possible contact between the rotating needle and the ground electrode. After confirming the alignment of the needle and non-contact mode with the copper plate the power supply was turned on. A detailed description is provided in Table 1.
:200 μl and vortexed for 5 minutes. The partial miscibility of polymeric solvents (chloroform and methanol) with peptide solvent (water) facilitated the equal distribution of peptide solution into the polymeric solution. A milky white emulsified solution with low viscosity was obtained after 5 minutes of vortexing. The emulsified solution and polymer solution were loaded into separate syringes and connected to the coaxial needle with silicon tubes. The core solution, i.e. peptide polymer emulsion was pumped at 0.05 ml min−1 whereas the shell solution, i.e. PCL–PLGA was pumped at 0.1 ml min−1. The distance between the needle tip of the syringe and the collector plate/mandrel was set at 30 cm. The voltage applied between the electrodes was set at 1 kV cm−1. For in vitro studies pre-sterilized glass coverslips (diameter 1 cm2) were fixed on the collector plate for homogeneous deposition of fibers. For microchannel fabrication a Hamilton needle was used as a target and fixed on the edge of the rotatory mandrel and set at 30 rpm.
All samples (mesh and microchannels) were lyophilized for 48 hours after synthesis and used for further experiments.
Peptide stability was verified via electro-spraying and subsequent HPLC and LC-MC tests (see the ESI and Fig S3† for details).
5.2 Scanning electron microscopy
The fiber diameter and surface morphology were characterized using a scanning electron microscope (SEM), (Tescan, Czech Republic). A representative section of the deposited microfibrous matrix was sputter-coated with gold and was observed under the SEM at a working distance of 10 mm and an accelerating voltage of 20 kV.5.3 Water contact angle measurement
The change in PCL–PLGA nanofibrous hydrophobicity was measured by contact angle relaxation of water droplet by the sessile drop method using a contact angle goniometer (OCA 15EC Dataphysics). After lyophilization the 1 × 1 cm electrospun matrix was then attached to a silicon wafer for contact angle measurements. Three samples were used for each category and two measurements were performed on each sample. Therefore, the average of six measurements for each category was used for the current study. In each measurement, a droplet of deionized water (4 μl) was pipetted onto the membrane surface. Images of the water droplet were taken using a high-speed digital camera and a circular fitting method was used for contact angle measurements (see the ESI and Fig S4† for details). All contact angle measurements were performed at 25 °C and the baseline was corrected manually.5.4 Fourier transform infrared spectroscopy
In order to characterize the nanofibrous surface and peptide integration ATR-FTIR spectroscopy was conducted using a PerkinElmer (Spectrum 100) FTIR spectrometer. The control of the instrument as well as collection and primary analysis of data were accomplished using inbuilt Spectrum version 6.3.2. Prior to data acquisition, the optical bench was purged with dry N2 to minimize external interference. For each run, a total of 60 scans were collected at a resolution of 4 cm−1. In order to minimize the possibility of error, the FTIR spectra of all samples were recorded at least three times at random locations. Each recorded spectrum was corrected for background (atmospheric components). All spectra were recorded at 25 °C.5.5 Thermal analysis
Differential scanning calorimetry (DSC) analysis was performed on a Mettler-Toledo DSC 1 under a dynamic nitrogen atmosphere (80 mL min−1), using 6–8 mg of sample contained in a 40 μL aluminum pan. Blend, coaxial I and coaxial II nanofibrous films were analyzed with a three-step program. A first heating ramp from −100 °C to 200 °C with 20 °C min−1 was followed by cooling at 20 °C min−1 and by a second heating from −100 °C to 200 °C with 20 °C min−1. Enthalpy associated with phase transitions was measured by integrating the relevant peaks with the STARe software. All experiments were conducted in triplicates. The DSC cell was calibrated with indium (melting point 156 °C) and zinc (melting point 419.4 °C) standards. As reference, pure PCL and PLGA pellets were also analyzed.5.6 Scaffold preparation for in vitro and in vivo tests
In in vitro tests scaffolds were electrospun onto glass coverslips while microchannels were obtained for in vivo experiments (see the “fabrication of microfibrous meshes and microchannels section”). Circular glass coverslips were sterilized using UV radiation for 1 h and washed three times with sterile PBS for 15 minutes; instead, electrospun microchannels, soaked in PBS, were sterilized using UV radiation for 1 h and then they were used for in vivo implants.5.7 NSC cultures
Neural stem cell cultures were established and expanded as previously described. Briefly, murine NSCs (mNSCs) were isolated from the Subventricular Zone (SVZ), a subependymal region of the lateral ventricles of 8-week-old CD-1 albino mice striata and cultured until passage 10.
In vitro tests were performed adapting the procedure previously described by authors.10 mNSCs were cultured to a neurosphere state and at passage 10 they were mechanically dissociated and, on the day after, seeded onto electrospun circular glass coverslips at a density of 3 × 10⁴ cells per well (1 cm2). For both viability and differentiation tests, basal medium supplemented with βFGF (10 ng ml−1) has been used. After 2 days in vitro (DIV), the medium was changed with a medium containing Leukemia Inhibitory Factor (LIF, Chemicon) (20 ng ml−1) and Brain Derived Neurotrophic Factor (BDNF, Peprotech) (20 ng ml−1) to pursue the neuronal and glial population maturation in NSC progeny. For both viability and differentiation assays the positive control consisted of the Cultrex-BME® substrate (R&D systems) diluted in basal medium (1:100).
To study the cell proliferation on different electrospun scaffolds, viable cells were quantified by using the colorimetric MTS assay, this reagent contains a tetrazolium compound that is bioreduced by cells into a colored formazan product, and this conversion is produced by metabolically active cells. After 7 days of cell seeding in a 48-well plate, cells were incubated with a 20% solution of MTS reagent. After 1 h of incubation at 37 °C in 5% CO2, aliquots were pipetted into 96 multiwell plates. The absorbance of each sample, directly proportional to the number of live cells, was measured at 490 nm using a spectrophotometric microplate reader (Synergy H1 Hybrid Multi-Mode Microplate Reader, BioTek).
:500, DakoCytomation), mouse anti-beta III tubulin (1:500, Covance), mouse anti-GalC (1:200, Chemicon) and anti-O4 (1:200, Chemicon). Secondary antibodies were goat anti-Mouse Alexa 488 (1:1000, Molecular Probes), goat anti-Mouse Cy3 (1:1000, Jackson Immunoresearch), and goat anti-Rabbit Cy3 (1:1000, Jackson Immunoresearch). Cell nuclei were counterstained with DAPI (Molecular Probes). Quantitative analyses were performed by counting 100–300 cells for each of 9 randomly chosen for each independent experiment. Fluorescence images of the adhering cells were acquired by using an inverted fluorescence microscope, via a Zeiss microscope Axioplan 2 and a ApoTome System.
5.8 Microchannel implantation into rodent spinal cord tissue (experimental design)
15 adult female Sprague-Dawley (SD) rats were used. All procedures were carried out with protocols approved by Institutional Animal Care and Use Committee of the University of Milan-Bicocca (IACUC 130/2014-B) and were performed according to EC guidelines (86/609/EEC), to the Italian legislation on animal experimentation (Decreto L.vo 116/92).The animals (Harlan Laboratories, Italy) (250–275 g) were housed 2–3 rats per cage, given free access to food and water, and kept on a 12/12 h light/dark cycle.
The implantation surgeries were performed under strict sterile conditions. For implantation, rats were deeply anesthetized with an intraperitoneal injection of ketamine (80 mg kg−1) and xylazine (10 mg kg−1). When unresponsive to toe pinch, the dorsal was shaved following incision of the dorsal skin, and a dorsal laminectomy was performed to expose the dura overlying the spinal cord at thoracic level T9–T10.
The vertebral column was stabilized by clamping the column at vertebra T8 and T11. Longitudinal incisions were made into the dura and the underlying spinal cord at 1 mm lateral to either side of the midline (sham group). Offset between the two incisions was 5 mm. 2 Microtubes (1 mm in length) of the same typology were inserted into each of the two incision sites (treated group) at the thoracic level T9–T10. We tested the following microchannels: blend, coaxial I, coaxial II and annealed. We chose to implant two types of microchannels per animal in far apart incision sites along the spinal cord in order to minimize animal sacrifice: we also rotated the couple of each type of implants per animal.
Following implantation, the overlying muscle and skin were closed with vicryl sutures and metal clips, respectively.
Animals were monitored after implantation for one month and no significant behavioral changes or other adverse changes were observed. Rats were treated daily for one week with an analgesic (carprofen, 5 mg kg−1) and an antibiotic (enrofloxacin, 5 mg kg−1).
Animals were sacrificed by cardiac perfusion under terminal anesthesia using PFA4%. Once removed, spinal cords were post fixed overnight in PFA4% and tissues were cryopreserved in 30% sucrose and cut on a frozen blade cryostat into 16 μm thick longitudinal sections. Sections were cut serially, three per glass.
For staining of macrophages and microglia, slices were washed with PBS, permeabilized with 0.1% Triton X-100 and treated with 10% normal goat serum (NGS). We used the following primary antibodies: mouse anti-CD68 (1:500, Serotec), rabbit anti-IBA1 (1:1000, Wako).
For immunofluorescence analysis of gliosis, we used mouse-anti glial fibrillary acidic protein (GFAP) (1:500, Millipore). For immunofluorescence staining of the basement membrane, we used rabbit anti-collagen IV (1:100, Cedarlane), mouse anti-Fibroblast (1:400, Acris).
For axonal regeneration analysis, immunohistochemistry was performed with rabbit-antigrowth associated protein-43 (GAP-43) (1:100, Chemicon). Finally, mouse-anti-SMI-31 (1:1000, Covance) was used to analyze phosphorylated neurofilaments.
To reveal primary antibodies we used the following secondary antibodies: goat anti-rabbit Cy3 (1:1000, Jackson) and goat anti-mouse Alexa 488 (1:1000, Invitrogen). Sections were counterstained with DAPI and mounted with FluorSave reagent (Calbiochem).
To standardize the results, all measurements were made from digital pictures taken on a Zeiss Apotome microscope at 20× magnification and performed via ImageJ software. Cell density for IBA1 and CD68 markers was evaluated near to implant and within the implant wall. Quantification of GFAP reactivity area on the implant site was performed on longitudinal sections using ImageJ software. The color images of the implant site of cells positive to GFAP were converted into binary images; areas were quantified by measuring the number of positive pixels. Pixel area was converted to mm2 and measurements were averaged over all sections per animal in order to quantify the reactivity area of each scaffold per each animal. The same methodology was chosen for fibroblast and collagen IV markers.
5.9 Overall statistical analysis
Data were processed using GraphPad Prism 5 software. Contact angle measurements were analyzed using one-way ANOVA and subsequent Tukey's HSD post-hoc test. Values are reported as means ± standard error of the mean (SEM). In the in vitro study, MTS assay was analyzed via one-way ANOVA followed by Dunnett's multiple comparison test; beta III tubulin and GFAP were evaluated by two-way ANOVA followed by the Bonferroni post-test; GalC-O4 was performed via one-way ANOVA followed by Dunnett's multiple comparison test. In the in vivo study, IBA1/CD68 and fibroblast/collagen IV significance tests were carried out by two-way ANOVA followed by the Bonferroni post-test; finally GFAP marker was analyzed by one-way ANOVA followed by Tukey's multiple comparison test.Acknowledgements
This work was supported by Fondazione Cariplo, grant no. 2011-0352, by Vertical Onlus and by the “Ricerca Corrente 2011” funding granted by the Italian Ministry of Health and by the “5 × 1000” voluntary contributions.References
- C. H. Tator and M. G. Fehlings, J. Neurosurg., 1991, 75, 15–26 CrossRef CAS PubMed.
- A. Raspa, G. A. A. Saracino, R. Pugliese, D. Silva, D. Cigognini, A. Vescovi and F. Gelain, Adv. Funct. Mater., 2014, 24, 6317–6328 CrossRef CAS.
- D. F. Williams, Biomaterials, 2008, 29, 2941–2953 CrossRef CAS PubMed.
- J. M. Anderson, A. Rodriguez and D. T. Chang, Semin. Immunol., 2008, 20, 86–100 CrossRef CAS PubMed.
- F. Gelain, S. Panseri, S. Antonini, C. Cunha, M. Donega, J. Lowery, F. Taraballi, G. Cerri, M. Montagna, F. Baldissera and A. Vescovi, ACS Nano, 2011, 5, 227–236 CrossRef CAS PubMed.
- W. J. Li, C. T. Laurencin, E. J. Caterson, R. S. Tuan and F. K. Ko, J. Biomed. Mater. Res., 2002, 60, 613–621 CrossRef CAS PubMed.
- M. Shin, O. Ishii, T. Sueda and J. P. Vacanti, Biomaterials, 2004, 25, 3717–3723 CrossRef CAS PubMed.
- X. Zong, K. Kim, D. Fang, S. Ran, B. S. Hsiao and K. Chu, Polymer, 2002, 43, 4403–4412 CrossRef CAS.
- D. H. Reneker, W. Kataphinan, A. Theron, E. Zussman and A. L. Yarin, Polymer, 2002, 43, 6785–6794 CrossRef CAS.
- F. Gelain, D. Bottai, A. Vescovi and S. Zhang, PLoS One, 2006, 1, e119 Search PubMed.
- G. A. Silva, C. Czeisler, K. L. Niece, E. Beniash, D. A. Harrington, J. A. Kessler and S. I. Stupp, Science, 2004, 303, 1352–1355 CrossRef CAS PubMed.
- F. Gelain, D. Cigognini, A. Caprini, D. Silva, B. Colleoni, M. Donega, S. Antonini, B. E. Cohen and A. Vescovi, Nanoscale, 2012, 4, 2946–2957 RSC.
- F. Zamani, M. Amani-Tehran, M. Latifi and M. A. Shokrgozar, J. Mater. Sci. Mater. Med., 2013, 24, 1551–1560 CrossRef CAS PubMed.
- J. Xie, M. R. MacEwan, A. G. Schwartz and Y. Xia, Nanoscale, 2010, 2, 35–44 RSC.
- Y. Z. Zhang, X. Wang, Y. Feng, J. Li, C. T. Lim and S. Ramakrishna, Biomacromolecules, 2006, 7, 1049–1057 CrossRef CAS PubMed.
- H. Jiang, Y. Hu, Y. Li, P. Zhao, K. Zhu and W. Chen, J. Controlled Release, 2005, 108, 237–243 CrossRef CAS PubMed.
- H. Jiang, Y. Hu, P. Zhao, Y. Li and K. Zhu, J. Biomed. Mater. Res., Part B, 2006, 79, 50–57 CrossRef PubMed.
- Z. Sun, E. Zussman, A. L. Yarin, J. H. Wendorff and A. Greiner, Adv. Mater., 2003, 15, 1929–1932 CrossRef CAS.
- C. L. He, Z. M. Huang, X. J. Han, L. Liu, H. S. Zhang and L. S. Chen, J. Macromol. Sci., 2006, 45, 515–524 CAS.
- Z. G. Tang, J. T. Callaghan and J. A. Hunt, Biomaterials, 2005, 26, 6618–6624 CrossRef CAS PubMed.
- H. Cao, T. Liu and S. Y. Chew, Adv. Drug Delivery Rev., 2009, 61, 1055–1064 CrossRef CAS PubMed.
- M. M. Stevens and J. H. George, Science, 2005, 310, 1135–1138 CrossRef CAS PubMed.
- P. X. Ma, Adv. Drug Delivery Rev., 2008, 60, 184–198 CrossRef CAS PubMed.
- T. Dvir, B. P. Timko, D. S. Kohane and R. Langer, Nat. Nanotechnol., 2011, 6, 13–22 CrossRef CAS PubMed.
- J. Y. Kim and D. W. Cho, Microelectron. Eng., 2009, 86, 1447–1450 CrossRef CAS.
- N. T. Hiep and B. T. Lee, J. Mater. Sci. Mater. Med., 2010, 21, 1969–1978 CrossRef CAS PubMed.
- Y. Su, X. Li, Y. Liu, Q. Su, M. L. Qiang and X. Mo, J. Biomater. Sci., Polym. Ed., 2011, 22, 165–177 CrossRef CAS PubMed.
- F. Gelain, A. Lomander, A. L. Vescovi and S. Zhang, J. Nanosci. Nanotechnol., 2007, 7, 424–434 CrossRef CAS PubMed.
- J. R. Thonhoff, D. I. Lou, P. M. Jordan, X. Zhao and P. Wu, Brain Res., 2008, 1187, 42–51 CrossRef CAS PubMed.
- J. Silver and J. H. Miller, Nat. Rev. Neurosci., 2004, 5, 146–156 CrossRef CAS PubMed.
- Z. Su, W. Niu, M. L. Liu, Y. Zou and C. L. Zhang, Nat. Commun., 2014, 5, 3338 Search PubMed.
- G. T. Christopherson, H. Song and H. Q. Mao, Biomaterials, 2009, 30, 556–564 CrossRef CAS PubMed.
- Q. Zhao, N. Topham, J. M. Anderson, A. Hiltner, G. Lodoen and C. R. Payet, J. Biomed. Mater. Res., 1991, 25, 177–183 CrossRef CAS PubMed.
- J. M. Anderson, Annu. Rev. Mater. Res., 2001, 31, 81–110 CrossRef CAS.
- D. Stanic, W. Tripanichkul, J. Drago, D. I. Finkelstein and M. K. Horne, Brain Res., 2004, 1023, 83–91 CrossRef CAS PubMed.
- C. L. Parish, D. I. Finkelstein, W. Tripanichkul, A. R. Satoskar, J. Drago and M. K. Horne, J. Neurosci., 2002, 22, 8034–8041 CAS.
- D. R. Nisbet, K. E. Crompton, M. K. Horne, D. I. Finkelstein and J. S. Forsythe, J. Biomed. Mater. Res., Part B, 2008, 87, 251–263 CrossRef PubMed.
- P. E. Batchelor, G. T. Liberatore, J. Y. Wong, M. J. Porritt, F. Frerichs, G. A. Donnan and D. W. Howells, J. Neurosci., 1999, 19, 1708–1716 CAS.
- P. E. Batchelor, M. J. Porritt, P. Martinello, C. L. Parish, G. T. Liberatore, G. A. Donnan and D. W. Howells, Mol. Cell Neurosci., 2002, 21, 436–453 CrossRef CAS PubMed.
- S. Panseri, C. Cunha, J. Lowery, U. Del Carro, F. Taraballi, S. Amadio, A. Vescovi and F. Gelain, BMC Biotechnol., 2008, 8, 39 CrossRef PubMed.
- J. L. McBride, S. P. Behrstock, E. Y. Chen, R. J. Jakel, I. Siegel, C. N. Svendsen and J. H. Kordower, J. Comput. Neurol., 2004, 475, 211–219 CrossRef PubMed.
- K. Chu, M. Kim, K. I. Park, S. W. Jeong, H. K. Park, K. H. Jung, S. T. Lee, L. Kang, K. Lee, D. K. Park, S. U. Kim and J. K. Roh, Brain Res., 2004, 1016, 145–153 CrossRef CAS PubMed.
- S. Pluchino, A. Quattrini, E. Brambilla, A. Gritti, G. Salani, G. Dina, R. Galli, U. Del Carro, S. Amadio, A. Bergami, R. Furlan, G. Comi, A. L. Vescovi and G. Martino, Nature, 2003, 422, 688–694 CrossRef CAS PubMed.
Footnote |
| † Electronic supplementary information (ESI) available: In vivo analysis to evaluate tissue reaction in the scaffold implant walls (Fig. S1) and to test axonal regeneration (Fig. S2). Waters LC-MS Alliance-3100 analysis to confirm the molecular weight and the integrity of peptides following the electrospray process (Fig. S3). Water contact angle of electrospun nanofibrous mats (Fig. S4). See DOI: 10.1039/c5nr03698d |
| This journal is © The Royal Society of Chemistry 2016 |