
 Open Access Article
 This Open Access Article is licensed under a Creative Commons Attribution-Non Commercial 3.0 Unported Licence
Characterization of microscopic disorder in reconstructed porous materials and assessment of mass transport-relevant structural descriptors
Tibor
Müllner
a,
Klaus K.
Unger
b and
Ulrich
Tallarek
*a
aDepartment of Chemistry, Philipps-Universität Marburg, Hans-Meerwein-Strasse 4, D-35032 Marburg, Germany. E-mail: tallarek@staff.uni-marburg.de; Fax: +49-6421-28-27065; Tel: +49-6421-28-25727
bInstitute of Inorganic Chemistry and Analytical Chemistry, Johannes Gutenberg-Universität Mainz, Duesbergweg 10-14, D-55128 Mainz, Germany
First published on 4th February 2016
Abstract
The targeted optimization of the functional properties of porous materials includes the understanding of their transport properties and thus requires knowledge about the relationship between material synthesis, resulting in three-dimensional material morphology, and relevant transport properties. In this Perspective, we present our views and results on the characterization of microscopic disorder in functional porous materials, which are widely used today as fixed beds in adsorption, separation, and catalysis. This allows us to identify structural parameters that impact their mass transport properties and eventually their overall performance in technological operations. We address this complex topic at the following levels: (i) computer-generation of disordered packings allows the systematic investigation of the bed porosity (packing density) and degree of packing heterogeneity. These studies are complemented by the physical reconstruction of real packed and monolithic beds, which resolves the salient features of the packing process and monolith synthesis that are under the control of the experimentalist. (ii) Once reconstructed packed-bed and monolith morphologies are available, they are analysed by statistical methods to derive structural descriptors for their mass transport properties. Spatial tessellation schemes and chord length distributions are shown to be suitable for that purpose. They lead us to sensitive correlations of the degree of pore-environment heterogeneity and packing-scale disorder with the dynamics of (random) diffusion and (flow-field dependent) hydrodynamic dispersion, respectively. (iii) Direct or pore-scale numerical simulations are implemented on a high-performance computing platform to quantify the relevant transport properties of the materials. This complementary approach highlights the morphological descriptors of mass transport efficiency. They are validated by the simulations and in the future could direct the rational design of materials from their synthesis to targeted applications based on physical reconstruction.
 Tibor Müllner |
 Klaus K. Unger |
 Ulrich Tallarek | Ulrich Tallarek studied chemistry in Tübingen (Germany), where he obtained his PhD in 1998. After postdoctoral research in Wageningen (The Netherlands), he finished his habilitation in Magdeburg (2004) and received a venia legendi for physical chemistry. Since 2007 he has been a professor of chemistry in Marburg. His research focuses on the functional and transport properties of porous materials for separation and catalysis. |
1 Introduction
The establishment of quantitative relationships between the morphology of microscopically disordered porous materials and their effective mass transport properties1,2 belongs to the major challenges in adsorption, separation, and catalysis.3–5 Since most applications rely on efficient mass transport, independent of a material's functionality, targeted optimization of material performance includes the understanding of relevant transport properties (and eventual transport limitations) as an essential component. It requires adequate knowledge to be gathered on the consequences of the material preparation conditions for the resulting three-dimensional (3D) material morphology and associated transport properties.Relevant mass transport properties include the effective diffusion and hydrodynamic dispersion coefficients. They represent, respectively, diffusion-limited obstructed transport in tortuous stagnant regions of a material (mesopores and/or micropores) and advection-dominated transport in its flow-through domain (macropores). These different pore spaces are required and typically subject to a hierarchical design,6–12i.e., the macropores, mesopores, and/or micropores (depending on application) are arranged in discrete domains (contrary to a random assignment of different pore sizes for the construction of a pore network), which also results in specific mass transport regimes as well as limitations in these pore domains. For example, the interparticle and interskeleton void space of particulate packed beds and monoliths used as fixed-bed adsorbers, separators, and reactors consists of interconnected macropores (dpore > 50 nm), while mesopores (50 nm ≥ dpore ≥ 2 nm) and/or micropores (dpore < 2 nm) form a network inside the particles or the monolith skeleton. The flow-through macropores (porosity and mean pore size) determine hydraulic permeability, important for targeted analysis speed and sample throughput governed by advective transport (gas or liquid flow), whereas the micropores and/or mesopores tailor the required surface area as well as diffusion mechanisms and regimes (surface and bulk diffusion; Knudsen diffusion).
The heterogeneous porosity distribution in functional materials can be responsible for severe performance limitations resulting from a low process efficiency or short device lifetime, addressing applications such as high-throughput screening in catalysis13 (high speed) and high-resolution separations14,15 (high efficiency), or the problem of catalyst, battery and fuel cell degradation16–19 (high durability). Because the underlying morphology–transport relationships can be neither inferred from visual inspection of a material nor from two-dimensional (2D) mass transport simulations unless microscopic order allows for a reduction of dimensionality, its 3D physical reconstruction and/or computer-generation – together with the detailed morphological analysis and 3D modeling of relevant transport phenomena – provides the only direct as well as the most realistic approach to understand and optimize a porous material's structure. A great challenge results from the random and heterogeneous nature of porous materials. In this regard, computer simulations provide the exceptional possibility to evaluate the mass transfer properties of reconstructed materials and systematically analyse the dependence of material performance on the individual morphological parameters (e.g. porosity, pore size distribution, and characteristic dimensions of the different spatial domains) and fluid as well as analyte transport parameters (e.g. volumetric flow rate and diffusion coefficient).
A real porous medium results from a complex formation process and has definite properties that cannot be altered deliberately by the experimentalist. In contrast, computer-generated models of porous media, such as random sphere packings, which are good models to study flow and mass transport in particulate columns for adsorption, separation, and catalysis, allow the systematic variation of packing properties, e.g. bed porosity (interparticle void volume fraction), particle porosity, particle size distribution, and packing heterogeneity independently from other parameters.20 Random sphere packings, for example, can be computer-generated with high reproducibility over a range of packing densities up to the random-close packing limit.21 This is a pre-requisite to study the porosity-scaling of transport coefficients for hydraulic permeability, effective diffusion, and hydrodynamic dispersion, or the dependence of these coefficients on the microstructural heterogeneity at a given bed porosity.22–27
Regarding 3D physical reconstruction of a material (as opposed to its computer-generation) we today get increasing access to a steadily growing pool of advanced imaging and reconstruction techniques. These are specifically developed for that purpose – from atomic-scale resolution at the surface (e.g. of a catalyst particle), where elementary reaction or adsorption processes occur, to the characteristic device lengths (e.g. the entire diameter of a laboratory-scale fixed-bed reactor), which impact the macroscale behavior of residence time distributions.28–34 On the other hand, an unacceptable mismatch accumulates between the plethora of new functional materials reported every month and the required knowledge about their performance-relevant (or even limiting) morphological properties.
As illustrated in Fig. 1, the assembly of a wide variety of porous materials can be regarded as following hierarchical concepts, which involves the organization of matter on different length scales and through different operational principles.35 On the smallest, molecular scale (tier 1 in Fig. 1), the atoms or molecules form three different states of matter: (i) random, amorphous, glass-like; (ii) partially ordered liquid-crystal; and (iii) highly ordered crystalline. They account for the local physical and chemical properties of a material, e.g. the catalytic activity of corners, faces, and edges of crystalline materials, which is different from the catalytic activity of disordered structures. All these states can be obtained in a variety of geometrical figures, which serve as building blocks for mesostructures (tier 2 in Fig. 1). To guarantee a sufficiently large surface area for adsorption, separation, and catalysis, microporosity and/or mesoporosity is needed in these systems. Mesostructured porous materials exhibit a wealth of different appearances with varying degree of heterogeneity, regularity, and periodicity. Periodic structures can be constructed by the translation of a unit cell in lateral dimensions. Regular structures do not show this translational symmetry but follow a strict construction rule. Random structures, on the other hand, can only be described by stochastic measures, which allow us to characterize heterogeneity, typically as the width of the distribution regarding a feature of interest (e.g. mean size, pore volume, etc.).
 | ||
| Fig. 1 Occurrence of (dis)order on different (length and operational) scales. This figure illustrates how matter exhibits different degrees of (dis)order on the atomic level (tier 1) and how these building blocks of different (dis)order form (dis)ordered structures on the mesoscale (tier 2). Furthermore, mesostructures can form larger (dis)ordered structures on the macroscale (tier 3, not shown). In principle, (dis)order can be achieved independently on every hierarchy level. From Antonietti and Ozin.35 Copyright 2004 John Wiley & Sons Limited. Reproduced with permission. | ||
The mesoscale morphology, characterized by feature sizes on the order of several nanometers, determines the physical properties of a material such as mass transfer resistance and effective diffusive transport, which become important for our discussion. The directed synthesis of a designated structure can be considered as the art of modern mesochemistry and is a key to the rational design of tailored functional materials.36,37 The mesostructures may, in turn, serve as building blocks for larger macrostructures, including films, patterned devices, fibers and pillars, or regularly and irregularly shaped particles (commonly spheres, which can be assembled to form ordered or disordered beds), and monoliths. These structures may be prepared by chemical or physical methods, as their morphological features are on the order of several micrometers. In adsorption, separation, and catalysis the void spaces generated in these larger macrostructures govern the fluid flow dynamics and associated hydrodynamic dispersion.
It is insightful to look at morphological similarity throughout the different length scales. Crystals can show a morphology on the atomic scale that structural assemblies of beads show on the macroscale. Similarly, an atomic glassy state can be associated with a macroscopic disordered packing, the structure of a mesoglass with the structure of a monolith, etc. The reappearing structural motifs imply that toolboxes for the characterization of morphology should be similar throughout the different length scales. A major challenge is to establish quantitative relationships between the morphologies of this wealth of possible structures and the transport phenomena dominating on each length scale, which are relevant if not limiting to the materials' performance. The link between structural features and diffusion-limited transport on the mesoscale as well as advection-dominated transport on the macroscale, for example, plays a key role in the optimization of efficiency in adsorption, separation, and catalysis.
By using representative structures obtained from physical reconstruction (or by computer generation) and morphological descriptors as well as their correlation with the relevant transport properties, we illustrate how structure–transport relationships can be derived for porous materials. In particular, we address the impact and characterization of disorder and the degree of microstructural heterogeneity. For this purpose we use a set of structures characterized by a varying degree of disorder and/or heterogeneity. These structures include pillar arrays (2D highly ordered arrangements of cylinders), crystal-like sphere packings (3D highly ordered structures of discrete particles), random sphere packings (3D disordered structures of particles), and monoliths (amorphous continuous structures). We illustrate how individual parameters like packing density and packing protocol affect the morphology of computer-generated packings; we work with physical reconstructions of packed and monolithic beds to collect information on how experimental parameters of a packing and preparation process influence the final bed morphology; we utilize 3D mass transport simulations on a high-performance computing platform to analyze in detail the hydrodynamics and resulting dispersion. From the analysis of reconstructed porous materials with statistical methods we derive structural descriptors of mass transport (diffusion and dispersion), which have potential for refining the existing theoretical framework.
With this illustrated methodology, transport properties central to practice in adsorption, separation, and catalysis are correlated to the relevant morphological properties, which themselves reflect the preparation conditions of a hierarchically-structured fixed bed. This complementary approach leads to morphological descriptors, which guide the systematic optimization of material properties from the synthesis to targeted applications based on physical reconstruction. We first present exemplary structures of ordered and disordered porous materials in Section 2. In Section 3, we analyse and discuss their morphological properties and in Section 4 report on relevant mass transport properties to illustrate their relationships with the morphological properties. Section 5 closes with a perspective on highly interdisciplinary, advanced methodology that is (becoming) available to pave the way for a new leap in materials science.
2. Exemplary structures of porous materials
2.1 Ordered structures
When referring to ordered structures, we include all materials with pore systems (macropores or mesopores) that can be described by a unit-cell representation. Devices with ordered macropores have been employed for separation, reaction, and heat transfer.38–41 Materials containing ordered mesopores have been applied in sensing,42–44 drug release,45–49 separation,50–56 and catalysis.57–61 2D ordered structures like pillar arrays, bundles of fibers, and capillary bundles are, in general, arrangements in which one phase (solid or void) can be considered as formed by non-overlapping cylinders. Pillar arrays consist of short solid cylinders, long solid cylinders form fiber bundles. By contrast, when the cylinders make up the void phase, the structure consists of parallel cylindrical channels, i.e., a bundle of capillaries. Neglecting all effects due to a macroscopic confinement, as well as possible variations along the cylinders (e.g., bending, diminutions or widenings, etc.), the structural description as well as the investigation of mass transport properties can be reduced to a 2D approach.On the macroscale, pillar arrays can be prepared using lithographic techniques, as illustrated in Fig. 2.38 The layout of these pillars is developed using computer aided design. Here the adjusted parameters are the type of arrangement (from highly ordered to random), the pillar dimensions (diameter distribution), and the spacing between pillars. The computer aided design combined with accurate conversion to real structures makes this a noteworthy model system for evaluation of theoretical and experimental studies on structure–transport relationships. This also allows for in silico optimization of morphological features (e.g., patterns, pillar dimensions, gap sizes, etc.) for a specific application. Due to the flexibility of the lithographic preparation process arrays with a pillar diameter of a few hundred nanometers have been realised41 as well as pillars with a size of tens of micrometers.39 Also the degree of order can be systematically adjusted from a crystal-like to a stochastic arrangement.62 Similarly, aligned fibers covering a wide range of materials can be prepared by electrospinning,63,64 resulting in arrays of uniaxially aligned fibers with diameters of typically several hundred nanometers.
 | ||
| Fig. 2 Hexagonal micropillar array produced by photolithographic patterning of a silicon wafer, followed by anisotropic deep reactive ion etching and deposition of a silica layer using plasma enhanced chemical vapour deposition. Pillar diameter and spacing, 2 μm. Reprinted with permission from Kirchner et al.38 Copyright 2013 American Chemical Society. | ||
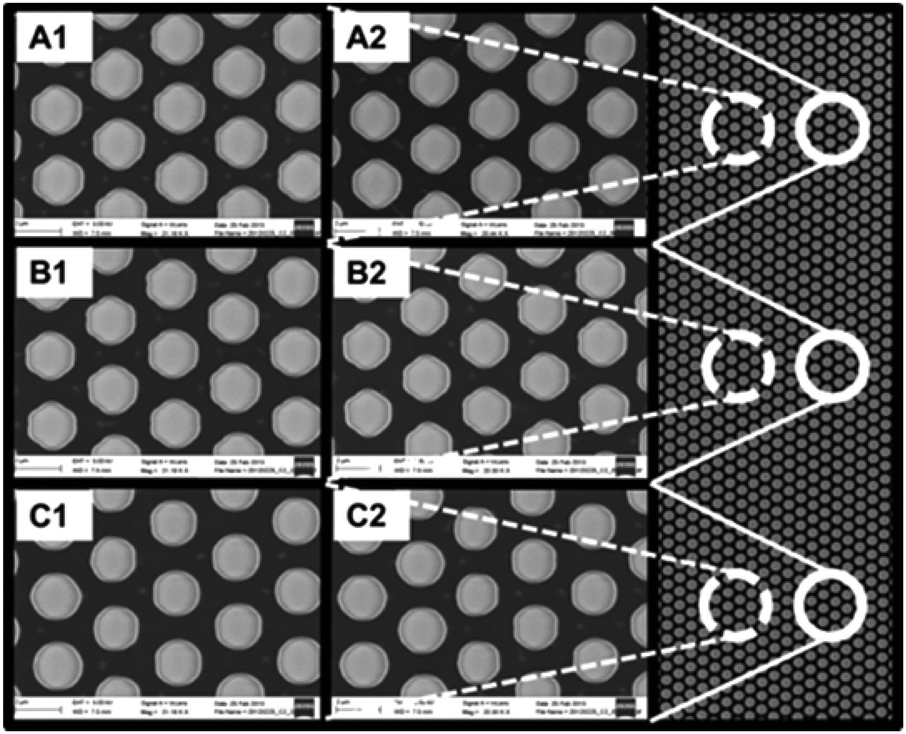
The pursuit of generating ordered mesoporous structures was sparked by the introduction of the MCM-41 material,65 and a variety of mesoporous materials demonstrating 2D symmetry have been reported.53,59,66 MCM-41 and SBA-15 are the most prominent representatives, which both show a hexagonally arranged pattern of parallel channels. Mesoscale pillar arrays can be derived by using these structures as templates.36 An example is shown in Fig. 3. Here, chromium oxide crystalline mesopillars have been synthesised using hexagonally structured SBA-15 silica as the template.67 The diffraction pattern shown as the left inset in Fig. 3A indicates the desired global structure of these mesopillars. However, neither the individual pillars (Fig. 3B), nor their local arrangement (Fig. 3D) reflects the idealized uniformity implied by Fig. 3C. This needs to be checked when evaluating a morphology from the local to the global scale.
 | ||
| Fig. 3 Crystalline chromium oxide-based mesopillar structure obtained by templating synthesis using SBA-15 as a precursor. Panel A shows a single particle and the left inset the diffraction pattern. Panels B and D are transmission electron micrographs showing side and cross-section of the array, respectively. Panel C shows the proposed structure, in which bridges are present to prevent a collapse of the structure. Adapted from Zhu et al.67 with permission from The Royal Society of Chemistry. | ||
The transition from 2D to 3D structured materials increases the number of possible and realized structures on both the macroscale and the mesoscale. As a consequence, also the possible applications become numerous. One special implementation is the use of discrete spherical particles that are arranged in crystalline structures. Their advantage is the unambiguity of the structure, since the packings can be represented with a unit cell. This is also beneficial when comparing computer-generated to real structures. Commonly targeted structures are hexagonal close packing (hcp), body-centered cubic packing (bcc), and face-centered cubic packing (fcc).
Experimental preparation of ordered packings is not always straightforward. While nanocasting and soft templating have been successfully employed for ordered mesostructured materials,36 the methods for generation of crystalline structures on the scale of several hundred nanometers up to micrometers are still in their infancy. A promising approach is colloidal crystallization.68–71 This has been demonstrated, for example, by Wirth and co-workers72 for a particle bed generated in a capillary column, as well as by Newton et al.73 for an electrode material (images with the structure obtained by colloidal crystallization are shown in Fig. 4). It can be recognized that the packing is not exclusively single-crystalline, but consists of domains, where colloidal spheres are arranged in the desired hexagonal pattern, and domains, where a simple-cubic arrangement persists (Fig. 4B). If these problems can be overcome, the well-defined structure of ordered cylinder arrays and sphere packings makes them an ideal reference in evaluating structure–transport relationships with disordered materials, also because microscopic order is generally believed to result in better performance.
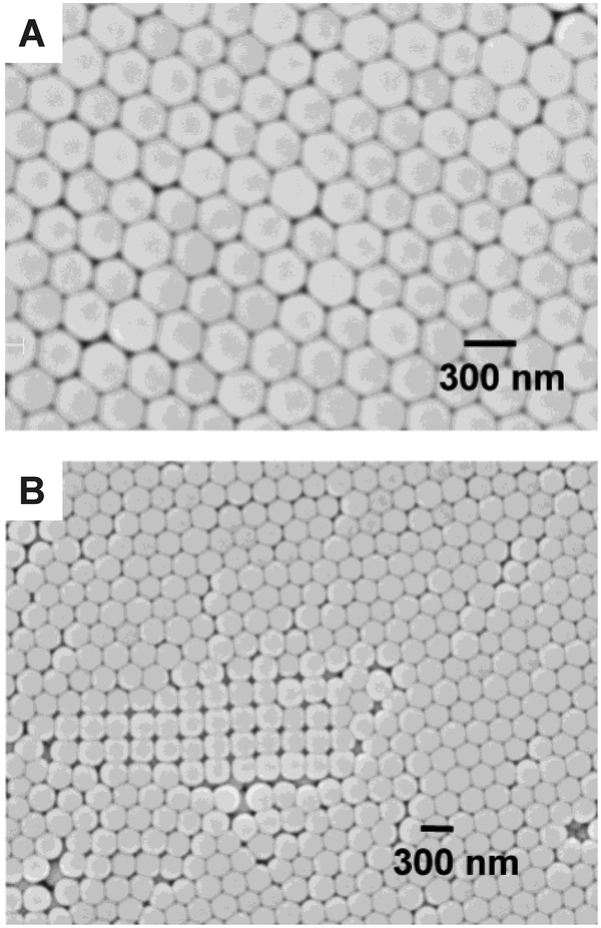 | ||
| Fig. 4 Colloidal crystallized 250 nm-diameter silica spheres. Panel A illustrates the (targeted) hexagonal structure. Panel B reveals structural defects in the sample, e.g. domains where other crystal structures co-exist (in this case, simple cubic). Adapted with permission from Newton et al.73 Copyright 2004 American Chemical Society. | ||
2.2 Random packings
Randomly packed particulate beds are nowadays the dominating “fixed-bed structure” in a wide variety of applications, first and foremost in separation science (especially in high-performance liquid chromatography, HPLC),4,74,75 where packed beds have been intensively applied since their recognition for adsorption chromatography by the Russian–Italian botanist Mikhail Tswett76,77 in the early twentieth century. Since then, the particle technology has substantially improved. Small, micrometer-sized particles (in particular, smaller than ∼3 μm), characterized by narrow particle size distributions, are produced today and packed to yield efficient HPLC columns by companies all over the world.78The thrive for ever better-performing packings, not only for use in separation but also adsorption and reaction, providing small hydrodynamic dispersion and fast mass transfer into and out of the porous particles (expressed in narrow residence time distributions and small band broadening), has created the need for a thorough understanding of the involved transport processes that take place in a packed bed.14 Despite this need and many investigations over the past few decades, a sound description of transport processes (in particular, mass transfer resistances) and their correlation with the packing morphology is still lacking. This can be attributed to a number of obstacles. (i) The experimental generation of packed beds with specific properties, such as the systematic variation of bed porosity and packing microstructure is difficult, since the packing process for frictional and cohesive fine-particles is complex. (ii) Elucidating the structure of real packings is as well difficult; only the improvement of imaging methods over the past few years made physical reconstructions of packings from many applications possible. (iii) Evaluation of transport properties, in particular, hydrodynamic dispersion coupled with adsorption and reaction at the solid–liquid interface of randomly packed beds, is also a challenging problem that usually relies on advanced numerical methods implemented on supercomputing platforms (though facilities that provide the required computational power have become more widely available since a few years).
A comparison of ordered and disordered packings with regard to their microstructures reveals a striking difference. While ordered packings typically can be described using unit cells, disordered packings can only be described using statistical descriptors. If we consider a large number of inert (frictionless and cohesionless) spheres, which are randomly arranged to form a jammed packing, countless possible variations exist. The most important parameter is the bed porosity, which can vary between about 0.36 and 0.46 for monodisperse particles; packings with a higher density can only be realized by the occurrence of crystalline domains or by the use of polydisperse particles.21 Next to porosity (or packing density), the microstructural degree of heterogeneity is an important characteristic of a random sphere packing. These two parameters (packing density and structural heterogeneity) can be considered as spanning a phase diagram of granular matter, into which the possible realisations fall.79 The actual number of packing realisations is a function of the number of degrees of freedom in the system (i.e., of the entropy80), which in turn strongly depends on the porosity of the system.
As a consequence of the phase diagram-like character, it is desirable to systematically generate packings that lie along the boundaries. The use of these packings for a systematic investigation of transport properties should allow us to derive universal limits of their transport properties. With respect to computer-generated packings it means that algorithms have to be employed that allow for the control of microstructural heterogeneity as well as bed porosity. A packing algorithm that meets these criteria is the Jodrey–Tory algorithm81 and its modifications.20–23 An exemplary set of generated 2D packings of inert hard disks with a systematically adjusted degree of microstructural heterogeneity, which allows a better visualization of these effects than 3D packings of spheres, is shown in Fig. 5.
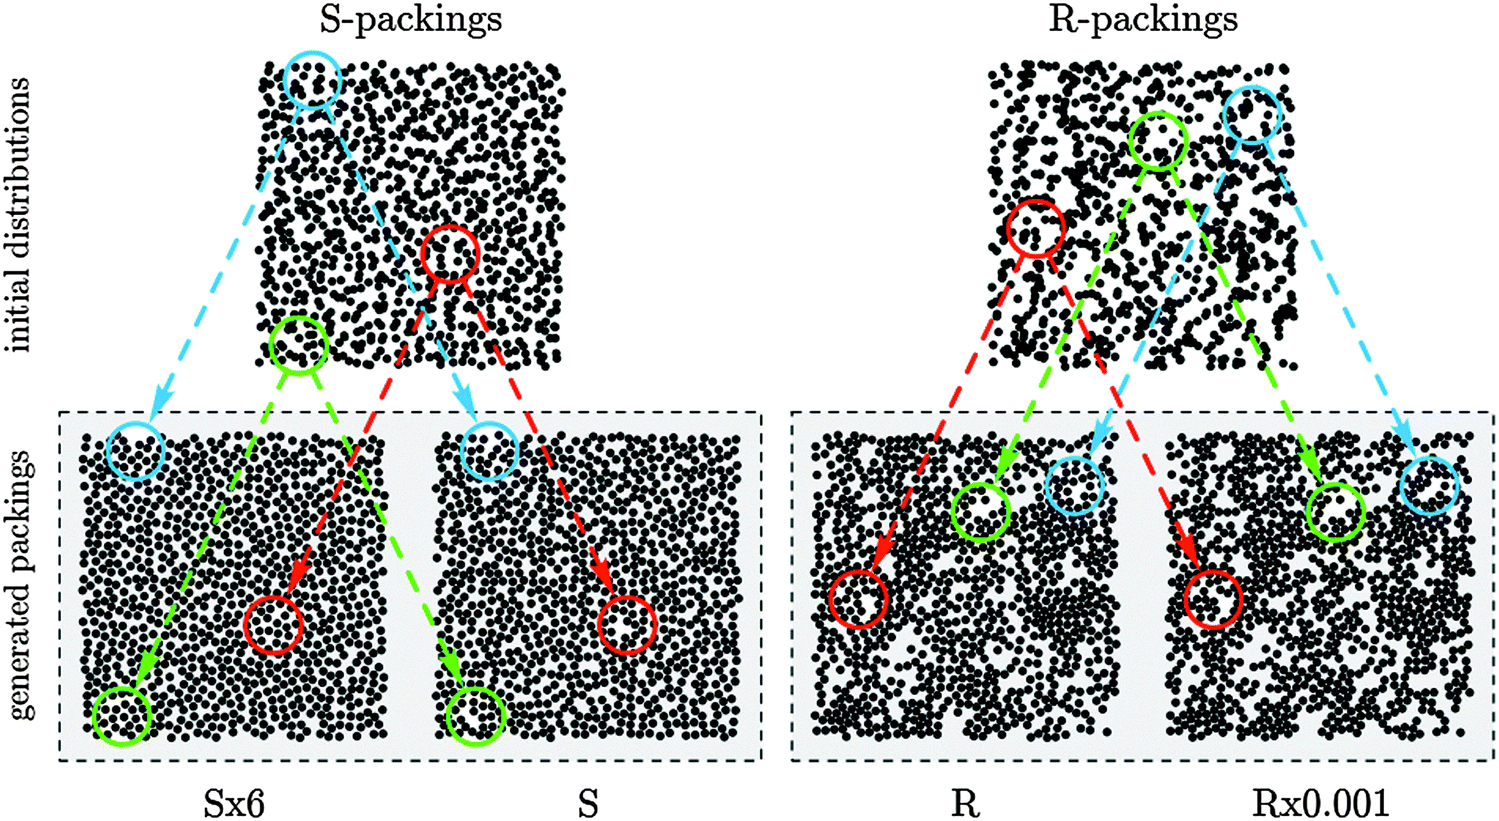 | ||
| Fig. 5 Random packings of monosized hard disks at a bed porosity (interstitial void volume fraction) of ∼0.46 generated using the Jodrey–Tory algorithm. Shown are the initial disk distributions for S- and R-configurations (top) and the final 2D packings (bottom). Circles around selected regions help to compare initial and final distributions. The generated packings reflect their respective packing protocols: (i) S-packings are more homogeneous than R-packings due to the more uniform initial disk distribution; (ii) the initial void space heterogeneity is best balanced in the S × 6 and least balanced in the R × 0.001 packing. Reprinted from Khirevich et al.22 Copyright 2010, with permission from Elsevier. | ||
Briefly, the algorithm works as follows. In the first step, a certain number of spheres are distributed inside a simulation box. This number is determined by the interparticle void volume fraction (or porosity) for which the packing is generated. The initial distribution of spheres has an impact on the homogeneity of the final packing and can be used as one adjustment parameter. In the present case, spheres are either distributed randomly over the entire simulation box (R-packings), or the simulation box is subdivided into a number of identical cells equal to the number of spheres. Then, in each cell a sphere is placed at a random position (S-packings). Packing generation starts from a random distribution of sphere centers, where sphere overlap is typical. Each iteration includes the search for the two sphere centers with minimum pair-wise distance that defines the maximal sphere diameter at which no sphere overlap occurs in the current configuration. This is followed by symmetrical displacement of the two sphere centers up to a new distance. The displacement length used in the second step is scaled by a constant α. Different packing types were generated by varying the initial distribution scheme of the sphere centers and the value of the constant α scaling the displacement length. The scaling constant was set to α = 0.001 (R × 0.001), α = 1 (R and S), or α = 2 (S × 2). With a small displacement length sphere centers remain close to their initial positions during packing generation. It preserves the randomness of the initial distribution. By contrast, larger displacement lengths result in more homogeneous distributions of sphere centers in the final configuration (see Fig. 5 for the case of 2D disk packings, where S × 2 in 3D has been replaced by S × 6 to achieve a stronger effect). By varying the final bed porosity as well as the two parameters influencing the final bed morphology, Khirevich et al.22,23 created a “library of packings” with systematic variation of the degree of microstructural heterogeneity for a range of porosities from ∼0.36 to 0.46.
The Monte Carlo algorithm82 provides a complementary approach to the Jodrey–Tory algorithm for generating dense, random sphere packings. It starts from a uniform distribution of spheres in a dilute cubic array constructed from expanding a simple cubic lattice. In a stepwise process, particles are moved in random directions over a distance randomly drawn from a distribution. Then the coordinate system is compressed by scaling the boundary box with a compression rate Ω. These steps are repeated until the desired bed porosity is reached. By using Ω = 0.95 (fast compression) or Ω = 0.05 (slow compression), two different packing types, Ω × 0.95 and Ω × 0.05, respectively, were generated.23 The values were chosen from the ends of the possible range (0 < Ω ≤ 1) to create a maximum of microstructural variety with these two Monte Carlo-packing types.
The experimental realization of a similar or even matching set representing systematic variations in packing heterogeneity and bed porosity is very difficult. For the generation of a particle-packed column with interparticle macropores, a typically cylindrical column is filled with particles, either in their dry state or suspended as a slurry.4,74 Then, one or more external forces (gravity, hydraulic pressure, vibration, ultrasound, electric field, etc.) are applied to consolidate and densify the bed. Column packings can be realized with particle diameters from several millimeters83 down to the micrometer scale.84 The latter denotes the world of modern HPLC.78 Although decades of research have been devoted to the detailed study of the packing process, it is still barely understood, since neither the individual impact of the many factors that influence this complex procedure, nor their interrelationships are exactly known, among them the physicochemical properties of the adsorbent particles (e.g., particle size distribution, mechanical strength, surface roughness, chemical surface modification), interparticle forces (electrostatic, van der Waals), slurry preparation (slurry liquid and concentration, ionic strength), application of pressure and ultrasound, as well as the coupled stress–strain-flow behavior. As a consequence, over decades it has been repeatedly stated that column packing is considered an art rather than a science. It was only during the last few years that the search for optimal packing conditions started to be based on a more detailed understanding of the process and individual parameters.85–92 Recent studies, for example, have addressed the effects of particle properties such as the width of the particle size distribution24,93,94 and surface roughness,95–98 van der Waals and electrostatic forces,91,99–102 as well as the impact of the slurry concentration,103 column diameter,84,88,104 and confining conduit geometry.105–107
Despite these difficulties and challenges, the chromatographic column format is an ideal system for establishing structure–transport relationships experimentally, and HPLC itself is among the most useful tools for the determination of the transport and dispersion characteristics of matter under flow conditions. The technique is matured, commercially available in a variety of different implementations (using gas, liquid, or supercritical fluid as the mobile phase, with flow rates from nanoliters to several hundred milliliters per minute, and pressures up to 1200 bar), automated, and widely available in research laboratories.
However, the lack of a priori knowledge about the outcome of a packing process impels the need for sophisticated structural characterization methods, ideally based on physical reconstruction of a representative part of the packed bed. The method of choice depends on the material (e.g., hard vs. soft matter; particulate vs. monolithic) and involved characteristic length scales.28–34 To give an impression of a reconstructed packing that is used in modern HPLC (here, nano-liquid chromatography), Fig. 6 provides an example of a packed bed-segment reconstructed from a packed capillary.98
 | ||
| Fig. 6 Reconstructed bed of 2.6 μm spherical core–shell particles packed into a 100 μm inner-diameter cylindrical fused-silica capillary. The reconstruction covers a capillary segment of 100 μm (entire capillary diameter) × 58 μm (along the column axis) × 15 μm. The imaging of the packing microstructure is based on confocal laser scanning microscopy, realized by adapting a refractive index matching approach.108 | ||
The generation of mesoporous structures from the arrangement of spherical particles (in contrast to the interparticle macropore space of a packing, where advection-dominated transport prevails in adsorption, separation, and catalysis) follows a fundamentally different route. Often a two-step procedure is employed, with nanosized spheres used as building blocks that undergo controlled agglomeration.109 This is followed by a fusion step, which prevents the break-up of the generated structures. An example of a particle obtained by a spray-drying process of a colloidal solution of silica nanoparticles is seen in Fig. 7.
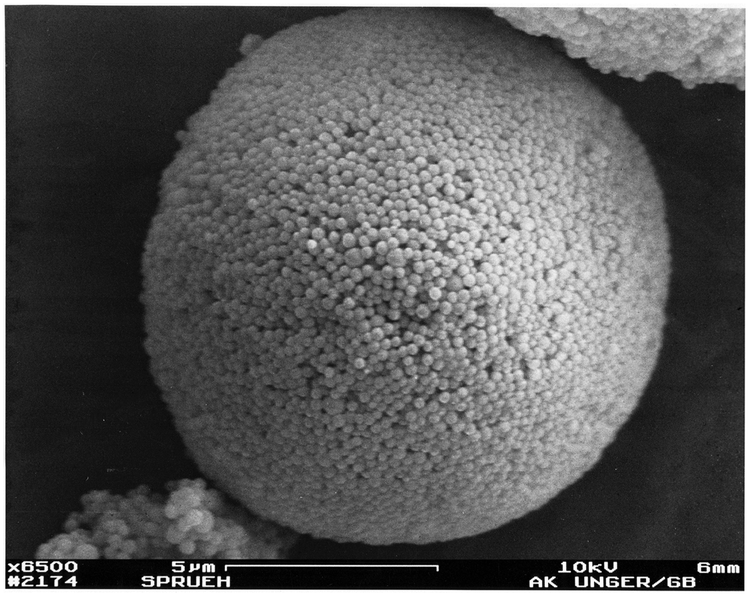 | ||
| Fig. 7 Scanning electron micrograph of a micrometer-sized bead formed from nonporous spherical silica nanoparticles through a spray-drying process. Scale bar, 5 μm. The original particles forming the interstitial mesopore space in the final bead can be clearly identified. | ||
2.3 Monolithic materials
The major drawback, or better, limitation of macroscopic packed beds is the inherent coupling of particle size and interparticle void space dimensions, as well as the limited range of bed porosities that can be obtained for mechanically stable beds. This results in only small domains in which hydrodynamic properties can be manipulated. Alternative structures are therefore needed, which can be designed by an independent variation (and optimization) of the key parameters that affect material performance.One class of materials that, in principle, meets these attractive features are monoliths. In a wider meaning, monoliths are structures with a continuous solid phase (skeleton) that is perforated by a highly interconnected void space (macropores). This wider definition includes monoliths with feature sizes ranging from several millimeters, as encountered in technical catalysis,110 down to nanometers,111 and it also makes no restriction regarding the degree of (dis)order that is actually present in a material. Here we restrict our discussion to disordered monoliths, often described as amorphous, where the individual skeleton branch size falls into the range from several hundred nanometers up to a few micrometers. The 3D morphology of these monoliths (with an example based on confocal laser scanning microscopy112 shown in Fig. 8) is often referred to as sponge-like. Compared to ordered structures or ordered packings, they appear more heterogeneous and show an amorphous structure.
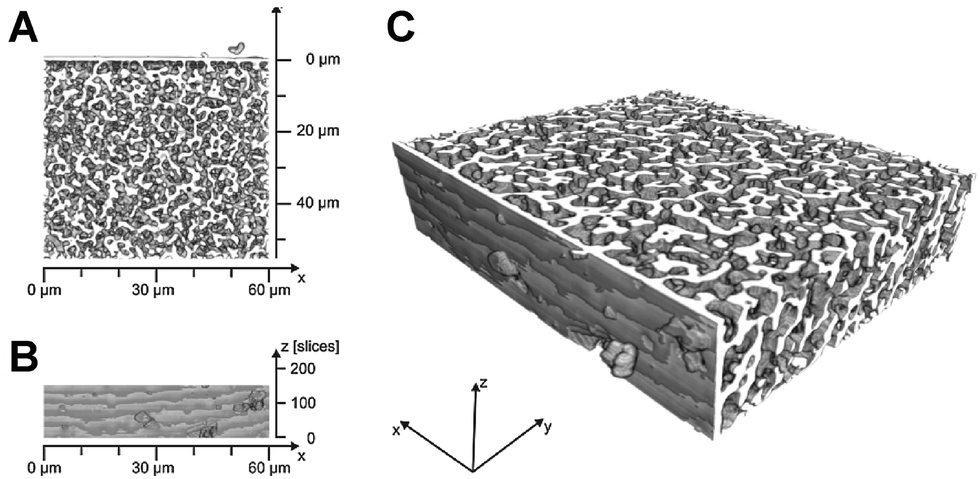 | ||
| Fig. 8 Physical reconstruction of the macropore space morphology of an analytical (4.6 mm-diameter) silica monolith used in HPLC. The mean macropore size based on scanning electron microscopy is 0.81 μm. Panels A and B feature top and side views of the reconstruction, respectively, which represent a physical volume of about 60 μm × 60 μm × 25 μm (panel C). The macroscopic boundary of the silica rod is indicated by the ∼1 μm thick silica layer at the origin of the y-axis. Adapted from Hormann and Tallarek.112 Copyright 2013, with permission from Elsevier. | ||
These monoliths can be prepared from many materials. Silica113–117 or organic polymers118–120 are predominating, since the syntheses are straightforward and reliable and, more importantly, allow wide and independent control of the skeleton and void space morphologies, e.g., the skeleton and void space size and respective homogeneity. As with packed beds, applications typically rely on a large surface area, i.e., the presence of micro- and/or mesopores. For silica monoliths, disordered mesopores are often generated by alkaline hydrothermal treatment.116,121 They can be converted to ordered mesopores by pseudomorphic transformation,9,122 but also direct routes exist.123 The controlled generation of ordered and disordered micro- and mesopores in polymers is also well understood.124–127
Since their morphology can be widely tailored and monoliths created from silica or polymers easily disintegrated (e.g., by basic etching or hydrofluoric dissolution of silica; pyrolysis of polymers), they make ideal templates for the synthesis of monoliths with chemistries that are more suitable for other applications, such as carbon-based128–131 or metal oxide structures.132 The convenient control in combination with the versatility of morphologies that can be realized has stimulated numerous applications, including energy storage and conversion,7,126,129,130,133,134 sensing,129,135 separation,117,119,136,137 and catalysis.57,61,138–140
3. Morphological descriptors for porous materials
3.1 Symmetry and periodicity
Crystalline structures are considered to have the highest achievable degree of order. In classical crystallography, a crystal is considered to be a solid in which the constituents are microscopically arranged to form a regular crystal lattice that can be represented by a single unit cell. A unit cell is characterized by the lengths of its edges, the angles formed between them, and the position of each constituent in the unit cell. Through application of different symmetry operations, a variety of indistinguishable permutations can be created. The totality of symmetry operations which can be applied to a specific unit cell is a distinct characteristic feature. The finite number of possible combinations of symmetry operations yields in total 230 space groups, which are commonly used for the classification of crystalline matter. For visualization of these space groups and symmetry operations, we refer to the Space Group Visualizer by Hitzer et al.141Ideally, a macroscopic crystal is formed by the repetition of the unit cell infinitely in each spatial dimension. The resulting single crystal is then isotropic and shows order on all length scales from short-range to long-range to the macroscale. Deviations from this ideal description are frequently observed. Often, they originate in crystallographic defects, ranging from point defects (vacancies, interstitial defects, substitutions, Frenkel defects, etc.) over line defects to planar defects. Planar defects have a severe impact on morphology, since they are manifested mesoscopically and macroscopically as grain boundaries. It gives rise to polycrystallinity, where a solid is composed of crystalline domains that are patterned irregularly (but often correlated142). Another deviation from crystallinity is the absence of isotropy. Limiting symmetry to only two dimensions can be realized on all length scales. 2D hexagonal patterns, e.g., have been obtained on a molecular level by self-assembling monolayers;143,144 on the mesoscale, this has been demonstrated in the famous MCM-41,65 while on the macroscale, glass drawing methods have been shown to yield hexagonally arranged channels.9 Still another deviation from the unit cell-based isotropic periodicity has been discovered in the 1980s with quasicrystalline structures. In these solids a structure is realized, which is highly ordered and symmetrical but (despite showing periodicity) cannot be reduced to a unit cell. The Penrose tiling is the most famous example. Its fascinating structure is not only observed in crystals, but has also been produced by lithography on the mesoscale145 and can even be found in everyday life, where it has made its way into art and architecture.
To summarize, symmetry is a property found only in highly ordered structures, and the ability to completely characterize a structure with symmetry operations or other distinct generation rules makes these structures unambiguous.
3.2 Spatial tessellations
When porous structures are built from discrete particles, commonly the case for packed spheres, tessellation methods can be applied to characterize microstructural heterogeneity. Tesselation schemes use specific rules that allow for an unambiguous partitioning of a given area or volume into a gap-free, non-overlapping pattern of geometrical figures. The two most frequently used and thus most important tessellations are Delaunay triangulation and Voronoi tessellation.146 Both aim at subdividing a given space into areas (2D) or volumes (3D), which can be interpreted as void space shared by a set of particles (Delaunay tessellation), or as void space associated with a single particle (Voronoi tessellation). The generation of these tessellation schemes in 2D is illustrated in Fig. 9. | ||
| Fig. 9 Generation of Delaunay tessellation (A) and Voronoi tessellation (B) for 2D disks of the same size. Reprinted from Khirevich et al.23 Copyright 2011, with permission from Elsevier. | ||
To generate Delaunay triangulation for the 2D case, in a first step the discrete objects are reduced to their centers. Afterwards, a mesh of triangles is generated so that each center becomes a vertex of the resulting mesh and there exists no particle center that lies inside any of the circumcircles of the triangles. The concept can be extended to the 3D case by generating a mesh of tetrahedrons, as shown in Fig. 10. The circumspheres of the tetrahedrons have to satisfy the same condition as above. In this triangulation, the void volume enclosed by a tetrahedron can be considered as a pore. This approach provides a variety of features that can be used for quantitative analysis of morphology, including Delaunay cell volumes, edge lengths, and areas which create the boundary to the neighbouring pores, as well as the distributions of these measures.147 Delaunay tessellation is further important in computational physics, because finite-element and finite-volume methods are based on a mesh generated by triangulation. Due to this relevance, a large number of efficient algorithms for the generation of these meshes exist.
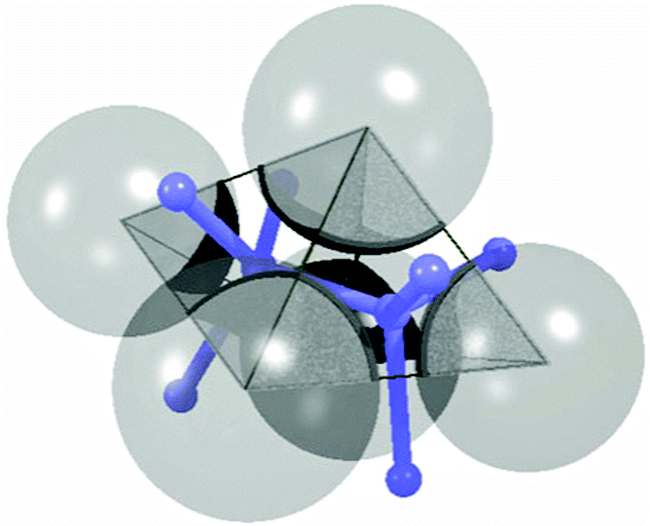 | ||
| Fig. 10 Delaunay tessellation for a set of spheres. The tetrahedron represents the pore that is enclosed by the four shown spheres. Blue bars indicate the edges of the Voronoi cell for the same set. Reprinted from Chareyre et al.148 Copyright 2012, with permission from Springer. | ||
Voronoi tessellation, as shown in Fig. 9B, is related to Delaunay triangulation by duality. The center of each circumcircle of every triangle of the Delaunay mesh is a vertex of the Voronoi mesh. Therefore, these two meshes can be converted efficiently. For the 2D case of monosized disks, the geometric construction of the corresponding Voronoi cell is simple. In the first step, neighboured particle centres are connected by straight lines. In a second step, orthogonal lines are taken that divide the connecting lines in the middle. The intersections of these orthogonals yield the vertices of the Voronoi cell, the lines between them provide the edges. The extension to three dimensions is realized using the orthogonal planes. Intersections of two planes yield the edges, and intersections of three planes the vertices of the 3D Voronoi cell. An example for Voronoi tessellation of a set of randomly jammed spheres is shown in Fig. 11. While this simple procedure is only valid for monosized disks and spheres, it has been extended to also be applicable to polydisperse disks and spheres as well as to irregularly shaped objects.150–153 Voronoi cells can be evaluated with respect to the number of vertices, their edge length distributions, edge and face number distributions, area (2D) and volume (3D) distributions, coordination number, etc., and the properties thereof have been intensively studied.101,154–163
 | ||
| Fig. 11 Voronoi tessellation for a set of randomly arranged, identical spheres. Reprinted with permission from Schröder-Turk et al.149 Copyright 2013, American Institute of Physics. | ||
For crystalline structures the Wigner–Seitz cells are special cases of the Voronoi cells,146 which consist of regular polyhedra. For 2D disks, the densest possible configuration, i.e., the hexagonal closest packing, gives a honeycomb structure in the Voronoi cell representation, where each cell has six equally long edges. By introducing distortions (necessarily accompanied by an increase in porosity), that is, by increasing the disorder of the system, several phenomena occur. Firstly, the individual Voronoi cells become distorted; their edge lengths and cell areas are no longer equal. Secondly, Voronoi cells emerge that are formed by more (or less) than six vertices. This broadens the distribution of the number of vertices per Voronoi cell. In that way, by steadily increasing the number of distortions, a transition from the perfectly ordered state to random arrangements can be achieved. Yazdchi and Luding164 monitored this transition with the evolution of the probability density distribution for the vertex number.
As shown in Fig. 12A, the observed curve for the second statistical moment of that distribution meets the expectations. The decrease in the frequency of the six-sided Voronoi cells results in an increase in the variance of the distribution. Interestingly, the skewness of the distribution (Fig. 12B) dramatically increases at a probability of p(6) ≈ 0.6, indicating a possible threshold between order and disorder. The authors also introduced a shape parameter Φ (based on the moments of area I1 and I2 along the two principal axes of the polygons) defined by Φ = |(I1 − I2)/(I1 + I2)|. It is a measure of the deformation of individual Voronoi cells. The dependence of this shape factor on porosity is shown in Fig. 13.
 | ||
| Fig. 12 Second (A) and third (B) statistical moment of the vertex number distribution in dependence of the probability to find a Voronoi cell with six vertices, p(6). Adapted from Yazdchi and Luding.164 Copyright 2013, with permission from Elsevier. | ||
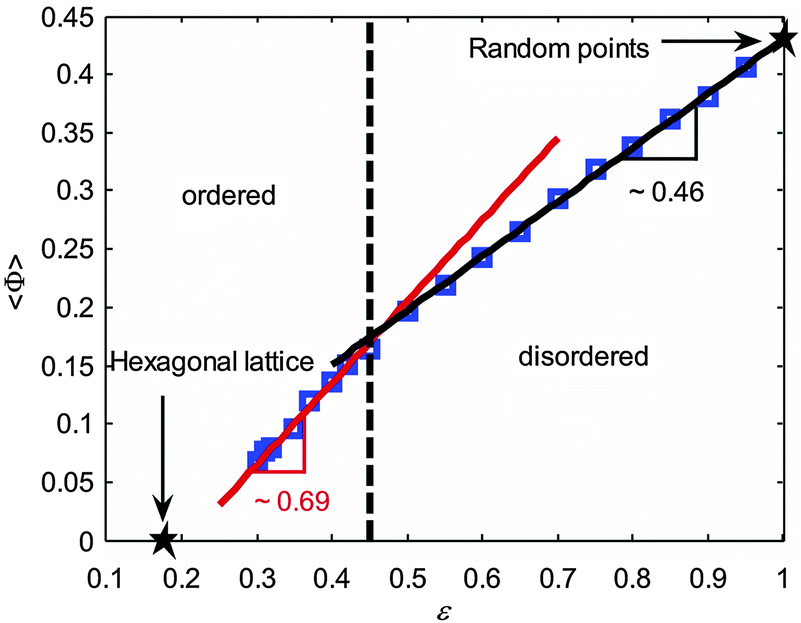 | ||
| Fig. 13 Shape factor Φ in dependence of the void volume fraction for 2D arrays of circular disks. Reprinted from Yazdchi and Luding.164 Copyright 2013, with permission from Elsevier. | ||
The graph can be divided into two sections, and in each, the curve can be approximated by a linear expression. The intersection of the two fitting functions occurs at a porosity of ε ≈ 0.45, effectively dividing the structures into a set of ordered and a set of disordered ones. The threshold porosity coincides with the value identified for the dependence of the second and third moment of the vertex number distribution on p(6) (Fig. 12). This point is thus indicated by three different properties that can be derived from Voronoi tessellation. It implies a good threshold value for the transition between ordered and disordered microstructures. This evaluation has so far been limited to 2D arrays of disks. An extension to 3D sphere packings would be highly appreciated.
The computer-generated “library of packings” described earlier (in the context of Fig. 5), with systematically adjusted degree of microstructural heterogeneity for bed porosities from random-close to random-loose packing, was subsequently characterized by Khirevich et al.22,23 using both Voronoi and Delaunay tessellation. Voronoi volume distributions for the different packing types are shown in Fig. 14 at the lowest and highest porosity; standard deviation and skewness for all distributions (ε = 0.366–0.46) are summarized in Fig. 15.
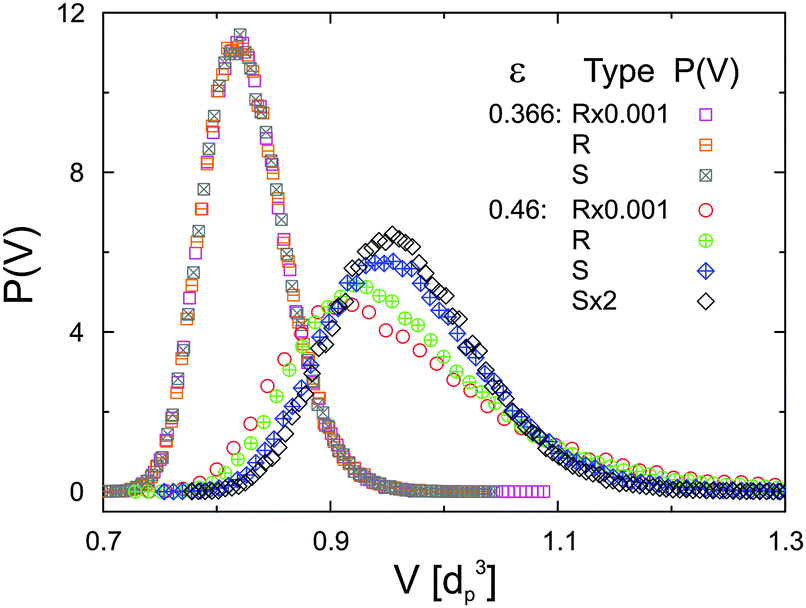 | ||
| Fig. 14 Distribution P(V) of normalized Voronoi cell volumes V for computer-generated random packings of monosized spheres at bed porosities of ε = 0.366 and 0.46 as a function of packing type. Reproduced from Khirevich et al.23 Copyright 2011, with permission from Elsevier. | ||
 | ||
| Fig. 15 Standard deviation (A) and skewness (B) of Voronoi volume distributions for the different packing types as a function of bed porosity. The corresponding distributions for ε = 0.366 and 0.46 are shown in Fig. 14. Reproduced from Khirevich et al.23 Copyright 2011, with permission from Elsevier. | ||
As expected from the lack of degrees of freedom, the Voronoi volume distributions for all packing types practically coincide at the lowest porosity (ε = 0.366, which lies near the random-close packing limit79). For the loosest employed packings at ε = 0.46 the distributions diverge most, in accordance with the intrinsic features of the respective packing type and underlying (adjusted) packing protocol. When comparing the distributions at the two border porosities (Fig. 14), one immediately notices the shift to higher mean values. This is expected, since the mean volume per particle is proportional to the number density of particles, i.e., to the targeted bed porosity. With increasing porosity the distributions become broader and more skewed for R-type packings than for S-type packings (Fig. 15). Within each packing type the statistical dispersion and skewness both decrease with higher values of α. This behaviour is in full agreement with details followed by the algorithm, i.e., a larger displacement length (α-value) during packing generation yields a more homogeneous sphere distribution in the final packing.22,23
The differences observed in the microstructural heterogeneity especially at higher bed porosities underline the need for an adequate description of the bed structure, if correlations with the mass transport properties of a material are established. The two parameters in Fig. 15 (the standard deviation and skewness of the Voronoi volume distributions) are a quantitative measure of the microstructural degree of heterogeneity of a packing. Each of the packing types demonstrates a unique porosity-scaling, which reflects its relative packing-scale disorder: R × 0.001 > R > S > S × 2, i.e., the higher the packing-scale disorder, the higher the value of σ(P(V)) and γ(P(V)) at a given porosity and the steeper the rise of these two parameters at increasing porosity.
3.3 Chord length distributions
Although the tessellation schemes provide sensitive morphological descriptors, they can only be applied if a structure consists of discrete particles. While the tessellations can be considered as a powerful and convenient tool to compare the morphologies of such structures, the comparison of structural properties between fundamentally different morphologies is not possible. A simple and widely applicable approach to characterize the shape and size of arbitrary geometrical structures is the use of chord length distributions (CLDs), also known as mean path length distributions. This method has been applied for microstructural description of multiphase media165 and theoretically investigated for a variety of fundamental geometric figures.166–168 Application of the CLD method to materials from different scientific and technological fields reveals the unique advantage of this approach: since it does not require assumptions about the size and shape of a solid, liquid, or void phase, it is virtually applicable to all multiphase media and has been used to describe packed beds of micrometer-sized particles,98,108 the macropore space, skeleton and mesopore space of silica monoliths,112,121,169,170 porous glasses,171 to study crystallisation,172etc.In general, chords are used to fingerprint scan a geometry by measuring the distances between two interfaces, which are set apart by a homogenous phase. This is illustrated in Fig. 16 for a hypercrosslinked poly(styrene–divinylbenzene) monolith reconstructed using serial block-face scanning electron microscopy.173 CLD analysis proceeds along the following steps: (i) seed points are randomly placed within each phase, here interstitial macropore space (black) and polymer backbone (white); (ii) from each point vectors are projected in angularly equispaced directions until they hit the interface; (iii) chord lengths are then extracted as the sum of the absolute lengths of a pair of opposed vectors (spanning, in general, the distance between two interfaces while traversing the medium) and stored.
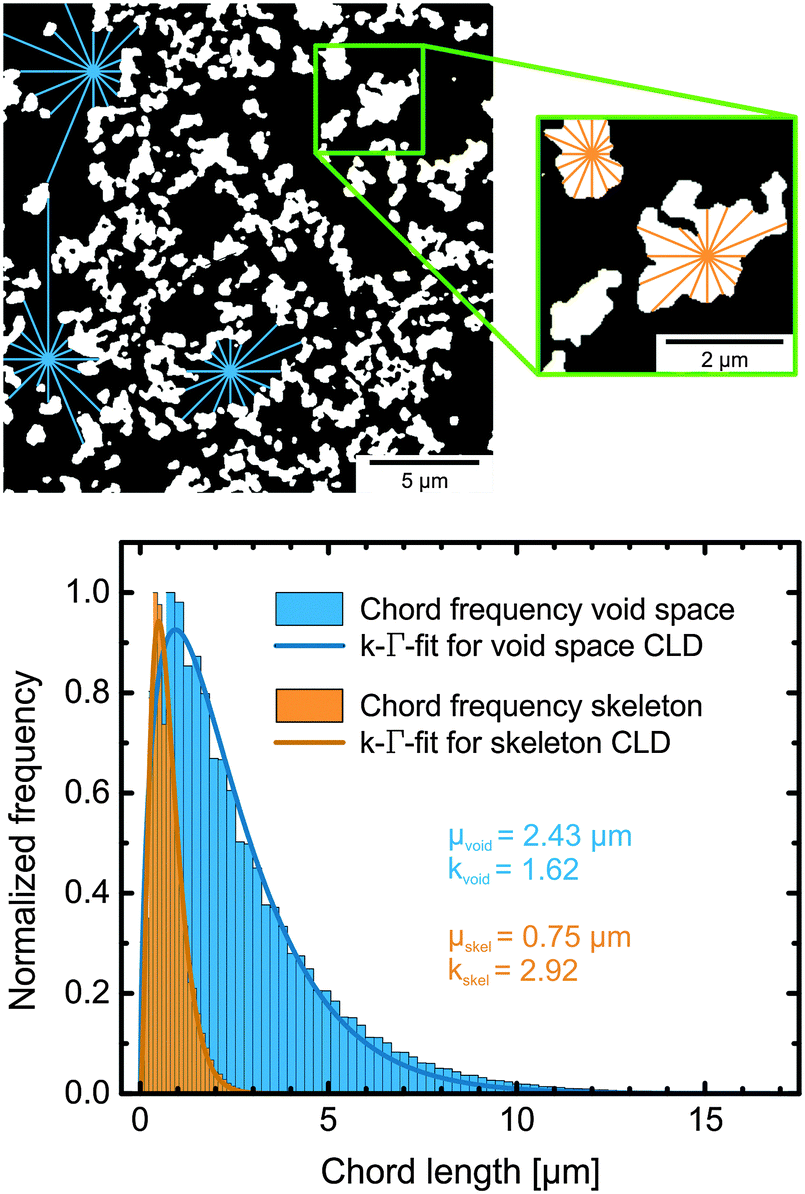 | ||
| Fig. 16 Generation of CLDs in the interstitial void space (black) and in the polymeric skeleton (white) of a physically reconstructed poly(styrene–divinylbenzene) monolith. The top panel illustrates how chords are generated. Chords are then assembled in a histogram, as shown in the bottom panel. Using an appropriate fitting function, values for mean size (μ) and statistical dispersion (k, which is a measure for microstructural heterogeneity) of a CLD can be derived. Adapted from Müllner et al.174 Copyright 2015 John Wiley & Sons Limited. Reproduced with permission. | ||
As Fig. 16 shows, the chord lengths analyse morphology on a local scale, i.e., the majority of the chords probe a single pore, with some chords also probing adjacent pores. The CLDs therefore reveal information about the local (pore level) and short-range (a few pores) heterogeneity. Once a statistically significant number of chords have been collected, they are evaluated and assembled to form a histogram, as shown in the bottom of Fig. 16 and in Fig. 17.
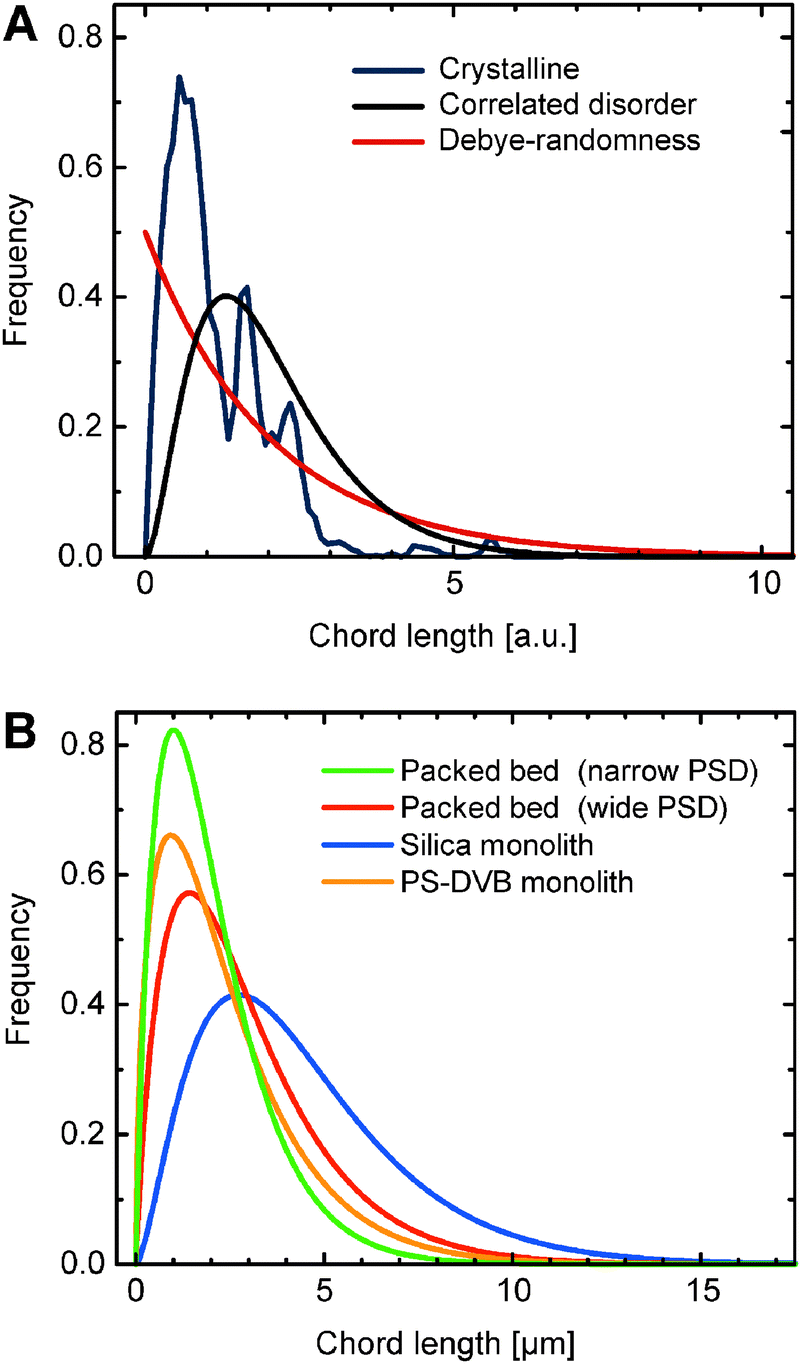 | ||
| Fig. 17 (A) Characteristic CLDs for materials with different types of (dis)order. (B) Comparison between structurally differing materials exhibiting correlated disorder: sphere packings obtained using a narrow or wide particle size distribution (PSD), i.e., with ∼3% or ∼18% relative standard deviation of the PSD, a silica monolith, and a poly(styrene–divinylbenzene) (PS–DVB) monolith. | ||
A first conclusion that can be derived from the shape of a CLD is about the fundamental nature of the structural disorder in the investigated material. Usually three different fundamental shapes can be distinguished, as depicted in Fig. 17A. For highly ordered, crystalline structures the CLD exhibits a multi-modal pattern, whereas media with Debye randomness show a CLD that follows an exponential decay function. The latter has for example been found for Vycor glass, cement, and sand.175,176 The most interesting case however is the occurrence of correlated disorder, as found in randomly packed particulate beds (Fig. 6) as well as hard and soft matter-type monolithic materials (Fig. 8 and 16, respectively).
For materials characterized by correlated disorder, it has been demonstrated that the CLD can be well described with the k–Γ-function.98,108,169,170 It can also be supported with arguments based on a statistical mechanics approach.177 This function returns two descriptive parameters: μ as the first statistical moment, equivalent to the mean chord length of the investigated phase; and k as a second-moment parameter related to the dispersion, defined by μ and the standard deviation σ as k = μ2/σ2. The higher the k-value, the more homogeneous is the respective phase, i.e., the more homogenous is the morphology over a length scale of a few pores. The strength of the CLD method stems from the fact that now fundamentally different morphologies can be compared, as shown in Fig. 17 for the pore spaces of some exemplary structures generated by completely different processes: a poly(styrene–divinylbenzene) monolith based on radical polymerization,173 a silica monolith based on spinodal decomposition,169 and particulate beds prepared by the slurry packing and consolidation protocol.98
In addition, the CLD approach is useful for the investigation of systematic variations in one type of material. For example, the results of the CLD analysis applied to the same computer-generated packings that were subject to the Voronoi volume distribution analysis (cf.Fig. 15) are shown in Fig. 18. Unsurprisingly, similar to the Voronoi tessellation approach, the mean void size and void space homogeneity coincide for the densest packings and are most spread-out at the highest investigated porosity. As expected, the mean chord length for the interparticle void space, i.e., the mean channel size, increases linearly with the void space volume. Though the differences are not very pronounced, for a given packing density the mean chord length decreases with increasing packing homogeneity (from R × 0.001 to S × 2 packing type). The actual heterogeneity determines the fraction of chords that probe a distance spanning two or more pores. The more heterogeneous a packing is, the more chords traverse two or more pores; the more homogeneous a packing, the more chords are generated that only probe a single pore. Consequently, the resulting mean chord length increases for more heterogeneous packings, which is best seen in Fig. 18A at the highest bed porosity of ε = 0.46.
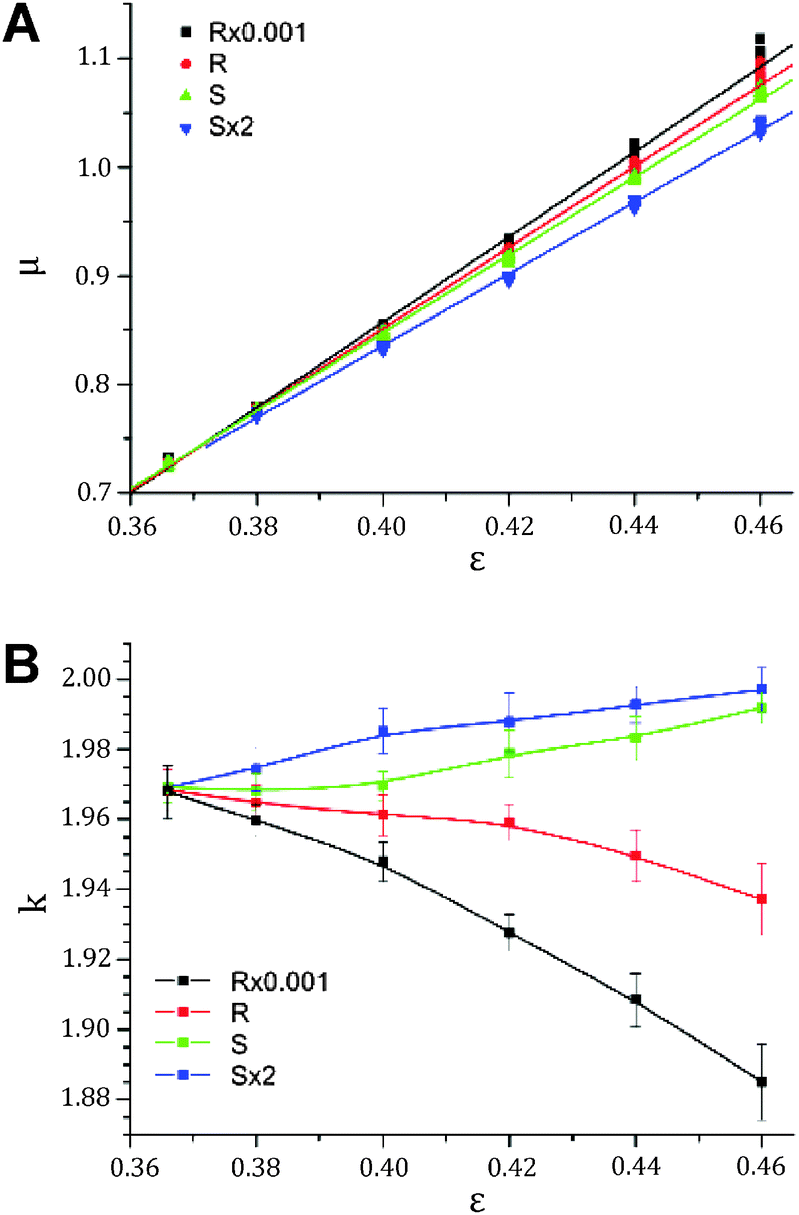 | ||
| Fig. 18 (A) Mean interparticle channel size and (B) microstructural homogeneity based on CLD analysis of the void space in different sphere packing types as a function of bed porosity. | ||
The short-range interchannel homogeneity of the sphere packings (over 1–2 particle diameters) is captured by the CLDs' dispersion parameter k, as summarized in Fig. 18B. When compared to the standard deviation and skewness of the Voronoi volume distributions presented in Fig. 15, the similarity is evident. In agreement with expectations, the homogeneity factors coincide at the lowest investigated porosity (near the random-close packing limit of ∼36% interparticle void volume fraction79) and then fan out for the different packing types with increasing porosity. The sensitivity of the CLD analysis for the carefully adjusted microstructural degree of heterogeneity in these packings proves this method to be an alternative approach for the analysis of physically reconstructed beds of fine particles. Tessellation schemes may be more difficult to implement due to nonidealities in real packings (like fragments and irregularly shaped oligomers of particles),98 which also adversely affect the flow uniformity and transport properties and thus have to be included in the morphological analysis.
A good example of how the combination of a systematic variation of preparation conditions, 3D physical reconstruction, and morphological characterization by CLD analysis leads to insights into fundamental material design and optimization was given by Stoeckel et al.121 The authors used a series of silica-based monoliths prepared by a well-established standard protocol. It was tailored to yield a set of structures with a systematically varied macropore size, reaching into the sub-micrometer regime. The structures of these monoliths were reconstructed using focused ion beam scanning electron microscopy and analysed using the CLD approach. Fig. 19 summarizes the results of this analysis with a plot of the dimensionless “structural homogeneity parameter” k against the mean chord length for the investigated silica monoliths.
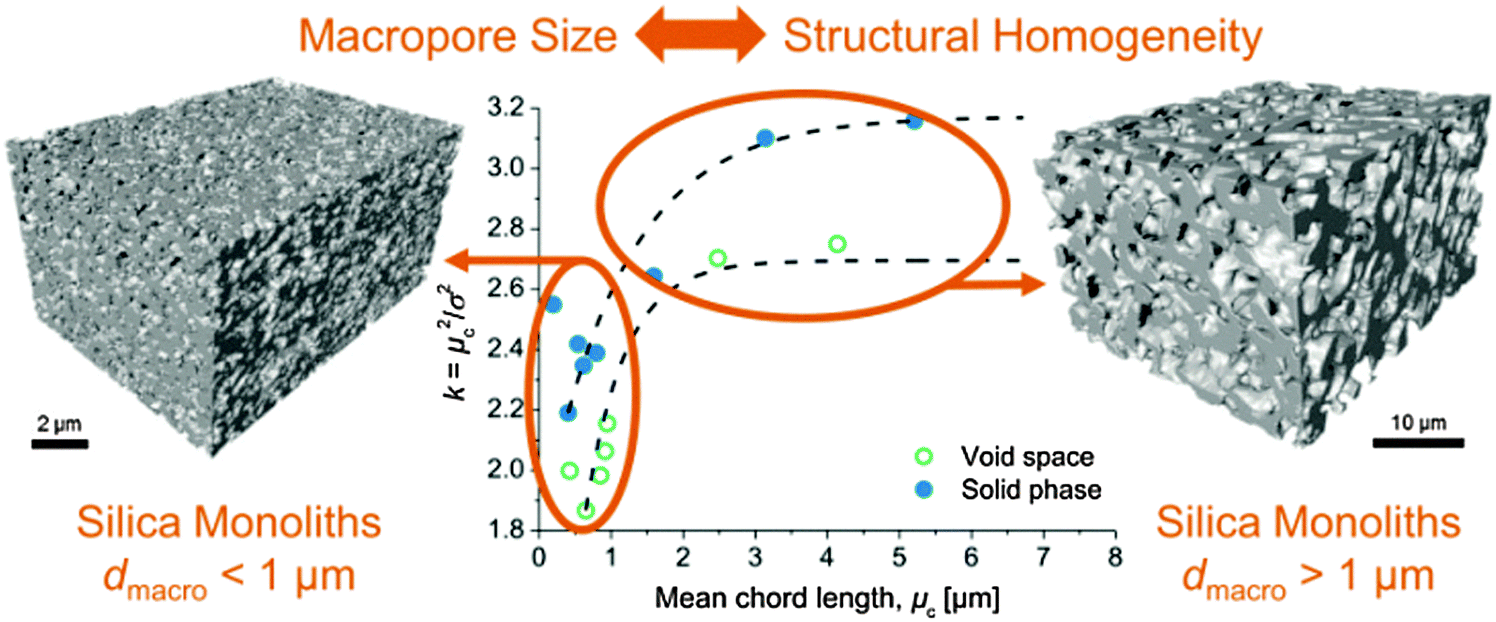 | ||
| Fig. 19 Macropore space morphology of silica monoliths with average macropore size ranging from a few micrometers into the sub-micrometer regime. Physical reconstructions were analysed using CLDs and their description by a k–Γ-function. The extracted microstructural homogeneity parameter k is then displayed as a function of mean chord length (channel size). Reprinted with permission from Stoeckel et al.121 Copyright 2015 American Chemical Society. | ||
The quantitative data in Fig. 19 demonstrate that the homogeneity of the monoliths suffers (as reflected by the decreasing k-values) when the average macropore size decreases below ∼1 μm. The salient reasons behind several experimental observations that reduction of the monolith domain size towards sub-micrometer dimensions failed to improve their separation efficiency in HPLC practice have until now mostly been speculated.117 Whether this is a fundamental property of these monoliths or a problem that could be solved by carefully adjusted preparation conditions or even alternative routes still needs to be answered. The analytical approach illustrated in Fig. 19, however, can be of great help in that discovery: through fine changes of synthesis parameters and a comparison of the resulting morphologies it will enable material scientists to systematically tailor monoliths and to identify the morphological features causing mass-transfer limitations in targeted applications.112,121,174
The versatility of the CLD analysis is its main advantage over other methods. Since CLD generation neither requires nor assumes any underlying morphology, it then becomes possible to compare the microstructural heterogeneity for fundamentally different functional materials. Especially the comparison of particulate packings and monoliths is interesting in this regard, since they must be considered as paradigm for fixed-bed adsorbers, separators, and reactors, in general. Due to the steadily growing pool of functional porous materials that are subject to physical reconstruction and morphological characterization by CLD analysis, it is possible as well as helpful to construct a “magna charta” of morphologies. It maps current results and allows for a quick classification of new structures. Such a map, which plots the k–μ pairs from CLD analysis for a variety of materials, is presented in Fig. 20.
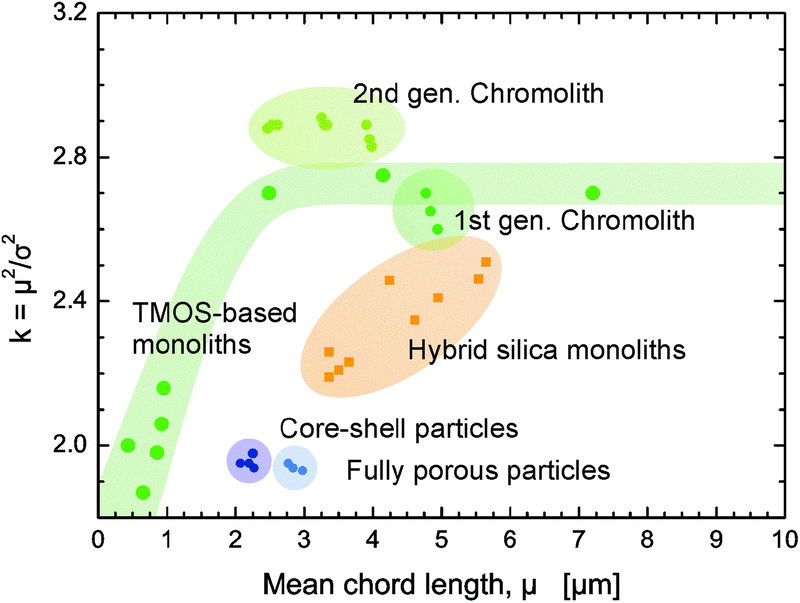 | ||
| Fig. 20 Morphological comparison of physically reconstructed structures based on CLD analysis; the summary of the derived k–μ data in the form of a “magna charta”. Contributing structures consist of commercial silica monoliths (1st and 2nd generation Chromolith; analytical columns with 4.6 mm diameter),112,169 laboratory samples of pure silica rods (based on tetramethoxysilane, TMOS),121 laboratory samples of hybrid organic–silica monoliths (capillary columns, 100 μm diameter),178,179 and packed beds of core–shell and fully porous particles (capillary columns, 100 μm diameter).98,108 | ||
Such a “mapping of morphologies” allows the quick evaluation of new materials and a comparison to existing ones. This is especially useful for the assessment of the capabilities and limitations of a preparation route, as explained in the context of Fig. 19, and the comparison of new synthetic approaches to existing ones. By taking into account additional information like hydraulic flow and permeability data, mass transport properties, the accessible surface area, etc., this mapping also allows for the rational selection of materials in more specific applications.
3.4 Topological analysis
The measures presented so far deal with geometrical properties of porous media. Often, one also needs to take into account the topology of a pore domain, i.e., how the pores are coordinated and connected, as well as how tortuous (sinuous) the pathways through the pore space are. In order to evaluate topology, it is necessary to apply suitable methods for determining parameters like pore connectivity, pore coordination, and geometric tortuosity. Fig. 21 summarizes the results of a paper that is part of this Special Issue.180 The usefulness of a combination of different topological analyses is shown for the macropore space of silica-based monoliths, but the methods described in that work are universally applicable to porous media, irrespective of their structure, synthetic route, and the imaging method used for their reconstruction, provided that the structural features are adequately resolved. Pore connectivity can be traced by medial axis analysis,181,182 whereas pore coordination is evaluated after compartmentalization of the open macropore space into individual pores and pore throats by a maximum inscribed spheres approach.183–185 Furthermore, geometric tortuosity is derived from medial axis analysis as well as by a propagation method that maps the geodesic distance from the center point of a reconstruction to every other point in the pore space.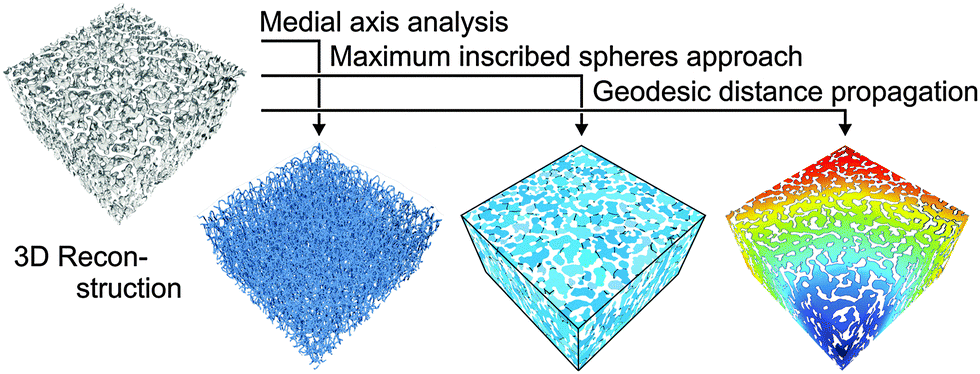 | ||
| Fig. 21 Summary of different approaches to extract topological measures from physical reconstructions. Reproduced from Hormann et al.180 with permission from the Centre National de la Recherche Scientifique (CNRS) and The Royal Society of Chemistry. | ||
Medial axis analysis yields a branch-node network, which returns the distribution of connectivity of branches per node, the distribution of geometric branch tortuosity, as well as averaged values. The maximum inscribed spheres approach provides a compartmentalized representation of the macropore space, where individual pores are delimited by pore throats, from which the number of coordinating pores of a single pore as well as the distribution thereof for the whole pore space can be derived. Pore coordination data show each pore as the possible starting point from which most of the surrounding pores are accessible by diffusion and flow. Typically, the pores are connected via throats of much lower coordination. Therefore, the average pore throat coordination number in the compartmentalized representation of the pore space as well as the average pore (branch) connectivity determined by medial axis analysis are important parameters for mass transport in porous media.186–188 Calculating the geodesic distance between the center point and every void voxel in a reconstructed volume via a propagation algorithm yields a global geometric tortuosity value that reflects obstruction to percolation or diffusion.
4. Correlation of morphological and mass transport properties
Effective diffusion and hydrodynamic dispersion belong to the most important mass transport properties of functional porous materials, which govern the width of residence time distributions in separation and catalysis, in general. This width – a function of the mobile phase (liquid or gas) velocity – may, in turn, be found to limit the performance of a particular process or operation. It addresses efficiency in HPLC separations of complex mixtures and the separation of structurally similar educt/product combinations in chemical reactors, or sample and material throughput in screening projects representing our omics era, heterogeneous catalysis, and catalyst (material) testing. Efficiency – as expressed by the width of the residence time distribution – and therefore resolution critically depends on the mobile phase velocity, since the 3D flow velocity field in a porous material is a sensitive indicator of its morphology. It indeed behaves as an “amplifier” of the intrinsic structural heterogeneity through the resulting velocity heterogeneity and associated hydrodynamic dispersion. Thus, the width of a residence time distribution reflects the structural heterogeneity of the material in separation and catalysis under advection-dominated conditions. The morphological analysis of the flow-through macropore domain of a material, as illustrated by Voronoi tessellation for packed beds in Fig. 15 and by CLDs for both packings and monoliths in Fig. 20, in close relationship with the hydraulic permeability and hydrodynamic dispersion, is therefore the key to tailoring throughput (permeability) and/or efficiency (dispersion) aspects in the design of a material for a particular application.4.1 Hydrodynamic dispersion
Theoretical and experimental investigations of dispersion in flow through porous media have been performed for decades due to its relevance to engineering, geology, chemistry, and physics. However, the complexity of solutions to the fundamental transport equations has restricted investigations to simple or simplified structures regarding theoretical approaches,189–193 or to the description of experimental data by appropriate fitting functions.194–197 Only during recent years have powerful numerical methods been developed significantly and efficiently implemented on (increasingly available) high-performance computing platforms to enable detailed simulations of flow and dispersion in porous media with arbitrary geometry, in general, and conventional fixed particulate or monolithic beds, in particular. Besides reproducing experimental column behavior, recent transport simulations in sphere packings have addressed the velocity-dependence of longitudinal and transverse dispersion coefficients198–203 and have been instrumental in resolving the effect of the particle size distribution,24 intraparticle porosity (nonporous vs. core–shell vs. fully porous particles) and associated diffusion-limited transport,27 particle shape,204 bed density,24,25 packing disorder and defects,205,206 or column dimensions207 and cross-sectional geometry105,106,206 on longitudinal dispersion.An important aspect that is usually neglected, however, is the impact of structural heterogeneity on dispersion, particularly at a given porosity. Returning to the library of random sphere packings analysed earlier (in the context of Fig. 5, 14, and 15), Khirevich et al.20,22 performed pore-scale simulations of flow and dispersion and were able to derive asymptotic dispersion coefficients for these packings with systematically varied bed porosity and microstructural heterogeneity. The longitudinal dispersion coefficients (i.e., parallel to the macroscopic flow direction), observed in the long-time limit as asymptotic values, are provided in Fig. 22 for a particle Péclet number (a dimensionless velocity) of Pe = uavdp/Dm = 50, where uav denotes the average velocity through a sphere packing and dp is the sphere diameter. For Pe > 10, advection dominates transport in a packing (as in Fig. 22); for Pe < 1, transport becomes diffusion-limited. As the figure shows, the impact of packing microstructure on dispersion is tremendous – already for this relatively simple set of packings with frictionless and cohesionless, monodisperse particles. While the homogenous S-type packings demonstrate just a minor increase in dispersion with increasing porosity, the heterogeneous R-type packings show a distinct dependence. At the highest porosity, the dispersion coefficient for the most heterogeneous packing is almost twice as high as for the most homogenous packing. This difference is expected to increase even further as more extreme packing generation protocols and polydisperse particles are employed (and higher porosities with frictional, cohesive particles realized). It underlines the importance of taking properly into account the actual microstructure of packed beds in judging their transport properties. Further insight can be gained by a comparison of the obtained dispersion coefficients with the standard deviation and skewness of the Voronoi cell volume distributions from Fig. 15 as well as with the results of the CLD analysis in Fig. 18. All three presented measures show a similar behavior with respect to dispersion in the different packing types. Although a quantitative theoretical link is still missing (which poses a great challenge), the approach shows the potential of using simple scalar measures for microstructural disorder and heterogeneity and correlates them with relevant hydrodynamic properties. In this respect, the convenient use of simple morphological mass transport measures derived with benchmark structures alleviates the need for a relatively tedious determination of these hydrodynamic properties by experiment or simulation and also improves the possibilities for in silico tailoring of new materials for adsorption, separation, and catalysis.
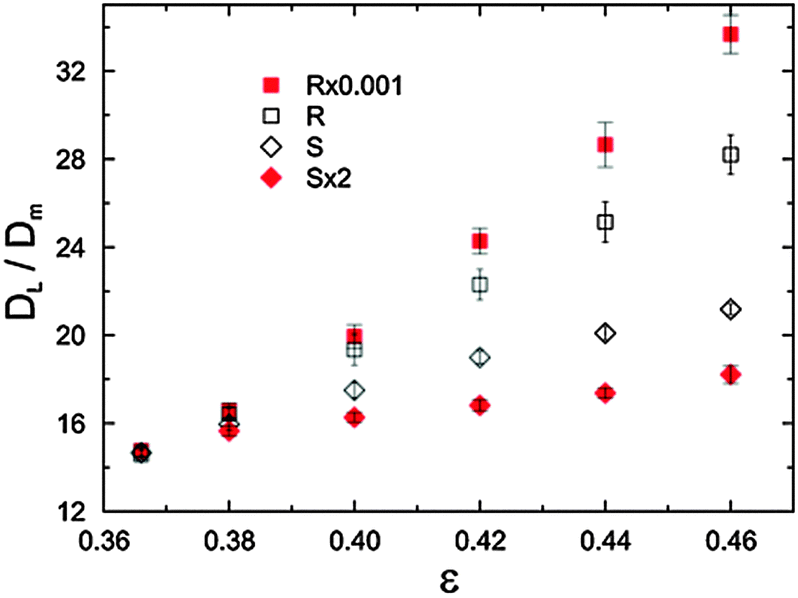 | ||
| Fig. 22 Asymptotic longitudinal dispersion coefficients (DL) normalized by the molecular diffusivity in bulk solution (Dm) at a particle Péclet number of Pe = 50, i.e., in the advection-dominated transport regime, for the different sphere packing types as a function of bed porosity. Error bars indicate 95% confidence intervals. Reprinted from Khirevich et al.22 Copyright 2010, with permission from Elsevier. | ||
Additionally, these detailed studies help in a fundamental understanding of the complex transport processes in porous media. For example, longitudinal hydrodynamic dispersion in packed beds and monoliths originates in velocity biases on different length scales.14,15 The velocity bias in an individual pore causes transchannel dispersion, while the velocity bias between adjacent pores is responsible for short-range interchannel dispersion.22,24 These two contributions are reflected in the CLD analysis.174 For monoliths, it has been shown that the morphological parameters μ and k that are obtained from fitting the k–Γ-function to the macropore space CLDs can be related to their hydrodynamic properties:178 a smaller value for μ is expressed in lower transchannel dispersion, while a larger k-value represents a higher homogeneity on the scale of 1–2 macropores, reducing short-range interchannel dispersion. Relationships between μ and k and dispersion in monoliths were established from a systematic set of physically reconstructed silica monoliths. The derived morphological data were then correlated with experimental separation efficiencies,178 and selected physical reconstructions (based on confocal laser scanning microscopy, cf.Fig. 8) were further used as a model in simulations of flow and transient as well as asymptotic dispersion coefficients to validate time and length scales behind transchannel and short-range interchannel dispersion indicated by the corresponding CLD analysis.208,209 Importantly, since no assumptions were made about the underlying bed morphology (in general, particulate bed or monolith; in particular, soft or hard matter-type support) in deriving these relationships and validating morphological mass transport (here longitudinal dispersion) measures, they are a suitable reference in hydrodynamic studies with a variety of materials.
4.2 Effective diffusion coefficients
In contrast to the advection-dominated transport on the macropore scale, where the dispersion coefficient is (eventually, much) larger than the molecular diffusion coefficient, on the mesopore scale, where purely-diffusive or at least diffusion-limited transport prevails, the salient structural features hinder a free molecular translation due to geometrical restrictions. Here, we only discuss the phenomenological impact of structural features in diffusive processes, greatly simplifying the topic, and the reader is referred to the literature, where excellent reviews and textbooks on this topic are available.1,5,210–213 In general, the impact of morphology (idealized for a passive, point-like tracer) can be quantified in terms of the diffusive tortuosity τ, a lumped parameter that relates the effective diffusion coefficient (Deff) observed in the long-time limit to the bulk diffusion coefficient (Dm). For example, the effective diffusivity is the ultimate transport parameter relating, expressed by a single tortuosity factor and the respective network porosity, the diffusive flux into and out of the porous particles in a packing or the porous skeleton of a monolith to the intrinsic system morphology (geometry and topology) and the actual degree of structural heterogeneity. It includes surface characteristics (e.g. chemical modification, roughness), pore size distribution, pore shape, and pore interconnectivity. For clarity, we note that the diffusive tortuosity, which is related to actual mass transport, should not be confused with the geometric tortuosity mentioned in Section 3.4.180,210The diffusive tortuosity of the interstitial void space in beds formed by discrete particles is of special academic and technological interest. Due to the scale-independence of this measure, it is applicable to the interparticle macropore space in slurry-packed beds of micrometer-sized beads (cf.Fig. 6) as well as to characterize tortuosity in the mesoporous beads themselves, if they are based on an agglomeration of smaller particles (cf.Fig. 7). Diffusive tortuosities τ = Dm/Deff for computer-generated and selected experimental particulate beds are summarized in Fig. 23. In Fig. 23A three groups of monodisperse sphere arrangements can be recognized: one consisting of (diluted) crystalline packings (BCC, FCC, HCP), one containing random packings simulated using the Monte Carlo method (Ω × 0.95 and Ω × 0.05), and the third group formed by the already familiar packing types obtained using the Jodrey–Tory algorithm (R × 0.001, R, S, and S × 2). All groups show a distinct porosity dependence, which is expected, since the tortuosity always has to vary between infinity (ε → 0) and unity (ε → 1). In the investigated porosity range the ordered packings reveal the lowest tortuosities. It is explained by the formation of channels, in which unhindered diffusion can take place in these structures. Actually, these tortuosities are averaged values; the anisotropy of the ordered packings also results in an anisotropy of tortuosities, which may lead to significant performance drops as directional transport, e.g. diffusive transport through membranes73 or flow through ordered packings at different angles193 is analysed. Simulated tortuosities for the ordered sphere arrangements in Fig. 23A are in good agreement with the analytical predictions based on the work of Venema et al.214
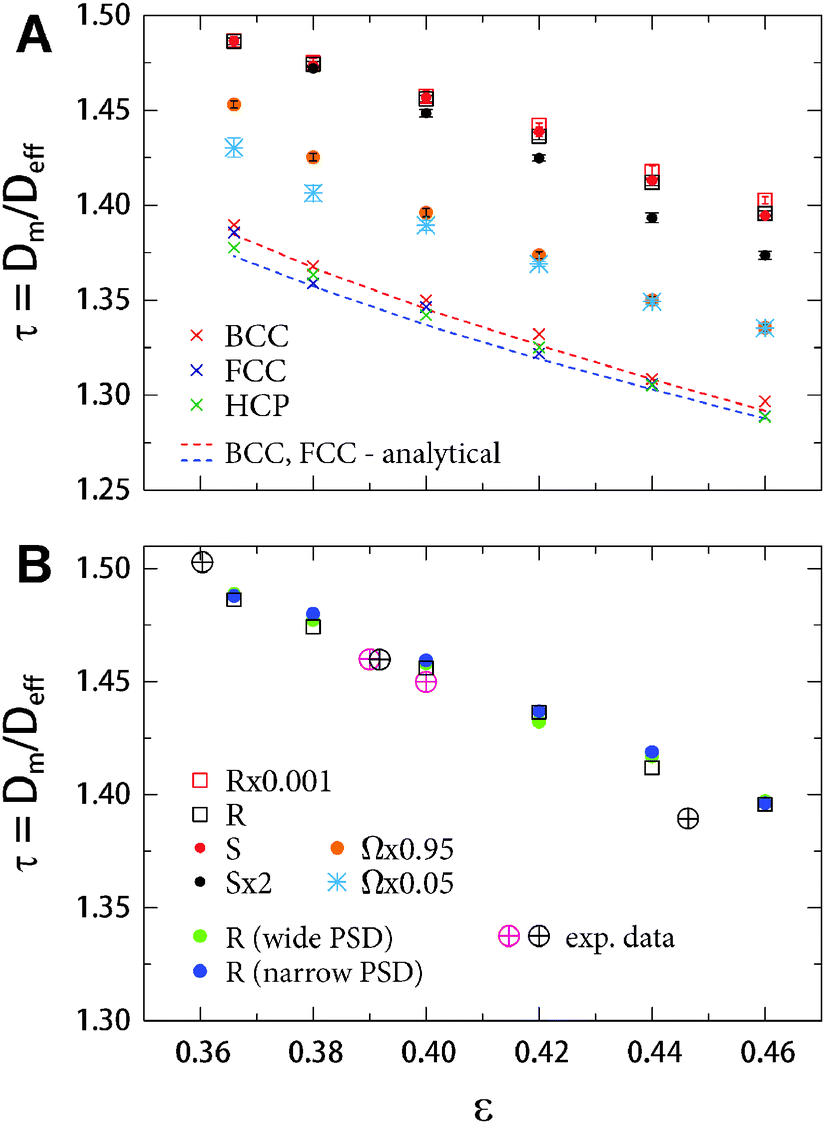 | ||
| Fig. 23 (A) Diffusive tortuosities from mass transport simulations (i.e., the simulation of effective diffusion coefficients) in computer-generated ordered packings (diluted body-centered cubic, face-centered cubic, and hexagonal closest packings) and disordered packings (different packing types as discussed in the text) of monosized spheres as a function of bed porosity.23 Analytical solutions are from Venema et al.214 (B) Diffusive tortuosities for computer-generated sphere packings prepared with narrow or wide particle size distribution (PSD), i.e., with ∼3% or ∼25% relative standard deviation of the PSD.24 The added experimental data for polydisperse packings are from Delgado197 (pink crossed circles) as well as Barrande et al.215 (black crossed circles). | ||
The Jodrey–Tory packing types, on the other hand, reveal the highest tortuosities. As the Voronoi volume distribution analysis has already suggested (microstructural congruence of the packings at the lowest realized porosity, cf.Fig. 15), the corresponding tortuosity values also coincide. With increasing porosity, the values start to show differences. The more heterogeneous R-type packings demonstrate higher tortuosity than the more homogeneous S-type packings. Packings generated using the Monte Carlo approach show tortuosity values in between the diluted crystals and packings generated using the Jodrey–Tory algorithm, since the Monte Carlo packings generally possess more homogeneous pore environments than the Jodrey–Tory packings. Furthermore, the tortuosities for the two Monte Carlo-type packings (different compression rates) are different at the lowest realized porosity and show little (or no) variation at high porosities. If we consider the packing generation process, as described earlier, this behaviour can be explained by the intrinsic algorithm properties. The Monte Carlo algorithm is known to incorporate highly ordered, densely packed regions into a packing, if low compression rates and low bed porosities are combined (cf. Ω × 0.05 packing type). This is reflected in the tortuosities.23
Diffusive tortuosities for polydisperse sphere packings at a single packing type (R-packings) are presented in Fig. 23B. The packings were computer-generated by replacing the single particle diameter with a particle size distribution. Two distributions, a narrow and a wide, were realized and adapted from modern, commercial HPLC particles.24 Their relative standard deviations were ∼3% and ∼25%, respectively, spanning the range typical for HPLC practice today.14 The simulated tortuosities were compared to experimentally obtained tortuosities from the work of Delgado197 and Barrande et al.215 Simulated and experimental values are in good agreement, demonstrating the validity and applicability of this approach. Although tortuosity is primarily a function of the porosity, the influence of the microstructural disorder and heterogeneity cannot be neglected. An inspection of the tortuosity–porosity data in Fig. 23 for all the different packing types suggests that the direct environment of individual pores in a packing has an impact on diffusion. To find a suitable measure for the structural heterogeneity at this length scale, Khirevich et al.23 employed Delaunay tessellation. It divides a packing into irregular tetrahedra, whose vertices are centers of the four closest spheres that enclose a pore, as illustrated in Fig. 10. Here, the void volume of a tetrahedron represents the pore volume; the void areas of its faces correspond to cross-sections of pore throats that form connections to the neighboring pores. They are entrance/exit ways into or out of a given pore.
A good representation for the tortuosity–porosity scaling of all investigated packing types can be achieved by considering two limiting properties for each pore, i.e., the ratio of the minimum and maximum void face areas of a Delaunay tetrahedron, (Amin/Amax)D. The probability for a tracer to move into or out of a pore is determined by the size of the pore throats, whose cross-sections are represented by the void areas of the tetrahedron's four faces. Therefore, the value of (Amin/Amax)D can be interpreted as a measure of heterogeneity in the direct environment of a single pore. The lower (Amin/Amax)D, the more heterogeneous is the pore environment. If the pore environment is fully homogeneous, then (Amin/Amax)D = 1, since all void face areas are equal. In the next step, the (Amin/Amax)D distribution is calculated for each packing. This statistics records all different kinds of pore environments that exist in a packing. Fig. 24 shows that the standard deviation of this distribution has a porosity-scaling (panel B) that closely mimics that of the tortuosity values for each packing type (panel A). Consequently, σ(Amin/Amax)D has been proposed as a descriptor for the influence of packing microstructure on the effective diffusion coefficient (and diffusive tortuosity) in random sphere packings.23
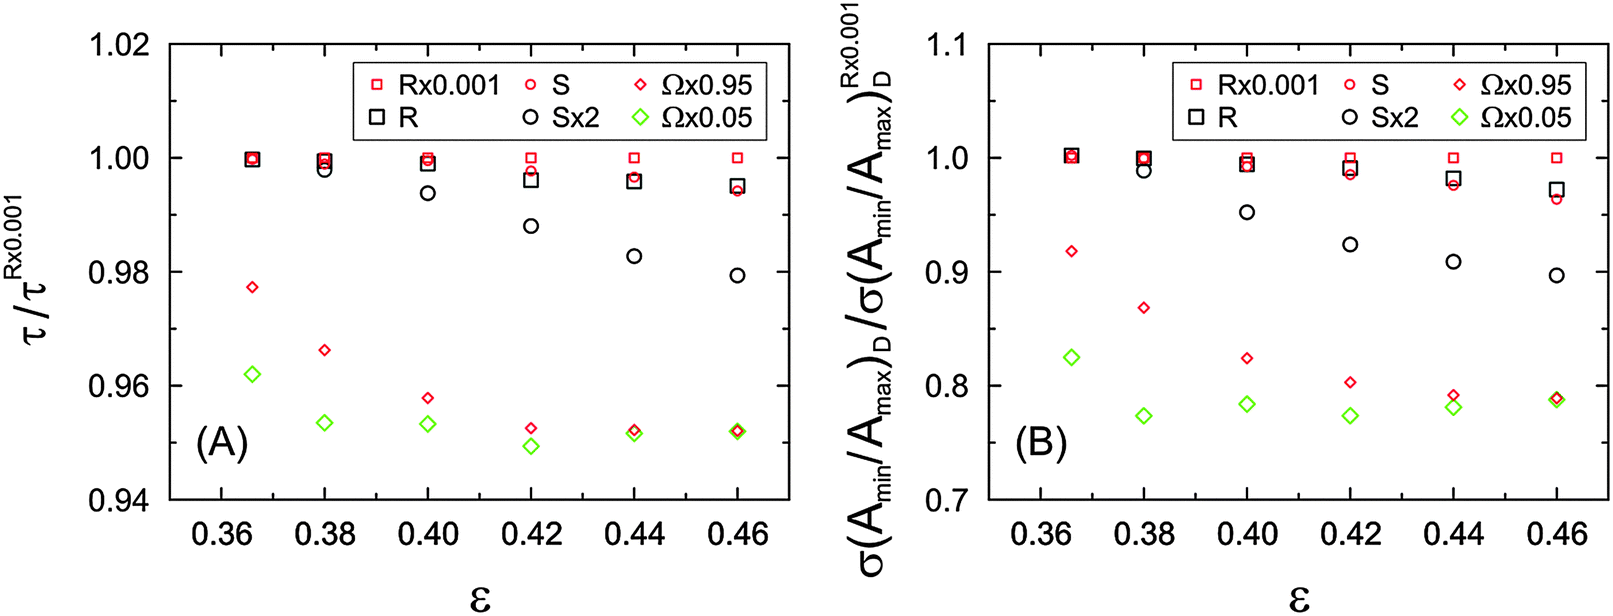 | ||
| Fig. 24 (A) Diffusive tortuosity for random packings of monosized spheres in dependence of the packing type and bed porosity, normalized by tortuosity for the most heterogeneous (R × 0.001) packing type. (B) Porosity-scaling of the normalized σ(Amin/Amax)D, the standard deviation of the distribution that describes the ratio between the minimum and maximum void face areas of each Delaunay tetrahedron in a tessellated packing. Reprinted from Khirevich et al.23 Copyright 2011, with permission from Elsevier. | ||
The correlation between the diffusive tortuosities for random sphere packings and the limiting properties of their individual pores, i.e., the ratio of minimum to maximum size of the pore throats, reflects the piecewise, random nature of diffusion. This contrasts with hydrodynamic dispersion analysed in Section 4.1, which depends on the (directional) flow field and is correlated with the microstructural degree of heterogeneity of a packing, quantified through Voronoi volume analysis. Packings with identical microstructural heterogeneity (such as R- and S-packings at ε = 0.366, cf.Fig. 15) have identical dispersion coefficients (Fig. 22) and tortuosities (Fig. 23A), but packings with different degrees of heterogeneity and thus dispersion coefficients can nevertheless have identical tortuosities, as seen for R- and S-packings at ε = 0.46. These examples highlight the importance of finding the relevant length scales of structural inhomogeneities for each transport phenomenon to derive quantitative morphology–transport relationships: packing-scale disorder for flow-field dependent dispersion, pore-environment heterogeneity for diffusion.22,23
5. Conclusions and perspective
The time is ripe for a further leap in materials science. It characterizes a highly interdisciplinary methodology and interaction between researchers. At a time, where both our computational and experimental approaches offer a huge variety of functional porous materials with systematically, sensitively addressable physicochemical properties; where advanced imaging and reconstruction methods become available, often in the form of national research centers that provide user access via open calls;216 where powerful statistical methods, suitable for the analysis of the obtained 3D morphologies, emerge from their niche, e.g. in theoretical physics and applied mathematics and are even recognized in dedicated research programs;217 where advanced computational methods, allowing an unusually detailed 3D modeling of flow, transport, adsorption, and reaction in these reconstructed materials, get ever more efficiently implemented and scaled on publicly available supercomputing platforms218 – at that time, a strategy with a new dimension of power towards the rational design of materials relies on the establishment of quantitative relationships between the salient features of their preparation and synthesis conditions and resulting performance-relevant (if not performance-limiting) morphological features.This methodology is summarized in Fig. 25, including some of the already discussed materials, morphological parameters (structural descriptors), and transport phenomena. Once a material is reconstructed on its characteristic length scales, for example, the intraparticle mesopore space of a silica221 or zeolite222 particle, the intraskeleton mesopore space of a silica monolith170 as well as the interskeleton macropore space of silica112,121 and polymer173,223 monoliths, or the interparticle macropore space in packed particulate beds,98,104,108 it can be analysed using statistical methods, such as chord length distributions for monoliths and tessellation schemes for particulate matter. Beyond geometrical characterization, topological data may be derived as well, e.g. about pore interconnectivity.121,180,181 After morphological analysis, the reconstructions – which need to be sufficiently large to cover a representative volume of the material reflecting its bulk properties173 – can be used as models in direct simulations of diffusion, flow, and mass transport on the pore scale.209,224,225 The scope of these simulations can be well extended to include adsorption226–228 and reaction229–232 at the solid surface, or to introduce intraparticle (intraskeleton) porosity and transport properties.27 As a result of such a level of simulations with unusual spatio-temporal and realistic structural details, key information is obtained, e.g. about the individual contributions to the lumped adsorption/diffusion kinetics traditionally observed at the macroscale, on the local effectiveness of catalysts, or the characteristic length scales of structural heterogeneities behind overall dispersion. Importantly, these detailed simulations will allow us to identify and validate meaningful structural descriptors of particular transport phenomena. These descriptors then become sensitive morphological mass transport measures, which guide the preparation and fine-tuning of functional porous materials in the future.
 | ||
| Fig. 25 Interdisciplinary methodology for the establishment of quantitative preparation–morphology–mass transport relationships in functional materials. (top left) Computational and/or experimental preparation of materials (e.g. packed beds and monoliths) with addressable morphology and functionality. Advanced imaging methods provide access to the 3D morphology; statistical methods allow us to quantify morphological properties. (top row) Chord length distribution analysis for the void space and skeleton in a poly(styrene–divinylbenzene) monolith reconstructed based on serial block-face scanning electron microscopy. Adapted from Müllner et al.173 Published under the Creative Commons license (CC BY-NC-ND 4.0). (left column) Numerical approach for simulation of hydrodynamic dispersion in a (here computer-generated) random sphere packing. After the 3D flow velocity field is calculated using the lattice-Boltzmann method, the motion of a passive tracer in the velocity field is simulated using a random-walk particle-tracking method. Adapted with permission from Hlushkou et al.219 Copyright 2007, American Chemical Society. (bottom row) Both sorption and reaction can be superimposed on these 3D simulation schemes to address the functionality of a material. Adapted with permission from Hlushkou et al.220 Copyright 2014, American Chemical Society. (center and bottom right) Voronoi volume analysis and simulated dispersion coefficients for identification of sensitive morphological mass transport parameters in randomly packed beds. Adapted from Khirevich et al.22 Copyright 2010, with permission from Elsevier. | ||
Acknowledgements
This work was supported by the Deutsche Forschungsgemeinschaft DFG (Bonn, Germany) under grant TA 268/9–1.References
- S. Torquato, Random Heterogeneous Materials: Microstructure and Macroscopic Properties, Springer, New York, 2002 Search PubMed.
- M. Sahimi, Heterogeneous Materials: Vol. I. Linear Transport and Optical Properties, Springer, New York, 2003 Search PubMed.
- R. B. Bird, W. E. Stewart and E. N. Lightfoot, Transport Phenomena, John Wiley & Sons, New York, 2nd edn, 2002 Search PubMed.
- G. Guiochon, A. Felinger, D. G. Shirazi and A. M. Katti, Fundamentals of Preparative and Nonlinear Chromatography, Academic Press, Amsterdam, The Netherlands, 2nd edn, 2006 Search PubMed.
- J. Kärger, D. M. Ruthven and T. N. Theodorou, Diffusion in Nanoporous Materials, Wiley-VCH, Weinheim, 2012 Search PubMed.
- S. Lopez-Orozco, A. Inayat, A. Schwab, T. Selvam and W. Schwieger, Adv. Mater., 2011, 23, 2602–2615 CrossRef CAS PubMed.
- Y. Li, Z.-Y. Fu and B.-L. Su, Adv. Funct. Mater., 2012, 22, 4634–4667 CrossRef CAS.
- N. D. Petkovich and A. Stein, Chem. Soc. Rev., 2013, 42, 3721–3739 RSC.
- A. Inayat, B. Reinhardt, H. Uhlig, W.-D. Einicke and D. Enke, Chem. Soc. Rev., 2013, 42, 3753–3764 RSC.
- C. M. A. Parlett, K. Wilson and A. F. Lee, Chem. Soc. Rev., 2013, 42, 3876–3893 RSC.
- L. Gueudré, M. Milina, S. Mitchell and J. Pérez-Ramírez, Adv. Funct. Mater., 2014, 24, 209–219 CrossRef.
- A. G. Machoke, A. M. Beltrán, A. Inayat, B. Winter, T. Weissenberger, N. Kruse, R. Güttel, E. Spiecker and W. Schwieger, Adv. Mater., 2015, 27, 1066–1070 CrossRef CAS PubMed.
- E. Stavitski and B. M. Weckhuysen, Chem. Soc. Rev., 2010, 39, 4615–4625 RSC.
- F. Gritti and G. Guiochon, J. Chromatogr. A, 2012, 1221, 2–40 CrossRef CAS PubMed.
- F. Gritti and G. Guiochon, Anal. Chem., 2013, 85, 3017–3035 CrossRef CAS PubMed.
- F. Tariq, P. D. Lee, R. Haswell and D. W. McComb, Chem. Eng. Sci., 2011, 66, 5804–5812 CrossRef CAS.
- D. Gostovic, N. J. Vito, K. A. O'Hara, K. S. Jones and E. D. Wachsman, J. Am. Ceram. Soc., 2011, 94, 620–627 CrossRef CAS.
- S. J. Harris and P. Lu, J. Phys. Chem. C, 2013, 117, 6481–6492 CAS.
- M. Milina, S. Mitchell, P. Crivelli, D. Cooke and J. Pérez-Ramírez, Nat. Commun., 2014, 5, 3922 Search PubMed.
- S. Khirevich, A. Höltzel and U. Tallarek, Commun. Comput. Phys., 2013, 13, 801–822 Search PubMed.
- V. Baranau and U. Tallarek, Soft Matter, 2014, 10, 3826–3841 RSC.
- S. Khirevich, A. Daneyko, A. Höltzel, A. Seidel-Morgenstern and U. Tallarek, J. Chromatogr. A, 2010, 1217, 4713–4722 CrossRef CAS PubMed.
- S. Khirevich, A. Höltzel, A. Daneyko, A. Seidel-Morgenstern and U. Tallarek, J. Chromatogr. A, 2011, 1218, 6489–6497 CrossRef CAS PubMed.
- A. Daneyko, A. Höltzel, S. Khirevich and U. Tallarek, Anal. Chem., 2011, 83, 3903–3910 CrossRef CAS PubMed.
- U. M. Scheven, S. Khirevich, A. Daneyko and U. Tallarek, Phys. Rev. E: Stat., Nonlinear, Soft Matter Phys., 2014, 89, 053023 CrossRef CAS PubMed.
- H. Liasneuski, D. Hlushkou, S. Khirevich, A. Höltzel, U. Tallarek and S. Torquato, J. Appl. Phys., 2014, 116, 034904 CrossRef.
- A. Daneyko, D. Hlushkou, V. Baranau, S. Khirevich, A. Seidel-Morgenstern and U. Tallarek, J. Chromatogr. A, 2015, 1407, 139–156 CrossRef CAS PubMed.
- B. M. Weckhuysen, Angew. Chem., Int. Ed., 2009, 48, 4910–4943 CrossRef CAS PubMed.
- P. R. Shearing, D. J. L. Brett and N. P. Brandon, Int. Mater. Rev., 2010, 55, 347–363 CrossRef CAS.
- S. Mitchell, N.-L. Michels, K. Kunze and J. Pérez-Ramírez, Nat. Chem., 2012, 4, 825–831 CrossRef CAS PubMed.
- I. L. C. Buurmans and B. M. Weckhuysen, Nat. Chem., 2012, 4, 873–886 CrossRef CAS PubMed.
- A. P. Cocco, G. J. Nelson, W. M. Harris, A. Nakajo, T. D. Myles, A. M. Kiss, J. J. Lombardo and W. K. S. Chiu, Phys. Chem. Chem. Phys., 2013, 15, 16377–16407 RSC.
- D. S. Su, B. Zhang and R. Schlögl, Chem. Rev., 2015, 115, 2818–2882 CrossRef CAS PubMed.
- O. Ersen, I. Florea, C. Hirlimann and C. Pham-Huu, Mater. Today, 2015, 18, 395–408 CrossRef CAS.
- M. Antonietti and G. A. Ozin, Chem. – Eur. J., 2004, 10, 28–41 CrossRef CAS PubMed.
- A. Taguchi and F. Schüth, Microporous Mesoporous Mater., 2005, 77, 1–45 CrossRef CAS.
- Y. Yamauchi, N. Suzuki, L. Radhakrishnan and L. Wang, Chem. Rec., 2010, 9, 321–339 CrossRef PubMed.
- T. B. Kirchner, N. A. Hatab, N. V Lavrik and M. J. Sepaniak, Anal. Chem., 2013, 85, 11802–11808 CrossRef CAS PubMed.
- S. Ravi, D. Horner and S. Moghaddam, Appl. Therm. Eng., 2014, 73, 1371–1377 CrossRef.
- B. A. Rogers, Z. Wu, B. Wei, X. Zhang, X. Cao, O. Alabi and M. J. Wirth, Anal. Chem., 2015, 87, 2520–2526 CrossRef CAS PubMed.
- T. B. Kirchner, R. B. Strickhouser, N. A. Hatab, J. J. Charlton, I. I. Kravchenko, N. V. Lavrik and M. J. Sepaniak, Analyst, 2015, 140, 3347–3351 RSC.
- G. Korotcenkov, Mater. Sci. Eng., R, 2008, 61, 1–39 CrossRef.
- B. J. Melde and B. J. Johnson, Anal. Bioanal. Chem., 2010, 398, 1565–1573 CrossRef CAS PubMed.
- S. Polarz, Adv. Funct. Mater., 2011, 21, 3214–3230 CrossRef CAS.
- M. Vallet-Regi, A. Rámila, R. P. Del Real and J. Pérez-Pariente, Chem. Mater., 2001, 13, 308–311 CrossRef CAS.
- S. Wang, Microporous Mesoporous Mater., 2009, 117, 1–9 CrossRef CAS.
- V. Cauda, L. Mühlstein, B. Onida and T. Bein, Microporous Mesoporous Mater., 2009, 118, 435–442 CrossRef CAS.
- M. Manzano, M. Colilla and M. Vallet-Regí, Expert Opin. Drug Delivery, 2009, 6, 1383–1400 CrossRef CAS PubMed.
- T. Ukmar and O. Planinšek, Acta Pharm., 2010, 60, 373–385 CrossRef CAS PubMed.
- M. Grün, A. A. Kurganov, S. Schacht, F. Schüth and K. K. Unger, J. Chromatogr. A, 1996, 740, 1–9 CrossRef.
- C. Boissière, M. Kümmel, M. Persin, A. Larbot and E. Prouzet, Adv. Funct. Mater., 2001, 11, 129–135 CrossRef.
- T. Martin, A. Galarneau, F. Di Renzo, D. Brunel, F. Fajula, S. Heinisch, G. Crétier and J.-L. Rocca, Chem. Mater., 2004, 16, 1725–1731 CrossRef CAS.
- É. Prouzet and C. Boissière, C. R. Chim., 2005, 8, 579–596 CrossRef.
- Z. Bayram-Hahn, B. A. Grimes, A. M. Lind, R. Skudas, K. K. Unger, A. Galarneau, J. Iapichella and F. Fajula, J. Sep. Sci., 2007, 30, 3089–3103 CrossRef CAS PubMed.
- P. Kumar and V. V. Guliants, Microporous Mesoporous Mater., 2010, 132, 1–14 CrossRef CAS.
- I. Sierra, D. Pérez-Quintanilla, S. Morante and J. Gañán, J. Chromatogr. A, 2014, 1363, 27–40 CrossRef CAS PubMed.
- A. Stein, B. J. Melde and R. C. Schroden, Adv. Mater., 2000, 12, 1403–1419 CrossRef CAS.
- F.-S. Xiao, Top. Catal., 2005, 35, 9–24 CrossRef CAS.
- F. Schüth, Annu. Rev. Mater. Res., 2005, 35, 209–238 CrossRef.
- H. Tüysüz and F. Schüth, Adv. Catal., 2012, 55, 127–239 Search PubMed.
- X. Li, M. Sun, J. C. Rooke, L. Chen and B.-L. Su, Chin. J. Catal., 2013, 34, 22–47 CrossRef.
- S. De Bruyne, W. De Malsche, S. Deridder, H. Gardeniers and G. Desmet, Anal. Chem., 2014, 86, 2947–2954 CrossRef CAS PubMed.
- D. Li, Y. Wang and Y. Xia, Nano Lett., 2003, 3, 1167–1171 CrossRef CAS.
- H. Wu, W. Pan, D. Lin and H. Li, J. Adv. Ceram., 2012, 1, 2–23 CrossRef CAS.
- C. T. Kresge, M. E. Leonowicz, W. J. Roth, J. C. Vartuli and J. S. Beck, Nature, 1992, 359, 710–712 CrossRef CAS.
- K. Möller and T. Bein, Chem. Soc. Rev., 2013, 42, 3689–3707 RSC.
- K. Zhu, B. Yue, W. Zhou and H. He, Chem. Commun., 2003, 98–99 RSC.
- P. Pieranski, L. Strzelecki and B. Pansu, Phys. Rev. Lett., 1983, 50, 900–903 CrossRef CAS.
- P. N. Pusey and W. van Megen, Nature, 1986, 320, 340–342 CrossRef CAS.
- J. Zhu, M. Li, R. Rogers, W. Meyer, R. H. Ottewill, STS-73 Space Shuttle Crew, W. B. Russel and P. M. Chaikin, Nature, 1997, 387, 883–885.
- Z. Cheng, W. B. Russel and P. M. Chaikin, Nature, 1999, 401, 893–895 CrossRef CAS PubMed.
- B. Wei, B. J. Rogers and M. J. Wirth, J. Am. Chem. Soc., 2012, 134, 10780–10782 CrossRef CAS PubMed.
- M. R. Newton, K. A. Morey, Y. Zhang, R. J. Snow, M. Diwekar, J. Shi and H. S. White, Nano Lett., 2004, 4, 875–880 CrossRef CAS.
- U. D. Neue, HPLC Columns: Theory, Technology, and Practice, Wiley-VCH, New York, 1997 Search PubMed.
- K. K. Unger, R. Skudas and M. M. Schulte, J. Chromatogr. A, 2008, 1184, 393–415 CrossRef CAS PubMed.
- M. Tswett, Ber. Dtsch. Bot. Ges., 1906, 24, 316–323 CAS.
- M. Tswett, Ber. Dtsch. Bot. Ges., 1906, 24, 384–393 CAS.
- F. Gritti and G. Guiochon, J. Chromatogr. A, 2012, 1228, 2–19 CrossRef CAS.
- C. Song, P. Wang and H. A. Makse, Nature, 2008, 453, 629–632 CrossRef CAS PubMed.
- V. Baranau, D. Hlushkou, S. Khirevich and U. Tallarek, Soft Matter, 2013, 9, 3361–3372 RSC.
- W. S. Jodrey and E. M. Tory, Phys. Rev. A: At., Mol., Opt. Phys., 1985, 32, 2347–2351 CrossRef.
- M. P. Allen and D. J. Tildesley, Computer Simulation of Liquids, Clarendon Press, Oxford, 1989, ch. 4.4 Search PubMed.
- T. Aste, M. Saadatfar and T. Senden, Phys. Rev. E: Stat., Nonlinear, Soft Matter Phys., 2005, 71, 061302 CrossRef CAS PubMed.
- J. W. Jorgenson, Annu. Rev. Anal. Chem., 2010, 3, 129–150 CrossRef CAS PubMed.
- J. P. C. Vissers, H. A. Claessens, J. Laven and C. A. Cramers, Anal. Chem., 1995, 67, 2103–2109 CrossRef CAS.
- G. Guiochon, T. Farkas, H. Guan-Sajonz, J.-H. Koh, M. Sarker, B. J. Stanley and T. Yun, J. Chromatogr. A, 1997, 762, 83–88 CrossRef CAS PubMed.
- J. P. C. Vissers, M. A. Hoeben, J. Laven, H. A. Claessens and C. A. Cramers, J. Chromatogr. A, 2000, 883, 11–25 CrossRef CAS PubMed.
- R. A. Shalliker, B. S. Broyles and G. Guiochon, J. Chromatogr. A, 2000, 888, 1–12 CrossRef CAS PubMed.
- B. G. Yew, J. Ureta, R. A. Shalliker, E. C. Drumm and G. Guiochon, AIChE J., 2003, 49, 642–664 CrossRef CAS.
- J. J. Kirkland and J. J. DeStefano, J. Chromatogr. A, 2006, 1126, 50–57 CrossRef CAS PubMed.
- M. F. Wahab, C. A. Pohl and C. A. Lucy, J. Chromatogr. A, 2012, 1270, 139–146 CrossRef CAS PubMed.
- L. E. Blue and J. W. Jorgenson, J. Chromatogr. A, 2015, 1380, 71–80 CrossRef CAS PubMed.
- F. Gritti, T. Farkas, J. Heng and G. Guiochon, J. Chromatogr. A, 2011, 1218, 8209–8221 CrossRef CAS PubMed.
- F. Gritti, D. S. Bell and G. Guiochon, J. Chromatogr. A, 2014, 1355, 179–192 CrossRef CAS PubMed.
- M. Jerkins, M. Schröter, H. L. Swinney, T. J. Senden, M. Saadatfar and T. Aste, Phys. Rev. Lett., 2008, 101, 018301 CrossRef PubMed.
- G. R. Farrell, K. M. Martini and N. Menon, Soft Matter, 2010, 6, 2925–2930 RSC.
- L. E. Silbert, Soft Matter, 2010, 6, 2918–2924 RSC.
- S. Bruns, D. Stoeckel, B. M. Smarsly and U. Tallarek, J. Chromatogr. A, 2012, 1268, 53–63 CrossRef CAS PubMed.
- A. B. Yu, C. L. Feng, R. P. Zou and R. Y. Yang, Powder Technol., 2003, 130, 70–76 CrossRef CAS.
- K. J. Dong, R. Y. Yang, R. P. Zou and A. B. Yu, Phys. Rev. Lett., 2006, 96, 145505 CrossRef CAS PubMed.
- I. Schenker, F. T. Filser, L. J. Gauckler, T. Aste and H. J. Herrmann, Phys. Rev. E: Stat., Nonlinear, Soft Matter Phys., 2009, 80, 021302 CrossRef PubMed.
- W. Liu, S. Li, A. Baule and H. A. Makse, Soft Matter, 2015, 11, 6492–6498 RSC.
- S. Bruns, E. G. Franklin, J. P. Grinias, J. M. Godinho, J. W. Jorgenson and U. Tallarek, J. Chromatogr. A, 2013, 1318, 189–197 CrossRef CAS.
- S. Bruns, J. P. Grinias, L. E. Blue, J. W. Jorgenson and U. Tallarek, Anal. Chem., 2012, 84, 4496–4503 CrossRef CAS PubMed.
- S. Khirevich, A. Höltzel, D. Hlushkou and U. Tallarek, Anal. Chem., 2007, 79, 9340–9349 CrossRef CAS PubMed.
- S. Khirevich, A. Höltzel, S. Ehlert, A. Seidel-Morgenstern and U. Tallarek, Anal. Chem., 2009, 81, 4937–4945 CrossRef CAS PubMed.
- S. Jung, A. Höltzel, S. Ehlert, J. A. Mora, K. Kraiczek, M. Dittmann, G. P. Rozing and U. Tallarek, Anal. Chem., 2009, 81, 10193–10200 CrossRef CAS PubMed.
- S. Bruns and U. Tallarek, J. Chromatogr. A, 2011, 1218, 1849–1860 CrossRef CAS PubMed.
- A. Lind, C. du Fresne von Hohenesche, J.-H. Smått, M. Lindén and K. K. Unger, Microporous Mesoporous Mater., 2003, 66, 219–227 CrossRef CAS.
- J. A. Moulijn, M. T. Kreutzer, T. A. Nijhuis and F. Kapteijn, Adv. Catal., 2011, 54, 249–327 CAS.
- S. Polarz and M. Antonietti, Chem. Commun., 2002, 2593–2604 RSC.
- K. Hormann and U. Tallarek, J. Chromatogr. A, 2013, 1312, 26–36 CrossRef CAS PubMed.
- M. Motokawa, H. Kobayashi, N. Ishizuka, H. Minakuchi, K. Nakanishi, H. Jinnai, K. Hosoya, T. Ikegami and N. Tanaka, J. Chromatogr. A, 2002, 961, 53–63 CrossRef CAS PubMed.
- F. C. Leinweber, D. Lubda, K. Cabrera and U. Tallarek, Anal. Chem., 2002, 74, 2470–2477 CrossRef CAS PubMed.
- D. Lubda, W. Lindner, M. Quaglia, C. du Fresne von Hohenesche and K. K. Unger, J. Chromatogr. A, 2005, 1083, 14–22 CrossRef CAS PubMed.
- H. Kobayashi, T. Ikegami, H. Kimura, T. Hara, D. Tokuda and N. Tanaka, Anal. Sci., 2006, 22, 491–501 CrossRef CAS PubMed.
- G. Guiochon, J. Chromatogr. A, 2007, 1168, 101–168 CrossRef CAS PubMed.
- F. Svec, J. Sep. Sci., 2004, 27, 1419–1430 CrossRef CAS PubMed.
- I. Nischang, I. Teasdale and O. Brüggemann, Anal. Bioanal. Chem., 2011, 400, 2289–2304 CrossRef CAS PubMed.
- I. Nischang, J. Chromatogr. A, 2013, 1287, 39–58 CrossRef CAS PubMed.
- D. Stoeckel, C. Kübel, M. O. Loeh, B. M. Smarsly and U. Tallarek, Langmuir, 2015, 31, 7391–7400 CrossRef CAS PubMed.
- J. Babin, J. Iapichella, B. Lefèvre, C. Biolley, J.-P. Bellat, F. Fajula and A. Galarneau, New J. Chem., 2007, 31, 1907–1917 RSC.
- H. Zhong, G. Zhu, P. Wang, J. Liu, J. Yang and Q. Yang, J. Chromatogr. A, 2008, 1190, 232–240 CrossRef CAS PubMed.
- D. Wu, F. Xu, B. Sun, R. Fu, H. He and K. Matyjaszewski, Chem. Rev., 2012, 112, 3959–4015 CrossRef CAS PubMed.
- R. Dawson, A. I. Cooper and D. J. Adams, Prog. Polym. Sci., 2012, 37, 530–563 CrossRef CAS.
- S. Dutta, A. Bhaumik and K. C.-W. Wu, Energy Environ. Sci., 2014, 7, 3574–3592 CAS.
- Q. Liu, Z. Tang, B. Ou, L. Liu, Z. Zhou, S. Shen and Y. Duan, Mater. Chem. Phys., 2014, 144, 213–225 CrossRef CAS.
- P. Novák, K. Müller, K. S. V. Santhanam and O. Haas, Chem. Rev., 1997, 97, 207–282 CrossRef.
- A. Stein, Z. Wang and M. A. Fierke, Adv. Mater., 2009, 21, 265–293 CrossRef CAS.
- L. Yu, N. Brun, K. Sakaushi, J. Eckert and M. M. Titirici, Carbon, 2013, 61, 245–253 CrossRef CAS.
- J. F. Mike and J. L. Lutkenhaus, ACS Macro Lett., 2013, 2, 839–844 CrossRef CAS.
- A. J. Grano, F. M. Sayler, J.-H. Smått and M. G. Bakker, J. Porous Mater., 2014, 21, 1113–1122 CrossRef CAS.
- M. Oschatz, L. Borchardt, M. Thommes, K. A. Cychosz, I. Senkovska, N. Klein, R. Frind, M. Leistner, V. Presser, Y. Gogotsi and S. Kaskel, Angew. Chem., Int. Ed., 2012, 51, 7577–7580 CrossRef CAS PubMed.
- L. Borchardt, M. Oschatz and S. Kaskel, Mater. Horiz., 2014, 1, 157–168 RSC.
- H. R. Luckarift, S. R. Sizemore, K. E. Farrington, J. Roy, C. Lau, P. B. Atanassov and G. R. Johnson, ACS Appl. Mater. Interfaces, 2012, 4, 2082–2087 CAS.
- E. F. Hilder, F. Svec and J. M. J. Fréchet, Electrophoresis, 2002, 23, 3934–3953 CrossRef CAS PubMed.
- F. Svec and Y. Lv, Anal. Chem., 2015, 87, 250–273 CrossRef CAS PubMed.
- B. Corain, M. Zecca and K. Jeřábek, J. Mol. Catal. A: Chem., 2001, 177, 3–20 CrossRef CAS.
- P. Kaur, J. T. Hupp and S. T. Nguyen, ACS Catal., 2011, 1, 819–835 CrossRef CAS.
- A. El Kadib, R. Chimenton, A. Sachse, F. Fajula, A. Galarneau and B. Coq, Angew. Chem., Int. Ed., 2009, 48, 4969–4972 CrossRef CAS PubMed.
- E. S. M. Hitzer, C. Perwass and D. Ichikawa, Interactive 3D Space Group Visualization with CLUCalc and Crystallographic Subperiodic Groups in Geometric Algebra, in Geometric Algebra Computing, ed. G. Scheuermann and E. Bayro-Corrochano, Springer, New York, 2010, pp. 385–400 Search PubMed.
- H. Wang, G. Liu, Y. Chen, A. Saengdeejing, H. Miura and K. Suzuki, Mater. Charact., 2014, 97, 178–182 CrossRef CAS.
- A. Ulman, Chem. Rev., 1996, 96, 1533–1554 CrossRef CAS PubMed.
- T. Zaba, A. Noworolska, C. M. Bowers, B. Breiten, G. M. Whitesides and P. Cyganik, J. Am. Chem. Soc., 2014, 136, 11918–11921 CrossRef CAS PubMed.
- X. Wang, C. Y. Ng, W. Y. Tam, C. T. Chan and P. Sheng, Adv. Mater., 2003, 15, 1526–1528 CrossRef CAS.
- A. Okabe, B. Boots, K. Sugihara and S. N. Chiu, Spatial Tessellations: Concepts and Applications of Voronoi Diagrams, John Wiley & Sons Ltd., Chichester, England, 2000 Search PubMed.
- A. V. Anikeenko, M. L. Gavrilova and N. N. Medvedev, Shapes of Delaunay Simplexes and Structural Analysis of Hard Sphere Packings, in Generalized Voronoi Diagram: A Geometry-Based Approach to Computational Intelligence, Studies in Computational Intelligence, ed. M. L. Gavrilova, Springer-Verlag, Berlin, Heidelberg, 2009, vol. 158, pp. 13–45 Search PubMed.
- B. Chareyre, A. Cortis, E. Catalano and E. Barthélemy, Transp. Porous Media, 2012, 94, 595–615 CrossRef CAS.
- G. E. Schröder-Turk, R. Schielein, S. C. Kapfer, F. M. Schaller, G. W. Delaney, T. Senden, M. Saadatfar, T. Aste and K. Mecke, AIP Conf. Proc., 2013, 1542, 349–352 CrossRef.
- N. N. Medvedev, V. P. Voloshin, V. A. Luchnikov and M. L Gavrilova, J. Comput. Chem., 2006, 27, 1676–1692 CrossRef CAS PubMed.
- K. Lochmann, L. Oger and D. Stoyan, Solid State Sci., 2006, 8, 1397–1413 CrossRef CAS.
- M. Danisch, Y. Jin and H. A. Makse, Phys. Rev. E: Stat., Nonlinear, Soft Matter Phys., 2010, 81, 051303 CrossRef PubMed.
- F. M. Schaller, S. C. Kapfer, M. E. Evans, M. J. F. Hoffmann, T. Aste, M. Saadatfar, K. Mecke, G. W. Delaney and G. E. Schröder-Turk, Philos. Mag., 2013, 93, 3993–4017 CrossRef CAS.
- R. Jullien, P. Jund, D. Caprion and D. Quitmann, Phys. Rev. E: Stat. Phys., Plasmas, Fluids, Relat. Interdiscip. Top., 1996, 54, 6035–6041 CrossRef CAS.
- P. L. Spedding and R. M. Spencer, Comput. Chem. Eng., 1998, 22, 247–257 CrossRef CAS.
- R. Y. Yang, R. P. Zou and A. B. Yu, Phys. Rev. E: Stat., Nonlinear, Soft Matter Phys., 2002, 65, 041302 CrossRef CAS PubMed.
- T. Aste, J. Phys.: Condens. Matter, 2005, 17, S2361–S2390 CrossRef CAS.
- V. S. Kumar and V. Kumaran, J. Chem. Phys., 2005, 123, 074502 CrossRef PubMed.
- V. S. Kumar and V. Kumaran, Phys. Rev. E: Stat., Nonlinear, Soft Matter Phys., 2006, 73, 051305 CrossRef PubMed.
- S. Rémond, J. L. Gallias and A. Mizrahi, Granular Matter, 2008, 10, 329–334 CrossRef.
- N. Reboul, E. Vincens and B. Cambou, Granular Matter, 2008, 10, 457–468 CrossRef.
- C. Redenbach, Comput. Mater. Sci., 2009, 44, 1397–1407 CrossRef CAS.
- E. A. Lazar, J. K. Mason, R. D. MacPherson and D. J. Srolovitz, Phys. Rev. E: Stat., Nonlinear, Soft Matter Phys., 2013, 88, 063309 CrossRef PubMed.
- K. Yazdchi and S. Luding, Chem. Eng. Sci., 2013, 98, 173–185 CrossRef CAS.
- S. Torquato, Annu. Rev. Mater. Res., 2002, 32, 77–111 CrossRef CAS.
- W. Gille, Powder Technol., 2002, 123, 292–298 CrossRef CAS.
- M.-N. Pons, K. Milferstedt and E. Morgenroth, Chem. Eng. Sci., 2006, 61, 3962–3973 CrossRef CAS.
- S. Ciccariello, J. Appl. Crystallogr., 2014, 47, 1216–1227 CrossRef CAS.
- K. Hormann, T. Müllner, S. Bruns, A. Höltzel and U. Tallarek, J. Chromatogr. A, 2012, 1222, 46–58 CrossRef CAS PubMed.
- D. Stoeckel, C. Kübel, K. Hormann, A. Höltzel, B. M. Smarsly and U. Tallarek, Langmuir, 2014, 30, 9022–9027 CrossRef PubMed.
- W. Gille, D. Enke and F. Janowski, J. Porous Mater., 2002, 9, 221–230 CrossRef CAS.
- A. Cameirao, H. Le Ba, M. Darbouret, J.-M. Herri, J.-L. Peytavy and P. Glénat, J. Cryst. Growth, 2012, 342, 65–71 CrossRef CAS.
- T. Müllner, A. Zankel, F. Svec and U. Tallarek, Mater. Today, 2014, 17, 404–411 CrossRef.
- T. Müllner, A. Zankel, Y. Lv, F. Svec, A. Höltzel and U. Tallarek, Adv. Mater., 2015, 27, 6009–6013 CrossRef PubMed.
- P. Levitz, G. Ehret, S. K. Sinha and J. M. Drake, J. Chem. Phys., 1991, 95, 6151–6161 CrossRef CAS.
- P. Levitz and D. Tchoubar, J. Phys. I, 1992, 2, 771–790 CrossRef CAS.
- T. Aste and T. Di Matteo, Phys. Rev. E: Stat., Nonlinear, Soft Matter Phys., 2008, 77, 021309 CrossRef CAS PubMed.
- S. Bruns, T. Hara, B. M. Smarsly and U. Tallarek, J. Chromatogr. A, 2011, 1218, 5187–5194 CrossRef CAS PubMed.
- R. Meinusch, K. Hormann, R. Hakim, U. Tallarek and B. M. Smarsly, RSC Adv., 2015, 5, 20283–20294 RSC.
- K. Hormann, V. Baranau, D. Hlushkou, A. Höltzel and U. Tallarek, New J. Chem., 2016 10.1039/c5nj02814k.
- Y. Yao, K. J. Czymmek, R. Pazhianur and A. M. Lenhoff, Langmuir, 2006, 22, 11148–11157 CrossRef CAS PubMed.
- P. Levitz, V. Tariel, M. Stampanoni and E. Gallucci, Eur. Phys. J.: Appl. Phys., 2012, 60, 24202 CrossRef.
- D. Silin and T. Patzek, Physica A, 2006, 371, 336–360 CrossRef.
- A. S. Al-Kharusi and M. J. Blunt, J. Pet. Sci. Eng., 2007, 56, 219–231 CrossRef CAS.
- H. Dong and M. J. Blunt, Phys. Rev. E: Stat., Nonlinear, Soft Matter Phys., 2009, 80, 036307 CrossRef PubMed.
- A. P. Jivkov, C. Hollis, F. Etiese, S. A. McDonald and P. J. Withers, J. Hydrol., 2013, 486, 246–258 CrossRef.
- A. N. Ebrahimi, S. Jamshidi, S. Iglauer and R. B. Boozarjomehry, Chem. Eng. Sci., 2013, 92, 157–166 CrossRef.
- C. F. Berg, Transp. Porous Media, 2014, 103, 381–400 CrossRef CAS.
- R. Aris, Proc. R. Soc. London, Ser. A, 1956, 235, 67–77 CrossRef.
- D. A. Edwards, M. Shapiro, H. Brenner and M. Shapira, Transp. Porous Media, 1991, 6, 337–358 CAS.
- M. Quintard and S. Whitaker, Chem. Eng. Sci., 1993, 48, 2537–2564 CrossRef CAS.
- J. Salles, J.-F. Thovert, R. Delannay, L. Prevors, J.-L. Auriault and P. M. Adler, Phys. Fluids A, 1993, 5, 2348–2376 CrossRef CAS.
- S. Didierjean, H. P. Amaral Souto, R. Delannay and C. Moyne, Chem. Eng. Sci., 1997, 52, 1861–1874 CrossRef CAS.
- D. J. Gunn and C. Pryce, Trans. Inst. Chem. Eng., 1969, 47, T341–T350 CAS.
- D. L. Koch and J. F. Brady, J. Fluid Mech., 1985, 154, 399–427 CrossRef CAS.
- J. M. P. Q. Delgado, Heat Mass Transfer, 2006, 42, 279–310 CrossRef CAS.
- J. M. P. Q. Delgado, Chem. Eng. Res. Des., 2007, 85, 1245–1252 CrossRef CAS.
- R. S. Maier, D. M. Kroll, R. S. Bernard, S. E. Howington, J. F. Peters and H. T. Davis, Phys. Fluids, 2000, 12, 2065–2079 CrossRef CAS.
- M. R. Schure, R. S. Maier, D. M. Kroll and H. T. Davis, Anal. Chem., 2002, 74, 6006–6016 CrossRef CAS PubMed.
- B. Bijeljic, A. H. Muggeridge and M. J. Blunt, Water Resour. Res., 2004, 40, W11501 CrossRef.
- B. Bijeljic and M. J. Blunt, Water Resour. Res., 2006, 43, W12S11 Search PubMed.
- S. Khirevich, A. Höltzel, A. Seidel-Morgenstern and U. Tallarek, Anal. Chem., 2009, 81, 7057–7066 CrossRef CAS PubMed.
- A. Daneyko, D. Hlushkou, S. Khirevich and U. Tallarek, J. Chromatogr. A, 2012, 1257, 98–115 CrossRef CAS PubMed.
- M. Icardi, G. Boccardo, D. L. Marchisio, T. Tosco and R. Sethi, Phys. Rev. E: Stat., Nonlinear, Soft Matter Phys., 2014, 90, 013032 CrossRef PubMed.
- M. R. Schure and R. S. Maier, J. Chromatogr. A, 2006, 1126, 58–69 CrossRef CAS PubMed.
- A. Daneyko, S. Khirevich, A. Höltzel, A. Seidel-Morgenstern and U. Tallarek, J. Chromatogr. A, 2011, 1218, 8231–8248 CrossRef CAS PubMed.
- S. Khirevich, A. Höltzel, A. Seidel-Morgenstern and U. Tallarek, J. Chromatogr. A, 2012, 1262, 77–91 CrossRef CAS PubMed.
- D. Hlushkou, S. Bruns, A. Höltzel and U. Tallarek, Anal. Chem., 2010, 82, 7150–7159 CrossRef CAS.
- D. Hlushkou, K. Hormann, A. Höltzel, S. Khirevich, A. Seidel-Morgenstern and U. Tallarek, J. Chromatogr. A, 2013, 1303, 28–38 CrossRef CAS PubMed.
- B. Ghanbarian, A. G. Hunt, R. P. Ewing and M. Sahimi, Soil Sci. Soc. Am. J., 2013, 77, 1461–1477 CrossRef CAS.
- J. Kärger and R. Valiullin, Chem. Soc. Rev., 2013, 42, 4172–4197 RSC.
- X. Gao, J. C. Diniz da Costa and S. K. Bhatia, Chem. Eng. Sci., 2014, 110, 55–71 CrossRef CAS.
- J. Kärger, ChemPhysChem, 2015, 15, 24–51 CrossRef PubMed.
- P. Venema, R. P. W. J. Struis, J. C. Leyte and D. Bedeaux, J. Colloid Interface Sci., 1991, 141, 360–373 CrossRef CAS.
- M. Barrande, R. Bouchet and R. Denoyel, Anal. Chem., 2007, 79, 9115–9121 CrossRef CAS PubMed.
- For example: Karlsruhe Nano Micro Facility (KNMF), Karlsruhe Institute of Technology (KIT); http://www.knmf.kit.edu (accessed November 2015).
- Geometry and Physics of Spatial Random Systems, Interdisciplinary research unit set up by the Deutsche Forschungsgemeinschaft (FOR1548); http://www.gpsrs.de (accessed November 2015).
- For example: Gauss Centre for Supercomputing (GCS); http://www.gauss-centre.eu (accessed November 2015).
- D. Hlushkou, S. Khirevich, V. Apanasovich, A. Seidel-Morgenstern and U. Tallarek, Anal. Chem., 2007, 79, 113–121 CrossRef CAS PubMed.
- D. Hlushkou, F. Gritti, G. Guiochon, A. Seidel-Morgenstern and U. Tallarek, Anal. Chem., 2014, 86, 4463–4470 CrossRef CAS PubMed.
- E. P. W. Ward, T. J. V. Yates, J.-J. Fernández, D. E. W. Vaughan and P. A. Midgley, J. Phys. Chem. C, 2007, 111, 11501–11505 CAS.
- J. Zečević, C. J. Gommes, H. Friedrich, P. E. de Jongh and K. P. de Jong, Angew. Chem., Int. Ed., 2012, 51, 4213–4217 CrossRef PubMed.
- H. Koku, R. S. Maier, K. J. Czymmek, M. R. Schure and A. M. Lenhoff, J. Chromatogr. A, 2011, 1218, 3466–3475 CrossRef CAS PubMed.
- B. Manz, L. F. Gladden and P. B. Warren, AIChE J., 1999, 45, 1845–1854 CrossRef CAS.
- H. Koku, R. S. Maier, M. R. Schure and A. M. Lenhoff, J. Chromatogr. A, 2012, 1237, 55–63 CrossRef CAS PubMed.
- N. Verma, K. Salem and D. Mewes, Chem. Eng. Sci., 2007, 62, 3685–3698 CrossRef CAS.
- D. Hlushkou, F. Gritti, A. Daneyko, G. Guiochon and U. Tallarek, J. Phys. Chem. C, 2013, 117, 22974–22985 CAS.
- M. Levesque, M. Duvail, I. Pagonabarraga, D. Frenkel and B. Rotenberg, Phys. Rev. E: Stat., Nonlinear, Soft Matter Phys., 2013, 88, 013308 CrossRef PubMed.
- H. Freund, T. Zeiser, F. Huber, E. Klemm, G. Brenner, F. Durst and G. Emig, Chem. Eng. Sci., 2003, 58, 903–910 CrossRef CAS.
- S. P. Sullivan, F. M. Sani, M. L. Johns and L. F. Gladden, Chem. Eng. Sci., 2005, 60, 3405–3418 CrossRef CAS.
- N. Verma and D. Mewes, Chem. Eng. Sci., 2008, 63, 4269–4279 CrossRef CAS.
- D. A. Graf von der Schulenburg and M. L. Johns, Chem. Eng. Sci., 2011, 66, 3003–3011 CrossRef CAS.
| This journal is © The Royal Society of Chemistry and the Centre National de la Recherche Scientifique 2016 |