Long persistent composite phosphor CaAl2O4:Eu2+,Nd3+/Y3Al5O12:Ce3+: a novel strategy to tune the colors of persistent luminescence†
Wenbo
Chen
,
Yuhua
Wang
*,
Wei
Zeng
,
Shaochun
Han
,
Gen
Li
,
Haijie
Guo
,
Yanyan
Li
and
Qinping
Qiang
Key Laboratory for Special Function Materials and Structural Design of the Ministry of Education, School of Physical Science and Technology, Lanzhou University, Lanzhou, 730000, China. E-mail: wyh@lzu.edu.cn; Fax: +86-931-8913554; Tel: +86-931-8912772
First published on 4th November 2015
Abstract
Enhancing the afterglow intensity and prolonging the persistence time, stimulates the applications of long persistent phosphors. However, current methods to improve the luminescent properties of persistent phosphors are invariably complicated. In this work, we demonstrate a simple but effective strategy to manipulate and expand the color of persistent luminescence, through the radiative energy transfer from CaAl2O4:Eu2+,Nd3+ (CA) to Y3Al5O12:Ce3+ (YAG). It is significant to observe that in the CA/YAG composites, the afterglow intensity can be enhanced ∼2.7-fold and the persistence time can be prolonged ∼2.8-fold in comparison with the widely used CA. A white light persistent luminescent composite (B![[thin space (1/6-em)]](https://www.rsc.org/images/entities/char_2009.gif) :
:![[thin space (1/6-em)]](https://www.rsc.org/images/entities/char_2009.gif) Y = 10
Y = 10![[thin space (1/6-em)]](https://www.rsc.org/images/entities/char_2009.gif) :
:![[thin space (1/6-em)]](https://www.rsc.org/images/entities/char_2009.gif) 5) with a decay time of 45 h is obtained. Investigations into the mechanism indicate that the great enhancement of the intensity and persistence time of the long persistent luminescence is directly driven by photopic luminous efficiency and the photo-releasing of energy stored in deep traps. Moreover, the persistent luminescence color of the composites can be tuned from blue to yellow through adjusting the YAG content. In addition, the potential and universality of this color manipulation approach are validated. These results will be greatly beneficial for the applications of long persistent phosphors.
5) with a decay time of 45 h is obtained. Investigations into the mechanism indicate that the great enhancement of the intensity and persistence time of the long persistent luminescence is directly driven by photopic luminous efficiency and the photo-releasing of energy stored in deep traps. Moreover, the persistent luminescence color of the composites can be tuned from blue to yellow through adjusting the YAG content. In addition, the potential and universality of this color manipulation approach are validated. These results will be greatly beneficial for the applications of long persistent phosphors.
Introduction
Since the discovery by Matsuzawa et al. in 1996 of a new persistent phosphor SrAl2O4:Eu2+,Dy3+ emitting bright light for hours after the excitation had ceased,1 research involving stable and efficient persistent phosphors has continuously gained popularity. However, after 19 years of intensive study, only a handful of phosphors are bright enough to be considered for use in practical applications.2,3 In fact, SrAl2O4:Eu2+,Dy3+ (green) still dominates the commercial market due to its sufficiently strong, long decay time and ability to be excited by sunlight and indoor lighting. Therefore, there is still a lack of efficient long persistent phosphors, and their relevant applications are challenged by the generation of multicolored long persistent luminescence (LPL).In principle, we can get any color LPL by mixing the three primary color-emitting long persistent phosphors.4 However, red light emitting long persistent phosphors, one third of the tricolor, are still in demand. On the other hand, this method is also hard to work in practice because we cannot guarantee the LPL decay process for different components will be very consistent, in order to ensure the uniformity of the color during the fading of the LPL. In addition, most of the tricolor long persistent phosphors currently available cannot be efficiently excited by the same excitation source. The other approach is to find a host material that can produce light emission via doping the specific luminescence center,5 such as Eu2+ (full-color),6–9 Sm3+ (red),10 Eu3+ (red),11,12 Dy3+ (white),13 Cr3+ (red or near-infrared),14,15 Tb3+ (green),16,17 Mn2+ (green or red),18,19etc. However, this method to discover new long persistent phosphors is often a matter of trial-and-error and very few phosphors can be considered for use in practical applications. The third way that multicolor LPL can be realized is through persistent energy transfer. Frequently, energy transfer between two ions is used for the sensitization of one of the ions to achieve longer emission wavelengths; such as Eu–Mn,20,21 Ce–Tb,22 Eu–Cr,23 and Ce–Mn.24 However, traps in persistent phosphors, especially in SrAl2O4:Eu2+,Dy3+ or CaAl2O4:Eu2+,Nd3+, probably change due to the doping of another emitter, resulting in the decrease of the persistence time. So far, this method has not been used for practical applications due to poor performance. Hence, it is still a challenge to find efficient ways to tune the color of LPL. LPL is a special case of thermally-stimulated luminescence that relies on the thermal release of the energy stored in traps at room temperature.25,26 In persistent phosphors, two kinds of active centres are involved: emitters and traps.27 Emitters are capable of emitting radiation after being excited. Traps usually do not emit radiation, but store excitation energy and release it gradually to the emitters due to thermal or other physical stimulations. LPL can be optimized by controlling the emitting center (corresponding to the wavelength of emission) and the nature of the traps (corresponding to the intensity and duration of persistent luminescence). Generally, emitters and traps are simultaneously associated with the structure and composition of the matrix. Hence, it is arduous to simultaneously obtain emitters with desired emissions and traps that have the appropriate depth and distribution in a single host.
CaAl2O4:Eu2+,Nd3+ (CA) is a commercially available persistent phosphor and its LPL can last for 19 h.28 This indicates that the suitable depth and high density of traps in the CA phosphor results in the strong ability to store and release energy. However, CA is inadequate for wide applications due to the secondary processing (smash or superficial processing) in industry and the sensitivity of the human eye at certain wavelengths.29 Y3Al5O12:Ce3+ (YAG) is the most famous yellow phosphor that has been commercially used for light emitting devices. YAG possesses favorable characteristics such as high photoluminescence intensity, strong absorption in the blue light region and high quantum efficiency.30 Here, we demonstrate a simple but effective strategy to enhance and manipulate the color of LPL in a CA/YAG composite. The main idea is to utilize the storage ability of traps in the CA phosphor and the high yellow photoluminescence intensity and quantum efficiency of the YAG phosphor. We show that the LPL color can be tuned linearly from blue to yellow by regulating the weight ratio of the two materials. Interestingly, all of the composites show bright LPL and achieve a 2.8-fold enhancement of the intensity of LPL and a 2.7-fold prolongation of the persistence time in comparison with the CA. These results are beneficial for the applications of LPL in emergency lighting which calls for brighter LPL intensity and longer persistence times.
Experimental section
CaAl2O4:0.125%Eu2+,0.25%Nd3+ phosphor was synthesized by a solid-state reaction in a reductive atmosphere. CaCO3 (99%), Al2O3 (99%), Eu2O3 (99.99%) and Nd2O3 (99.99%) were employed as raw materials. In a typical process, first, all starting materials were weighted according to their stoichiometric ratios and a 3% excess of H3BO3 was added to the mixture as a flux. Then, these mixtures were ground evenly in an agate mortar and continually fired at 1400 °C for 4 h in a reductive atmosphere (5% H2 + 95% N2 mixed flowing gas). The commercial Y3Al5O12:Ce3+ (DS008) was purchased from 45 Mengzhi technology Co. Ltd, Taiwan. The prepared CaAl2O4:Eu2+,Nd3+ was mixed with Y3Al5O12:Ce3+ micro-particles by soft planetary ball milling at 200 rpm for 15 min.The phase identification of the samples was carried out on a Rigaku D/Max-2400 X-ray diffractometer with Ni-filter Cu Kα radiation. The photoluminescence (PL) spectra were measured on a FLS-920T fluorescence spectrophotometer with a 450 W xenon arc lamp (Xe 900) as the light source. The decay curves were recorded on a PR 305 phosphorophotometer. The TL curves were obtained on a FJ-427A1 meter with a heating rate of 1 °C s−1 in the temperature range 10–400 °C. Persistent luminescence decay curves were recorded using a PR305 long afterglow instrument after the samples were irradiated with ultraviolet light or sunlight for 10 min.
Results and discussion
1. Design strategy to create a long persistent composite phosphor
Fig. 1 shows the excitation spectrum of YAG and the LPL spectrum of CA at room temperature (Fig. S1, ESI†). Under excitation at 365 nm, CA exhibits a broad 4f65d → 4f7 emission peaking at 444 nm that overlaps with a broad emission band extending from 400 nm to 550 nm. The excitation spectrum of YAG monitored at 565 nm covers a very broad spectral region originating from the transitions of Ce3+. According to Dexter,31 this spectral overlap is a very important factor for the energy transfer from energy donor to energy acceptor. There are two kinds of energy transfer, i.e., nonradiative transfer and radiative transfer. By employing a fully quantum electrodynamical method, the radiative and nonradiative energy transfer mechanisms are equivalent or indistinguishable.32,33 Radiative energy transfer corresponds to a long-range, where the photon loses its virtual character, whereas nonradiative energy transfer is short-range based on virtual photon coupling. In this study, the energy donor and energy acceptor are located in different phosphor particles (long-range). Moreover, as observed in Fig. 1, the excitation spectrum of YAG strongly overlaps with the emission spectrum of CA. Therefore, it is believed that radiative energy transfer can happen from CA to YAG.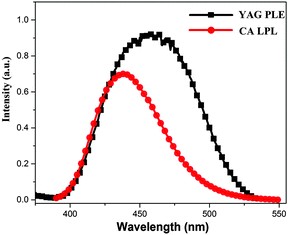 | ||
| Fig. 1 The excitation spectrum of YAG monitored at 565 nm and the LPL spectrum of CA at room temperature. | ||
2. Manipulating the color of LPL in the CA/YAG composite
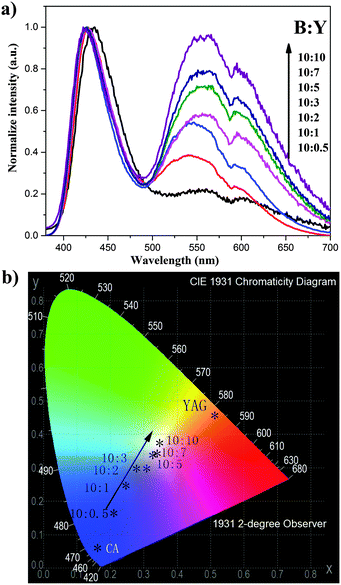
Fig. 2a shows the normalized LPL spectra of the composites with various weight ratios of CA/YAG; referred to here as the blue![[thin space (1/6-em)]](https://www.rsc.org/images/entities/char_2009.gif) :
:![[thin space (1/6-em)]](https://www.rsc.org/images/entities/char_2009.gif) yellow (B
yellow (B![[thin space (1/6-em)]](https://www.rsc.org/images/entities/char_2009.gif) :
:![[thin space (1/6-em)]](https://www.rsc.org/images/entities/char_2009.gif) Y) ratio. Two discrete emission bands, one originating from CA and the other from YAG, are observed. With increasing the amount of YAG, the yellow peak increases. These results imply that the persistent radiative energy transfer occurs from CA to YAG because there is no afterglow in YAG. As we expected, the persistent luminescence color tuning in the composites results from the combination of two independent phosphors. To visualize the color tuning obtained from the CA/YAG composites, we also examined the CIE coordinates obtained from each composite with varying B
Y) ratio. Two discrete emission bands, one originating from CA and the other from YAG, are observed. With increasing the amount of YAG, the yellow peak increases. These results imply that the persistent radiative energy transfer occurs from CA to YAG because there is no afterglow in YAG. As we expected, the persistent luminescence color tuning in the composites results from the combination of two independent phosphors. To visualize the color tuning obtained from the CA/YAG composites, we also examined the CIE coordinates obtained from each composite with varying B![[thin space (1/6-em)]](https://www.rsc.org/images/entities/char_2009.gif) :
:![[thin space (1/6-em)]](https://www.rsc.org/images/entities/char_2009.gif) Y compositions (Fig. 2b). The color of the persistent luminescence changes from blue (0.15, 0.05) to white (0.348, 0.360) upon increasing the YAG fraction.
Y compositions (Fig. 2b). The color of the persistent luminescence changes from blue (0.15, 0.05) to white (0.348, 0.360) upon increasing the YAG fraction.
Fig. 3 shows LPL photographs of the composites with various B![[thin space (1/6-em)]](https://www.rsc.org/images/entities/char_2009.gif) :
:![[thin space (1/6-em)]](https://www.rsc.org/images/entities/char_2009.gif) Y compositions, taken 5 min after exposure to UV light. The color can be controlled by regulating the weight ratio of the two phosphors. With an increasing fraction of YAG, the color of LPL changes gradually from blue to white, and then to yellow. This is slightly different to Fig. 2b, which results from errors when measuring the LPL spectra (ESI† and Fig. S2).
Y compositions, taken 5 min after exposure to UV light. The color can be controlled by regulating the weight ratio of the two phosphors. With an increasing fraction of YAG, the color of LPL changes gradually from blue to white, and then to yellow. This is slightly different to Fig. 2b, which results from errors when measuring the LPL spectra (ESI† and Fig. S2).
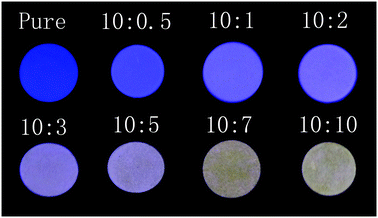 | ||
Fig. 3 Photographs of the persistent luminescence composites with various B![[thin space (1/6-em)]](https://www.rsc.org/images/entities/char_2009.gif) : :![[thin space (1/6-em)]](https://www.rsc.org/images/entities/char_2009.gif) Y compositions, taken 5 min after exposure to UV light. Y compositions, taken 5 min after exposure to UV light. | ||
3. Persistent luminescence properties of the CA/YAG composites
The most important technical criteria for persistent phosphors are persistence time and brightness. High brightness and long persistence time exhibited by persistent phosphors stimulate their applications. However, current methods to improve the luminescence properties of the LPL are always complicated and expensive.34 The persistence time of a persistent phosphor is generally defined as the time when the luminance has decayed to a certain level, typically 0.32 mcd m−2.35 Persistent phosphors suitable for night-vision applications should provide a persistence time of longer than 24 h. For brightness, according to the International Maritime Organization (IMO), persistent phosphors should provide luminance of at least 15 mcd m−2 at 10 min and greater than 2 mcd m−2 at 60 min after the removal of all external excitation sources.36 In this work, all composites with varying B![[thin space (1/6-em)]](https://www.rsc.org/images/entities/char_2009.gif) :
:![[thin space (1/6-em)]](https://www.rsc.org/images/entities/char_2009.gif) Y ratios yield bright LPL. An encouraging result of the present work is that the LPL intensity of the composites to UV light for 10 min can be greatly enhanced compared with the pure CA. LPL intensity was collected 60 min after removal of the excitation source to ensure consistency in the data. Fig. 4a shows the LPL intensity of the composites compared to pure CA. It is obvious that the LPL intensity of the composites can exceed 15 mcd m−2 at 60 min after removal of the excitation source. In comparison with CA, the luminance of the composites can be enhanced by 1.9 to 2.7 times. Fig. 4b shows the decay curves [log10(I) − log10(t)] of pure CA and the composite with B
Y ratios yield bright LPL. An encouraging result of the present work is that the LPL intensity of the composites to UV light for 10 min can be greatly enhanced compared with the pure CA. LPL intensity was collected 60 min after removal of the excitation source to ensure consistency in the data. Fig. 4a shows the LPL intensity of the composites compared to pure CA. It is obvious that the LPL intensity of the composites can exceed 15 mcd m−2 at 60 min after removal of the excitation source. In comparison with CA, the luminance of the composites can be enhanced by 1.9 to 2.7 times. Fig. 4b shows the decay curves [log10(I) − log10(t)] of pure CA and the composite with B![[thin space (1/6-em)]](https://www.rsc.org/images/entities/char_2009.gif) :
:![[thin space (1/6-em)]](https://www.rsc.org/images/entities/char_2009.gif) Y = 10
Y = 10![[thin space (1/6-em)]](https://www.rsc.org/images/entities/char_2009.gif) :
:![[thin space (1/6-em)]](https://www.rsc.org/images/entities/char_2009.gif) 10. As shown in Fig. 4b, the persistent luminescence luminance of the composite is invariably higher than that of pure CA in the process of LPL decay. Detailed reasons will be discussed in depth later.
10. As shown in Fig. 4b, the persistent luminescence luminance of the composite is invariably higher than that of pure CA in the process of LPL decay. Detailed reasons will be discussed in depth later.
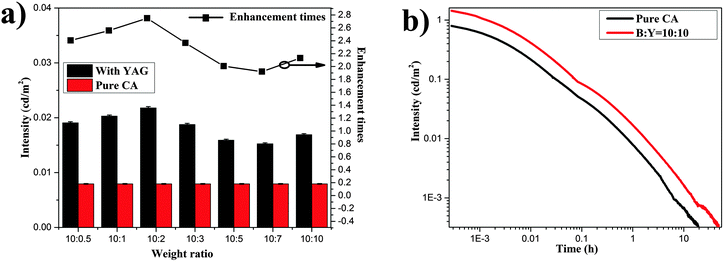 | ||
Fig. 4 (a) LPL intensity of the composites and pure CA collected with a 60 min decay time. (b) Decay curves [log10(I) − log10(t)] of CA and the composite with B![[thin space (1/6-em)]](https://www.rsc.org/images/entities/char_2009.gif) : :![[thin space (1/6-em)]](https://www.rsc.org/images/entities/char_2009.gif) Y = 10 Y = 10![[thin space (1/6-em)]](https://www.rsc.org/images/entities/char_2009.gif) : :![[thin space (1/6-em)]](https://www.rsc.org/images/entities/char_2009.gif) 10. 10. | ||
More importantly, the persistence time of the composites is also prolonged. The persistence time is generally defined as the time when the luminance has decayed to 0.32 mcd m−2, similar to the procedure used in industrial testing.37 The prolongation of the afterglow time of the composites is defined as the ratio of the persistence time of pure CA, and the persistence time of the composite containing YAG. As shown in Fig. 5a, all the composites have longer persistence times with different prolongation factors, from 2.1 times to 2.8 times. Fig. 5b shows the decay curves of pure CA and the composite with B![[thin space (1/6-em)]](https://www.rsc.org/images/entities/char_2009.gif) :
:![[thin space (1/6-em)]](https://www.rsc.org/images/entities/char_2009.gif) Y = 10
Y = 10![[thin space (1/6-em)]](https://www.rsc.org/images/entities/char_2009.gif) :
:![[thin space (1/6-em)]](https://www.rsc.org/images/entities/char_2009.gif) 10. It is significantly obvious that the persistence time of composition is greatly extended and its LPL can last for about 48 h at a recognizable intensity level (0.32 mcd m−2). Most importantly, a white light persistent luminescence composite (B
10. It is significantly obvious that the persistence time of composition is greatly extended and its LPL can last for about 48 h at a recognizable intensity level (0.32 mcd m−2). Most importantly, a white light persistent luminescence composite (B![[thin space (1/6-em)]](https://www.rsc.org/images/entities/char_2009.gif) :
:![[thin space (1/6-em)]](https://www.rsc.org/images/entities/char_2009.gif) Y = 10
Y = 10![[thin space (1/6-em)]](https://www.rsc.org/images/entities/char_2009.gif) :
:![[thin space (1/6-em)]](https://www.rsc.org/images/entities/char_2009.gif) 5) with a persistence time of 45 h is also obtained. To demonstrate the potential and universality of this color manipulation approach, we have also employed yellow Sr3SiO5:Eu2+ and a commercial red phosphor to combine with CA. As we expected, the spectrum of persistent luminescence is changed and an aubergine persistent luminescence composite can be obtained (Fig. S3 and S4, ESI†). This strategy would be of great importance for the application of LPL in emergency route signage and security signals.
5) with a persistence time of 45 h is also obtained. To demonstrate the potential and universality of this color manipulation approach, we have also employed yellow Sr3SiO5:Eu2+ and a commercial red phosphor to combine with CA. As we expected, the spectrum of persistent luminescence is changed and an aubergine persistent luminescence composite can be obtained (Fig. S3 and S4, ESI†). This strategy would be of great importance for the application of LPL in emergency route signage and security signals.
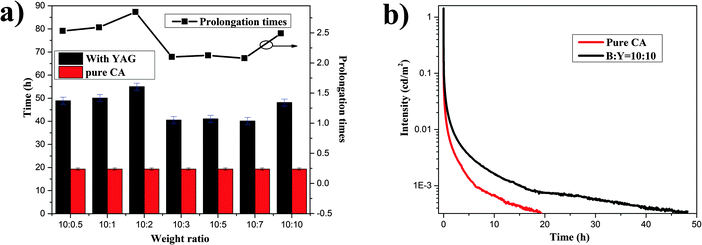 | ||
Fig. 5 (a) Persistence times of CA and the composites. (b) Decay curves of CA and the composite with B![[thin space (1/6-em)]](https://www.rsc.org/images/entities/char_2009.gif) : :![[thin space (1/6-em)]](https://www.rsc.org/images/entities/char_2009.gif) Y = 10 Y = 10![[thin space (1/6-em)]](https://www.rsc.org/images/entities/char_2009.gif) : :![[thin space (1/6-em)]](https://www.rsc.org/images/entities/char_2009.gif) 10. 10. | ||
4. Enhancement mechanism of the persistent luminescence properties
Long persistent phosphors need to absorb and store sunlight energy during the daytime and then emit slowly at night for illumination purposes.38,39 As a result, the stored energy dominates the persistence time and intensity of LPL. As indicated above, when mixed with YAG, both the persistence time and intensity of the composite can be several times greater, compared with pure CA. This is an interesting phenomenon because YAG can hardly store energy and the storage capacity of CA is invariable (Fig. S5, ESI†). Meanwhile, there is energy loss between CA and YAG in the RET process. Reasons for this could involve (i) the photopic luminous efficiency and (ii) the energy that is stored in deep traps, which should be treated by a qualitative analysis.The afterglow brightness is defined as luminous intensity per unit area. The relationship between the luminous flux and the luminous intensity is given by eqn (1).
| cd m−2 = lm (sr m2)−1 | (1) |
 | (2) |
![[thin space (1/6-em)]](https://www.rsc.org/images/entities/char_2009.gif) :
:![[thin space (1/6-em)]](https://www.rsc.org/images/entities/char_2009.gif) Y = 10
Y = 10![[thin space (1/6-em)]](https://www.rsc.org/images/entities/char_2009.gif) :
:![[thin space (1/6-em)]](https://www.rsc.org/images/entities/char_2009.gif) 3. It is obvious that the afterglow spectrum is composed of two bands. One, which is in the blue region, originates from the typical 4f65d1–4f7 transition of Eu2+ in CA. The other is from Ce3+ in YAG with a yellow-emission, which arises from the LPL of CA by RET. As the black line shows in Fig. 6, V(λ) in the blue region is extremely low, whereas the in the yellow region it is quite high. Although CA yields intense LPL, low brightness is obtained because the photopic luminous efficiency, V(λ), in the blue region is quite low. When mixed with YAG, however, due to the high photopic luminous efficiency in the yellow region, the composites exhibit higher brightness despite energy loss during the RET process. With increasing the fraction of YAG, the emission intensity of YAG is observed to increase (Fig. 2a), resulting in brightness enhancement. However, the radiance (W sr−1 m−2) of LPL decreases with increasing YAG content due to energy loss during the RET process. The two processes compete against each other, so the persistence time in Fig. 4a does not increase monotonically with increasing YAG content.
3. It is obvious that the afterglow spectrum is composed of two bands. One, which is in the blue region, originates from the typical 4f65d1–4f7 transition of Eu2+ in CA. The other is from Ce3+ in YAG with a yellow-emission, which arises from the LPL of CA by RET. As the black line shows in Fig. 6, V(λ) in the blue region is extremely low, whereas the in the yellow region it is quite high. Although CA yields intense LPL, low brightness is obtained because the photopic luminous efficiency, V(λ), in the blue region is quite low. When mixed with YAG, however, due to the high photopic luminous efficiency in the yellow region, the composites exhibit higher brightness despite energy loss during the RET process. With increasing the fraction of YAG, the emission intensity of YAG is observed to increase (Fig. 2a), resulting in brightness enhancement. However, the radiance (W sr−1 m−2) of LPL decreases with increasing YAG content due to energy loss during the RET process. The two processes compete against each other, so the persistence time in Fig. 4a does not increase monotonically with increasing YAG content.
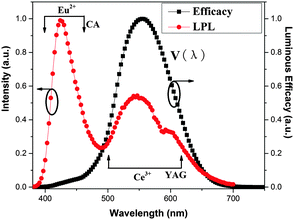 | ||
Fig. 6 The LPL spectrum of the composite with B![[thin space (1/6-em)]](https://www.rsc.org/images/entities/char_2009.gif) : :![[thin space (1/6-em)]](https://www.rsc.org/images/entities/char_2009.gif) Y = 10 Y = 10![[thin space (1/6-em)]](https://www.rsc.org/images/entities/char_2009.gif) : :![[thin space (1/6-em)]](https://www.rsc.org/images/entities/char_2009.gif) 3 (red line) and the photopic luminous efficiency from 380 nm to 750 nm (black line). 3 (red line) and the photopic luminous efficiency from 380 nm to 750 nm (black line). | ||
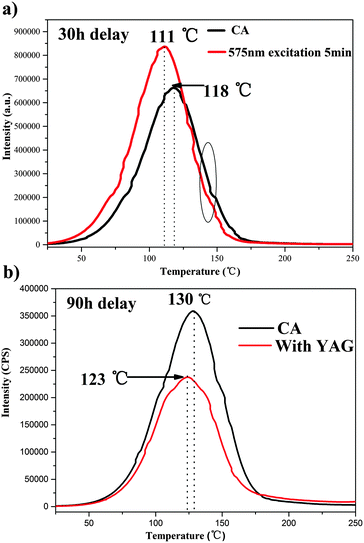
The persistent luminescence is governed by the slow liberation of trapped charge carriers by thermal stimulation.2,41 The LPL can be attributed to energy exchange processes from traps to traps or from traps to the emission centers. Generally, information about the traps that store energy can be obtained from the thermoluminescence (TL) curve. In this work, CA serves as traps and emitters, whereas the YAG only acts as emitters. In order to characterize the interaction between the traps and emitters in these composites, TL measurements were performed on pure CA and the composites. Their TL curves are illustrated in Fig. 7a and b. The black line of Fig. 7a shows the CA TL curve recorded with a delay time of 30 h. It exhibits a broad band that peaks at 118 °C, indicating that the energy stored by deep traps cannot be completely released at room temperature. The red line in Fig. 7a shows the TL curve of CA with a 30 h decay after being exposed to 575 nm illumination for 5 min. The 575 nm light stimulation changes the TL curve profile. The deep-trap band intensity decreases while the shallow-trap band increases. This means that after photostimulation at 575 nm, some of the electrons in the deep traps (circled in Fig. 7a) are photo-released and the emptied shallow traps are refilled. This suggests that the energy stored in deep traps can be photo-released and recaptured by shallow traps. This phenomenon was also recently observed in quite a few LPL and mechanoluminescence materials.42–44 In order to further estimate the effect of the 575 nm photostimulation, the trap densities (n0) and trap depths (Et) were calculated by using Chen's equation.45
| Et = [2.25 + 10.2 × (μg − 0.42)] × (kBTm2)/ω − 2kBTm |
| n0 = ωIm/{β × [2.25 + 10.2 × (μg − 0.42)]} |
Fig. 7b shows the TL of pure CA and the composites with 90 h decay. Compared with the pure CA, the TL intensity of the composites is significantly lower, and the TL peak maximum shows a slight shift towards lower temperatures. To further verify the effect of mixing YAG, the trap densities and trap depths are also calculated. As shown in Table 1, the trap densities of the composites are much lower than that of pure CA, and the trap depths of composites are higher, which indicates that the energy stored in deep traps of CA can be used more effectively by mixing with YAG. Thereafter, this energy contributes to persistent luminescence. So, the persistence time is prolonged, which is consistent with the decay curve shown in Fig. 5.
5. Schematic energy level diagrams
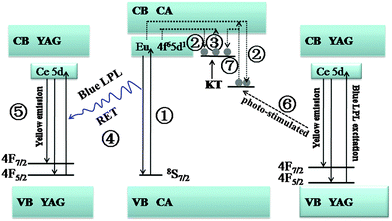
On the basis of the analysis described above, we gain a possible afterglow mechanism of the composites. As illustrated in Fig. 8, under ultraviolet-light excitation, ground state electrons of Eu2+ ions are promoted to the conduction band (CB) (process 1). The excited electrons are subsequently trapped by electron traps (i.e.; O vacancy or Nd dopant) through the CB (process 2). In the persistent luminescence process, the electrons trapped by shallow traps escape thermally via the CB (process 3) and recombine with Eu2+, accompanied by blue LPL. Thereafter, the blue LPL pumps the photoluminescence of YAG phosphor based on RET (process 4). Owing to the large spectral overlap and high optical conversion efficiency of YAG, a large proportion of the blue LPL energy transfers to YAG, which results in a yellow emission (process 5). Hence, the color of the LPL can be tuned from blue to yellow. The yellow light simultaneously can photo-stimulate the electrons in deep traps (process 6). Some of the electrons in deep traps can be released to the CB and some refill the shallow traps (process 7), resulting in a prolonged decay time.Conclusions
In this work, a facile, simple and effective strategy to enhance long persistent luminescence and manipulate color is achieved. A white persistent luminescence composite (B![[thin space (1/6-em)]](https://www.rsc.org/images/entities/char_2009.gif) :
:![[thin space (1/6-em)]](https://www.rsc.org/images/entities/char_2009.gif) Y = 10
Y = 10![[thin space (1/6-em)]](https://www.rsc.org/images/entities/char_2009.gif) :
:![[thin space (1/6-em)]](https://www.rsc.org/images/entities/char_2009.gif) 5) with a 45 h decay time is obtained. The persistent luminescence color of the composites can be tuned from blue to yellow by adjusting the YAG content. Research into the mechanism indicates that the LPL enhancement of the CA/YAG composites is associated with the photopic luminous efficiency (V(λ)) and photo-releasing of energy that is stored in deep traps. Moreover, it is significant to observe that all the composites yield brighter LPL and longer persistence time compared with pure CA. The LPL intensity can be enhanced by ∼2.7-fold and the persistence time can be prolonged by ∼2.8-fold in comparison with the widely used CA. Although the radiance (W sr−1 m−2) of LPL decreases with increasing YAG, the brightness and persistence time increase just by mechanical mixing. This simple and effective strategy would be of great importance for the application of LPL.
5) with a 45 h decay time is obtained. The persistent luminescence color of the composites can be tuned from blue to yellow by adjusting the YAG content. Research into the mechanism indicates that the LPL enhancement of the CA/YAG composites is associated with the photopic luminous efficiency (V(λ)) and photo-releasing of energy that is stored in deep traps. Moreover, it is significant to observe that all the composites yield brighter LPL and longer persistence time compared with pure CA. The LPL intensity can be enhanced by ∼2.7-fold and the persistence time can be prolonged by ∼2.8-fold in comparison with the widely used CA. Although the radiance (W sr−1 m−2) of LPL decreases with increasing YAG, the brightness and persistence time increase just by mechanical mixing. This simple and effective strategy would be of great importance for the application of LPL.
Acknowledgements
This work was supported by the Specialized Research Fund for the Doctoral Program of Higher Education (No. 20120211130003) 35 and the National Natural Science Funds of China (Grant No. 51372105).References
- T. Matsuzawa, Y. Aoki, N. Takeuchi and Y. Murayama, J. Electrochem. Soc., 1996, 143, 2670–2673 CrossRef CAS.
- K. Van den Eeckhout, P. F. Smet and D. Poelman, Materials, 2010, 3, 2536–2566 CrossRef CAS.
- T. Wang, J. Gou, X. Xu, D. Zhou, J. Qiu and X. Yu, Opt. Express, 2015, 23, 12595–12604 CrossRef PubMed.
- J. Hölsä, Electrochem. Soc. Interface, 2009, 18(4), 42–45 Search PubMed.
- V. Caratto, F. Locardi, G. A. Costa, R. Masini, M. Fasoli, L. Panzeri, M. Martini, E. Bottinelli, E. Gianotti and I. Miletto, ACS Appl. Mater. Interfaces, 2014, 6, 17346–17351 CAS.
- J. Wang, H. Zhang, B. Lei, Z. Xia, H. Dong, Y. Liu, M. Zheng and Y. Xiao, J. Mater. Chem. C, 2015, 3, 4445–4451 RSC.
- P. Wang, X. Xu, D. Zhou, X. Yu and J. Qiu, Inorg. Chem., 2015, 54, 1690–1697 CrossRef CAS PubMed.
- B. Y. Qu, B. Zhang, L. Wang, R. L. Zhou and X. C. Zeng, Chem. Mater., 2015, 27, 2195–2202 CrossRef CAS.
- S. K. Kandpal, B. Goundie, J. Wright, R. A. Pollock, M. D. Mason and R. W. Meulenberg, ACS Appl. Mater. Interfaces, 2011, 3, 3482–3486 CAS.
- J. Xu, Z. Ju, X. Gao, Y. An, X. Tang and W. Liu, Inorg. Chem., 2013, 52, 13875–13881 CrossRef CAS PubMed.
- X. Wang, F. Du, D. Wei, Y. Huang and H. J. Seo, Sens. Actuators, B, 2011, 158, 171–175 CrossRef CAS.
- C.-C. Kang, R.-S. Liu, J.-C. Chang and B.-J. Lee, Chem. Mater., 2003, 15, 3966–3968 CrossRef CAS.
- Y. Liu, B. Lei and C. Shi, Chem. Mater., 2005, 17, 2108–2113 CrossRef CAS.
- F. Liu, W. Yan, Y. J. Chuang, Z. Zhen, J. Xie and Z. Pan, Sci. Rep., 2013, 3, 1554 Search PubMed.
- T. Maldiney, A. Bessière, J. Seguin, E. Teston, S. K. Sharma, B. Viana, A. J. Bos, P. Dorenbos, M. Bessodes and D. Gourier, Nat. Mater., 2014, 13, 418–426 CrossRef CAS PubMed.
- J. Trojan-Piegza, J. Niittykoski, J. Hölsä and E. Zych, Chem. Mater., 2008, 20, 2252–2261 CrossRef CAS.
- L. C. V. Rodrigues, H. F. Brito, J. Hölsä, R. Stefani, M. C. F. C. Felinto, M. Lastusaari, T. Laamanen and L. A. O. Nunes, J. Phys. Chem. C, 2012, 116, 11232–11240 CAS.
- J. Wang, S. Wang and Q. Su, J. Mater. Chem., 2004, 14, 2569–2574 RSC.
- B. Lei, B. Li, X. Wang and W. Li, J. Lumin., 2006, 118, 173–178 CrossRef CAS.
- S. Ye, J. Zhang, X. Zhang, S. Lu, X. Ren and X.-j. Wang, J. Appl. Phys., 2007, 101, 063545 CrossRef.
- T. Maldiney, A. Lecointre, B. Viana, A. l. Bessière, M. Bessodes, D. Gourier, C. Richard and D. Scherman, J. Am. Chem. Soc., 2011, 133, 11810–11815 CrossRef CAS PubMed.
- D. Jia, R. Meltzer, W. Yen, W. Jia and X. Wang, Appl. Phys. Lett., 2002, 80, 1535–1537 CrossRef CAS.
- R. Zhong, J. Zhang, X. Zhang, S. Lu and X.-J. Wang, Appl. Phys. Lett., 2006, 88, 201916 CrossRef.
- X.-J. Wang, D. Jia and W. M. Yen, J. Lumin., 2003, 102, 34–37 CrossRef.
- A. Bessière, S. K. Sharma, N. Basavaraju, K. R. Priolkar, L. Binet, B. Viana, A. J. Bos, T. Maldiney, C. Richard and D. Scherman, Chem. Mater., 2014, 26, 1365–1373 CrossRef.
- Z. An, C. Zheng, Y. Tao, R. Chen, H. Shi, T. Chen, Z. Wang, H. Li, R. Deng and X. Liu, Nat. Mater., 2015, 14, 685–690 CrossRef CAS PubMed.
- Z. Pan, Y.-Y. Lu and F. Liu, Nat. Mater., 2012, 11, 58–63 CrossRef CAS PubMed.
- T. Aitasalo, J. Hölsä, H. Jungner, M. Lastusaari and J. Niittykoski, J. Phys. Chem. B, 2006, 110, 4589–4598 CrossRef CAS PubMed.
- F. Clabau, X. Rocquefelte, T. Le Mercier, P. Deniard, S. Jobic and M. H. Whangbo, Chem. Mater., 2006, 18, 3212–3220 CrossRef CAS.
- V. Bachmann, C. Ronda and A. Meijerink, Chem. Mater., 2009, 21, 2077–2084 CrossRef CAS.
- D. L. Dexter, J. Chem. Phys., 1953, 21, 836 CrossRef CAS.
- D. L. Andrews, Chem. Phys., 1989, 135, 195–201 CrossRef CAS.
- D. L. Andrews and D. S. Bradshaw, Eur. J. Phys., 2004, 25, 845 CrossRef.
- X. Shi, L. Shi, M. Li, J. Hou, L. Chen, C. Ye, W.-Z. Shen, L. Jiang and Y. Song, ACS Appl. Mater. Interfaces, 2014, 6, 6317–6321 CAS.
- Y. Zhuang, Y. Katayama, J. Ueda and S. Tanabe, Opt. Mater., 2014, 36, 1907–1912 CrossRef CAS.
- IMO Resolution A.752 (18) adopted on 4th Nov. 1993.
- F. Clabau, X. Rocquefelte, S. Jobic, P. Deniard, M.-H. Whangbo, A. Garcia and T. Le Mercier, Solid State Sci., 2007, 9, 608–612 CrossRef CAS.
- S. Lian, Y. Qi, C. Rong, L. Yu, A. Zhu, D. Yin and S. Liu, J. Phys. Chem. C, 2010, 114, 7196–7204 CAS.
- W. Zeng, Y. Wang, S. Han, W. Chen, G. Li, Y. Wang and Y. Wen, J. Mater. Chem. C, 2013, 1, 3004 RSC.
- Munsell Color Science Laboratory.
- T. Wang, W. Bian, D. Zhou, J. Qiu, X. Xu and X. Yu, J. Phys. Chem. C, 2015, 119, 14047–14055 CAS.
- V. Chandra and B. Chandra, J. Lumin., 2012, 132, 858–869 CrossRef CAS.
- J. Botterman, K. Van den Eeckhout, I. De Baere, D. Poelman and P. F. Smet, Acta Mater., 2012, 60, 5494–5500 CrossRef CAS.
- X. Xu, X. Yu, D. Zhou and J. Qiu, J. Solid State Chem., 2013, 206, 66–68 CrossRef CAS.
- R. Chen, J. Appl. Phys., 1969, 40, 570–585 CrossRef CAS.
Footnote |
| † Electronic supplementary information (ESI) available: Fig. S1 the typical XRD patterns of CaAl2O4:0.125%Eu2+,0.25%Nd3+, commercial Y3Al5O12:Ce3+ and the standard PDF cards of corresponding samples for comparison. Measurement errors of afterglow spectra. Fig. S3 the afterglow performance of CA/Sr3SiO5:Eu2+ composite. (a) Decay cure. (b) Afterglow spectrum. Inset: Photo of composite was taken at 5 min after the removal of excitation. Fig. S4 the afterglow spectrum of CA/red phosphor. Inset: Photo of composite was taken at 5 min after the removal of excitation. Fig. S5 shows the thermoluminescence (TL) curve of CA and YAG. Fig. S6 the LPL spectrum of CA with a 30 h decay time after 575 nm photostimulation. See DOI: 10.1039/c5nj02438b |
| This journal is © The Royal Society of Chemistry and the Centre National de la Recherche Scientifique 2016 |

