Transition metal phosphonates with supramolecular structures: syntheses, structures, surface photovoltage and luminescence properties†
Yan-Yu
Zhu
,
Mei-Ling
Wang
,
Ming-Xue
Ma
,
Zhen-Gang
Sun
*,
Cheng-Qi
Jiao
,
Chao
Ma
and
Huan-Yu
Li
School of Chemistry and Chemical Engineering, Liaoning Normal University, Dalian 116029, P. R. China. E-mail: szg188@163.com
First published on 12th November 2015
Abstract
Four new transition metal phosphonates with 2D and 3D supramolecular structures, namely [Cu2(1,10-phen)2(HL)2(L)]·H2L (1), [Zn(1,10-phen)(HL)2] (2), [M(1,10-phen)(HL)2(H2L)] (M = Mn (3), and Cd (4)) (H2L = phenylphosphonic acid, 1,10-phen = 1,10-phenanthroline), have been synthesized under hydrothermal conditions. In compound 1, two {CuN2O3} square pyramids and three {CPO3} tetrahedra are interconnected through phosphonate oxygen atoms to form a cluster unit via edge- and corner-sharing. Neighboring units are further assembled into a 3D supramolecular structure through π–π stacking and hydrogen bonding interactions. For compound 2, two {ZnO3N2} square pyramids and four {CPO3} tetrahedra are interconnected by phosphonate oxygen atoms to a cluster unit via corner-sharing. Then the adjacent clusters are further assembled into a 3D supramolecular structure through π–π stacking interactions. Compounds 3 and 4 are isomorphous and adopt a 2D supramolecular structure. The interconnection of {MO4N2} and {CPO3} polyhedra leads to a cluster unit through corner-sharing, and such units are further assembled into a 2D supramolecular structure by π–π stacking and hydrogen bonding interactions. The surface photovoltage properties of compounds 1 and 3 and luminescence properties of compounds 2 and 4 have been studied. The surface photovoltage spectra (SPS) and field-induced surface photovoltage spectra (FISPS) of compounds 1 and 3 indicate that they all possess certain photo-electric conversion properties and show p-type semiconductor characteristics. Luminescence properties of compounds 2 and 4 indicate that they may be candidates for potential luminescent materials.
Introduction
Supramolecular chemistry, beyond molecular chemistry, based on the self-assembly of molecular building blocks has received considerable interest mainly due to its fascinating structural properties and potential applications in ion exchanging, catalysis, medicine and materials chemistry.1In supramolecular materials, the molecular building blocks are self-organized via noncovalent interactions, such as intermolecular hydrogen-bonding, aromatic π–π stacking interactions, charge groups and non-bonding electronic repulsion, and these weaker intermolecular forces play a significant role in increasing the dimensionality of polymerization.2 As an important part of supramolecular chemistry, metal phosphonate compounds have also attracted much attention on account of their structural diversities and exhibit a wide range of unique properties.3 Therefore, the rational design and synthesis of novel metal phosphonates with intriguing supramolecular structures and practical properties have become a particularly important subject. An important and useful strategy of building new types of metal phosphonate hybrids with supramolecular structures is to introduce a second organic ligand such as oxalate, carboxylic acid, 2,2′-bipyridine, 4,4′-bipyridine, or 1,10-phenanthroline into the structures of metal phosphonates.4 In recent years, a number of transition metal phosphonates have been isolated, and the results from ours and other groups indicate that the introduction of a second organic ligand has been proved to be an effective synthetic method of transition metal phosphonates with new structure types and interesting properties.5 In view of photoelectric properties, phosphonic acids containing an aromatic ring may be useful ligands due to their rigidity and large π-conjugated system. During the past few years, a series of supramolecular compounds of copper with bi- and tridentate amines and phenylphosphonic acids have been reported by K. Latham et al.6 The phenylphosphonic acids in most of these compounds have been used in the context of intermolecular design in addition to the well known use of phosphonates in co-ordination networks. In this paper, we selected phenylphosphonic acid (H2L) as the phosphonate ligand and 1,10-phenanthroline as the second metal linker. Our research efforts resulted in four new transition metal phosphonates with 2D and 3D supramolecular structures, namely [Cu2(1,10-phen)2(HL)2(L)]·H2L (1), [Zn(1,10-phen)(HL)2] (2), [M(1,10-phen)(HL)2(H2L)] (M = Mn (3), and Cd (4)), and the surface photovoltage properties of compounds 1 and 3 and the luminescence properties of compounds 2 and 4 have also been studied. At present, research on the properties of transition metal phosphonates is mainly focused on magnetism, luminescence, proton conductivity, ion exchange, etc., and there are seldom reports on the surface photovoltage properties.7 Surface photovoltage spectroscopy (SPS) is a well-established contactless and nondestructive technique for the characterization of semiconductors or materials with semiconducting properties. SPS not only relates to the charge transition process under light inducement but also reflects directly the separation and transition of photogenerated charges.8 The energy gaps of some transition metal compounds are sometimes in the region of the gaps of semiconductors. This phenomenon means that they can show certain semiconductor characteristics and therefore be considered as a class of inorganic–organic hybrid semiconductors. The study of the electronic behavior of the valence shell and the photovoltaic performance of transition metal compounds will provide special references for further research on the functions of these compounds. Recently, only a few investigations on the surface photovoltage properties of metal phosphonates have been reported by our group.9 Herein we report the syntheses, crystal structures, surface photovoltage and luminescence properties of four title compounds.
Experimental
Materials and measurements
Phenylphosphonic acid was purchased from Shanghai Kaisai Chemical Co., Ltd. All chemicals were used as obtained without further purification. C, H and N content was determined by using a PE-2400 elemental analyzer. Cu, Zn, Mn, Cd and P content was determined by using an inductively coupled plasma (ICP) atomic absorption spectrometer. IR spectra were recorded on a Bruker AXS TENSOR-27 FT-IR spectrometer with KBr pellets in the range 4000–400 cm−1. The X-ray powder diffraction data were collected on a Bruker AXS D8 Advance diffractometer using Cu-Kα radiation (λ = 1.5418 Å) in the 2θ range of 5–60° with a step size of 0.02° and a scanning rate of 3° min−1. Thermogravimetric (TG) analyses were performed on a Perkin-Elmer Pyris Diamond TG-DTA thermal analyses system in static air with a heating rate of 10 K min−1 from 50 to 900 °C. The luminescence analyses were performed on a HITACHI F-7000 spectrofluorimeter. Surface photovoltage spectroscopy (SPS) and field-induced surface photovoltage spectroscopy (FISPS) measurements were conducted with the sample in a sandwich cell (ITO/sample/ITO) using the light source-monochromator-lock-in detection technique in the range of 300–600 nm.Syntheses
![[thin space (1/6-em)]](https://www.rsc.org/images/entities/char_2009.gif) :
:![[thin space (1/6-em)]](https://www.rsc.org/images/entities/char_2009.gif) 1,10-phen
1,10-phen![[thin space (1/6-em)]](https://www.rsc.org/images/entities/char_2009.gif) :
:![[thin space (1/6-em)]](https://www.rsc.org/images/entities/char_2009.gif) H2L = 1
H2L = 1![[thin space (1/6-em)]](https://www.rsc.org/images/entities/char_2009.gif) :
:![[thin space (1/6-em)]](https://www.rsc.org/images/entities/char_2009.gif) 1
1![[thin space (1/6-em)]](https://www.rsc.org/images/entities/char_2009.gif) :
:![[thin space (1/6-em)]](https://www.rsc.org/images/entities/char_2009.gif) 5 ratio at their original pH (T = 120 °C, 72 h). Our experiments demonstrated that the final reaction products synthesized from different copper salts exhibit different phases. CuCl2·2H2O (original pH = 3), Cu(Ac)2·H2O (original pH = 4) and Cu(NO3)2·3H2O (original pH = 2) acting as reactants synthesize amorphous powders. However, mixture phases (colorless crystals and powder) for compound 1 are obtained using CuSO4·5H2O (original pH = 2.5). So we realize that CuSO4·5H2O may be the more adaptable copper salt for use as the reactant to synthesize compound 1. In addition, the reaction temperature also has a strong effect on the formation of the compounds. To gain a better understanding of the influence of the reaction temperature, a second experiment was designed. The system using CuSO4·5H2O as the copper salt at different temperatures was studied. Larger crystals of compound 1 were obtained at the reaction temperature of 100 °C. However, the formation of amorphous powders or mixture phases for compound 1 comes into being at other temperatures. Compound 1 can also be obtained at 120 °C and 140 °C, but the quality is not good enough for single-crystal structure determination. The results of the two experimental investigations indicate that CuSO4·5H2O is the optimal copper salt to synthesize the pure phase of single crystals for compound 1 at a constant Cu2+
5 ratio at their original pH (T = 120 °C, 72 h). Our experiments demonstrated that the final reaction products synthesized from different copper salts exhibit different phases. CuCl2·2H2O (original pH = 3), Cu(Ac)2·H2O (original pH = 4) and Cu(NO3)2·3H2O (original pH = 2) acting as reactants synthesize amorphous powders. However, mixture phases (colorless crystals and powder) for compound 1 are obtained using CuSO4·5H2O (original pH = 2.5). So we realize that CuSO4·5H2O may be the more adaptable copper salt for use as the reactant to synthesize compound 1. In addition, the reaction temperature also has a strong effect on the formation of the compounds. To gain a better understanding of the influence of the reaction temperature, a second experiment was designed. The system using CuSO4·5H2O as the copper salt at different temperatures was studied. Larger crystals of compound 1 were obtained at the reaction temperature of 100 °C. However, the formation of amorphous powders or mixture phases for compound 1 comes into being at other temperatures. Compound 1 can also be obtained at 120 °C and 140 °C, but the quality is not good enough for single-crystal structure determination. The results of the two experimental investigations indicate that CuSO4·5H2O is the optimal copper salt to synthesize the pure phase of single crystals for compound 1 at a constant Cu2+![[thin space (1/6-em)]](https://www.rsc.org/images/entities/char_2009.gif) :
:![[thin space (1/6-em)]](https://www.rsc.org/images/entities/char_2009.gif) 1,10-phen
1,10-phen![[thin space (1/6-em)]](https://www.rsc.org/images/entities/char_2009.gif) :
:![[thin space (1/6-em)]](https://www.rsc.org/images/entities/char_2009.gif) H2L = 1
H2L = 1![[thin space (1/6-em)]](https://www.rsc.org/images/entities/char_2009.gif) :
:![[thin space (1/6-em)]](https://www.rsc.org/images/entities/char_2009.gif) 1
1![[thin space (1/6-em)]](https://www.rsc.org/images/entities/char_2009.gif) :
:![[thin space (1/6-em)]](https://www.rsc.org/images/entities/char_2009.gif) 5 ratio at the reaction temperature of 100 °C. Analogous experimental investigations were also designed to obtain the optimum method for synthesizing compounds 2–4. It is unnecessary to adjust the pH values of the reaction mixtures for the syntheses of these compounds. The powder XRD patterns and the simulated XRD patterns of the four compounds are shown in the ESI† (Fig. S1–S3). The diffraction peaks on the patterns correspond well in position, confirming that the four compounds are in the pure phase. The differences in reflection intensity are probably due to the preferred orientation in the powder samples.
5 ratio at the reaction temperature of 100 °C. Analogous experimental investigations were also designed to obtain the optimum method for synthesizing compounds 2–4. It is unnecessary to adjust the pH values of the reaction mixtures for the syntheses of these compounds. The powder XRD patterns and the simulated XRD patterns of the four compounds are shown in the ESI† (Fig. S1–S3). The diffraction peaks on the patterns correspond well in position, confirming that the four compounds are in the pure phase. The differences in reflection intensity are probably due to the preferred orientation in the powder samples.
X-Ray crystallography
Data collections for compounds 1–4 were performed on the Bruker AXS Smart APEX II CCD X-diffractometer equipped with graphite monochromated MoKα radiation (λ = 0.71073 Å). An empirical absorption correction was applied using the SADABS program. All structures were solved by direct methods and refined by full matrix least-squares fitting on F2 using SHELXL-2014/7.10 Anisotropic thermal parameters were applied to all non-hydrogen atoms. Hydrogen atoms of organic ligands were generated geometrically with fixed isotropic thermal parameters and included in the structure factor calculations. Details of crystallographic data of compounds 1–4 are summarized in Table 1. Hydrogen bonds for compounds 1, 3 and 4 are given in Table 2. Selected bond lengths and angles of compounds 1–4 are listed in Tables S1–S3 (ESI†). CCDC 1043125–1043128.| Compounds | 1 | 2 | 3 | 4 |
|---|---|---|---|---|
| R 1 = ∑(|Fo| − |FC|)/∑|Fo|, wR2 = [∑w(|Fo| − |FC|)2/∑wFo2]1/2. | ||||
| Chemical formula | C48H40N4O12P4Cu2 | C24H20N2O6P2Zn | C30H27N2O9P3Mn | C30H27N2O9P3Cd |
| Formula weight | 1115.80 | 559.75 | 707.39 | 764.84 |
| Crystal system | Triclinic | Triclinic | Monoclinic | Monoclinic |
| Space group |
P![[1 with combining macron]](https://www.rsc.org/images/entities/char_0031_0304.gif) |
P![[1 with combining macron]](https://www.rsc.org/images/entities/char_0031_0304.gif) |
P2(1)/c | P2(1)/c |
| a/Å | 12.1430(13) | 11.1636(6) | 13.0305(8) | 13.1419(6) |
| b/Å | 14.0076(14) | 11.3733(6) | 14.3151(9) | 14.4775(7) |
| c/Å | 14.3167(14) | 11.8809(6) | 17.8602(10) | 17.4996(8) |
| α/° | 107.833(2) | 105.5630(10) | 90 | 90 |
| β/° | 93.586(2) | 114.9730(10) | 111.826(4) | 110.4410(10) |
| γ/° | 92.363(2) | 103.1950(10) | 90 | 90 |
| V/Å3 | 2309.0(4) | 1212.38(11) | 3092.7(3) | 3119.9(3) |
| Z | 2 | 2 | 4 | 4 |
| D calc/g cm−3 | 1.605 | 1.533 | 1.519 | 1.628 |
| F(000) | 1140 | 572 | 1452 | 1544 |
| μ/mm−1 | 1.130 | 1.188 | 0.639 | 0.911 |
| θ range/deg | 1.499 to 26.499 | 2.020 to 26.499 | 1.683 to 26.498 | 1.654 to 26.498 |
| Reflections collected | 12![[thin space (1/6-em)]](https://www.rsc.org/images/entities/char_2009.gif) 935 935 |
7011 | 17![[thin space (1/6-em)]](https://www.rsc.org/images/entities/char_2009.gif) 508 508 |
17![[thin space (1/6-em)]](https://www.rsc.org/images/entities/char_2009.gif) 697 697 |
| Unique reflections | 9382 [Rint = 0.0245] | 4955 [Rint = 0.0131] | 6410 [Rint = 0.0235] | 6474 [Rint = 0.0252] |
| Completeness | 98.9% | 99.1% | 100.0% | 99.9% |
| Goodness of fit on F2 | 1.016 | 1.042 | 1.015 | 1.021 |
| R 1, wR2 [I > 2σ(I)] | 0.0475, 0.1204 | 0.0266, 0.0666 | 0.0321, 0.0813 | 0.0318, 0.0729 |
| R 1, wR2 (all data) | 0.0761, 0.1390 | 0.0319, 0.0698 | 0.0478, 0.0901 | 0.0444, 0.0804 |
| δρ max, δρmin/e Å−3 | 1.248, −0.524 | 0.340, −0.360 | 0.292, −0.279 | 0.604, −0.568 |
| D–H⋯A | D(D–H)/Å | d(H⋯A)/Å | D–H⋯A/° | d(D⋯A)/Å |
|---|---|---|---|---|
| Compound 1 | ||||
| O(3)–H(3)⋯O(12)#1 | 0.82 | 1.68 | 168.3 | 2.490(10) |
| O(3)–H(3)⋯O(12′)#1 | 0.82 | 1.72 | 134.2 | 2.371(10) |
| O(10)–H(10)⋯O(8)#2 | 0.82 | 1.66 | 157.7 | 2.435(14) |
| O(11)–H(11)⋯O(9)#2 | 0.82 | 1.85 | 164.5 | 2.652(15) |
| Symmetry transformations used to generate equivalent atoms: #1 −x + 1, −y, −z + 1; #2 −x + 1, −y + 1, −z + 1. | ||||
| Compound 3 | ||||
| O(3)–H(3)⋯O(2)#2 | 0.82 | 1.80 | 167.2 | 2.608(2) |
| Symmetry transformations used to generate equivalent atoms: #2 −x + 1, −y + 2, −z. | ||||
| Compound 4 | ||||
| O(3)–H(3A)⋯O(2)#2 | 0.82 | 1.79 | 163.4 | 2.589(3) |
| Symmetry transformations used to generate equivalent atoms: #2 −x + 1, −y + 2, −z. | ||||
Results and discussion
Description of the crystal structures
![[1 with combining macron]](https://www.rsc.org/images/entities/char_0031_0304.gif) (see Table 1). As shown in Fig. 1, each asymmetric unit contains two crystallographically unique Cu(II) ions, two HL− anions, one L2− anion, two 1,10-phen molecules and one free H2L molecule. Both Cu(II) ions hold {CuN2O3} square pyramid coordination geometries. Cu1 ion is five-coordinated by three phosphonate oxygen atoms (O1, O4, O7) from two HL− anions and one L2− anion, two nitrogen atoms (N1, N2) from one 1,10-phen molecule. The Cu2 ion is also five-coordinated by three phosphonate oxygen atoms (O1, O6, and O7) from two HL− anions and one L2− anion, two nitrogen atoms (N3, N4) from one 1,10-phen molecule. The bond lengths of Cu–O and Cu–N are in the range of 1.907(2)–2.296(2) Å and 1.999(3)–2.027(3) Å, respectively (Table S1, ESI†), which are comparable to those reported for other copper(II) phosphonates.11 The coordination modes of the three phosphonic acid ligands can be described as bidentate bridging modes (Fig. 2a–c). The phosphonate oxygen atoms (O3 and O9) of HL− anions are protonated based on the requirement of charge balance.
(see Table 1). As shown in Fig. 1, each asymmetric unit contains two crystallographically unique Cu(II) ions, two HL− anions, one L2− anion, two 1,10-phen molecules and one free H2L molecule. Both Cu(II) ions hold {CuN2O3} square pyramid coordination geometries. Cu1 ion is five-coordinated by three phosphonate oxygen atoms (O1, O4, O7) from two HL− anions and one L2− anion, two nitrogen atoms (N1, N2) from one 1,10-phen molecule. The Cu2 ion is also five-coordinated by three phosphonate oxygen atoms (O1, O6, and O7) from two HL− anions and one L2− anion, two nitrogen atoms (N3, N4) from one 1,10-phen molecule. The bond lengths of Cu–O and Cu–N are in the range of 1.907(2)–2.296(2) Å and 1.999(3)–2.027(3) Å, respectively (Table S1, ESI†), which are comparable to those reported for other copper(II) phosphonates.11 The coordination modes of the three phosphonic acid ligands can be described as bidentate bridging modes (Fig. 2a–c). The phosphonate oxygen atoms (O3 and O9) of HL− anions are protonated based on the requirement of charge balance.
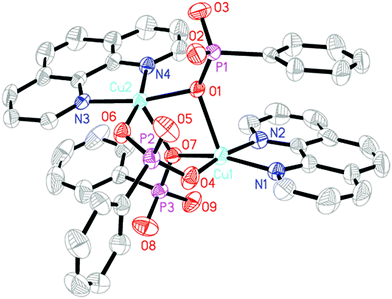 | ||
| Fig. 1 Structural unit of compound 1 showing atom labeling. Thermal ellipsoids are shown at the 50% probability level. All H atoms and the free H2L molecule are omitted for clarity. | ||
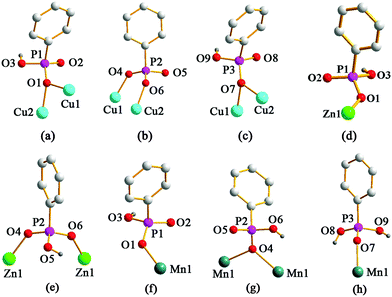 | ||
| Fig. 2 The coordination modes of phophonate ligands in compound 1 (a)–(c); compound 2 (d) and (e); compound 3 (f)–(h). | ||
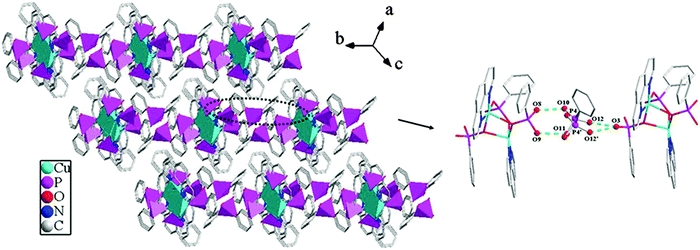
The overall structure of compound 1 can be described as a 3D supramolecular structure. As shown in Fig. 3, each {CPO3} tetrahedron connects two {CuN2O3} square pyramids through phosphonate oxygen atoms, and the {CuN2O3} square pyramids are interconnected by {CPO3} tetrahedra via edge- and corner-sharing to form a [Cu2(1,10-phen)2(HL)2(L)] cluster unit. Such neighboring units are assembled into a 2D layer through π–π stacking interactions. The π–π stacking interactions can play an important role in controlling the packing or assembly of compounds. The usual π interaction is an offset or slipped stacking of the aromatic nitrogen heterocycles or benzene rings, and the effective distance is about 3.3–3.8 Å.12 In compound 1, the 1,10-phen rings between the neighboring units are parallel to each other, and the face-to-face distances (3.68 Å and 3.65 Å) between adjacent 1,10-phen rings are in the normal range for such interactions; hence the units are connected through π–π stacking interactions to form a 1D chain. Meanwhile, the chains are assembled into a 2D supramolecular layer through π–π stacking interactions between the adjacent benzene rings with the face-to-face distance of 3.73 Å. The free phenylphosphonate molecules are located between the units. The phosphorus atom (P4) and the phosphonate oxygen atoms (O10, O11 and O12) in the free phenylphosphonate molecule appeared to be disordered over two sites (occupancies 0.6 and 0.4) respectively. There are four types of hydrogen bonds between the free phenylphosphonate oxygen atoms and the uncoordinated phosphonate oxygen atoms. The O⋯O distances are 2.490(10), 2.371(10), 2.435(14) and 2.652(15) Å for O(3)–H(3)⋯O(12)#1, O(3)–H(3)⋯O(12′)#1, O(10)–H(10)⋯O(8)#2 and O(11)–H(11)⋯O(9)#2, respectively. The interactions contribute in forming a 3D supramolecular structure (see Fig. 4 and Table 2)
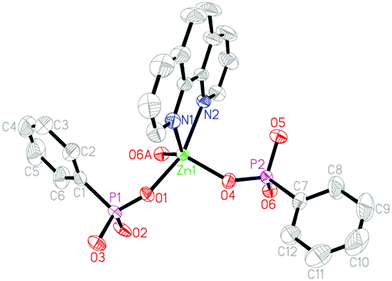
![[1 with combining macron]](https://www.rsc.org/images/entities/char_0031_0304.gif) (see Table 1). The asymmetric unit contains one Zn(II) ion, two HL− anions and one 1,10-phen molecule (Fig. 5). Zn1 ion is five-coordinated to give a {ZnO3N2} square pyramid coordination geometry. Three of the five coordination positions are filled with three phosphonate oxygen atoms (O1, O4, O6A) from three HL− anions. The remaining sites are occupied by two nitrogen atoms (N1, N2) from one 1,10-phen molecule. The Zn–O [1.9599(13)–2.0326(13) Å] and Zn–N [2.1241(16)–2.2143(16) Å] distances are comparable to those in other reported zinc(II) phosphonates (Table S2, ESI†).13 One of the phosphonic acid ligands acts as a monodentate ligand and another acts as a bidentate ligand (Fig. 2d and e). Based on the charge balance, the phosphonate oxygen atoms (O3 and O5) in HL− anions are protonated.
(see Table 1). The asymmetric unit contains one Zn(II) ion, two HL− anions and one 1,10-phen molecule (Fig. 5). Zn1 ion is five-coordinated to give a {ZnO3N2} square pyramid coordination geometry. Three of the five coordination positions are filled with three phosphonate oxygen atoms (O1, O4, O6A) from three HL− anions. The remaining sites are occupied by two nitrogen atoms (N1, N2) from one 1,10-phen molecule. The Zn–O [1.9599(13)–2.0326(13) Å] and Zn–N [2.1241(16)–2.2143(16) Å] distances are comparable to those in other reported zinc(II) phosphonates (Table S2, ESI†).13 One of the phosphonic acid ligands acts as a monodentate ligand and another acts as a bidentate ligand (Fig. 2d and e). Based on the charge balance, the phosphonate oxygen atoms (O3 and O5) in HL− anions are protonated.
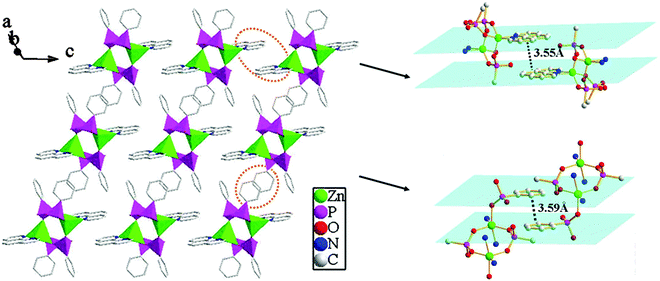
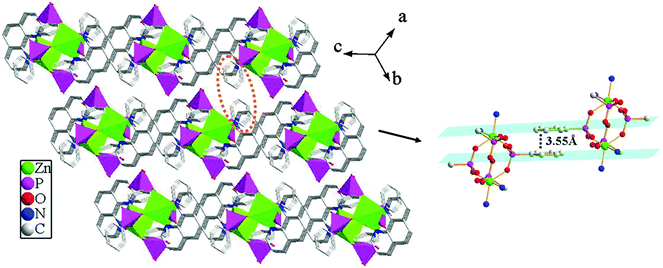
Compound 2 shows a 3D supramolecular network. As shown in Fig. 6, two {ZnO3N2} polyhedra are interconnected by four {CPO3} tetrahedra through phosphonate oxygen atoms to form a [Zn2(1,10-phen)2(HL)4] cluster unit via corner-sharing. These neighboring units are further connected through π–π stacking interactions to result in a 2D supramolecular layer in the ac-plane. The average face-to-face distances of the aromatic units are about 3.55 Å (between the adjacent 1,10-phen rings) and 3.59 Å (between the adjacent benzene rings), which are within the range of π–π stacking interactions (3.3–3.8 Å), hence there exist π–π stacking interactions. Meanwhile, the neighboring layers are further assembled into a 3D supramolecular structure through π–π stacking interactions between the adjacent benzene rings with the face-to-face distance of 3.55 Å (Fig. 7).
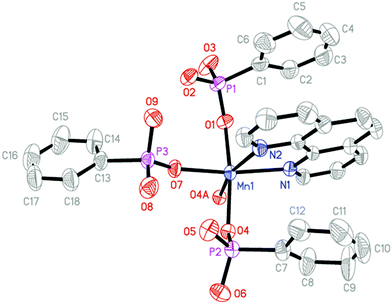
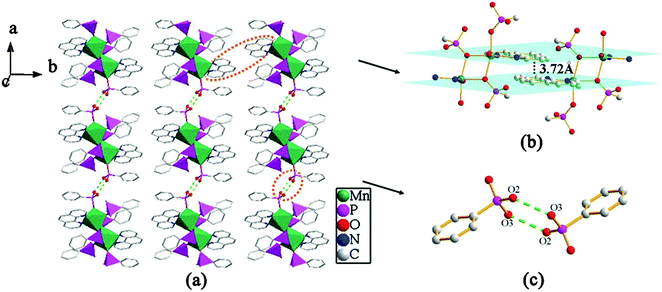
The overall structure of compound 3 can be described as a 2D supramolecular structure. As shown in Fig. 9, two {MnO4N2} polyhedra and six {CPO3} tetrahedra are linked through phosphonate oxygen atoms via edge- and corner-sharing to form a [Mn2(1,10-phen)2(HL)4(H2L)2] cluster unit. The neighboring units are assembled into a 1D chain along the b-axis through π–π stacking interactions with the average face-to-face distance between the aromatic units (phen) of 3.72 Å. These neighboring chains are further connected through hydrogen bonding interactions to give rise to a 2D supramolecular structure. There are hydrogen bonds between the uncoordinated phosphonate oxygen atoms (O2 and O3) with a distance of 2.608(2) Å (O3–H3⋯O2#2) and a corresponding angle of 167.2° (symmetry transformations used to generate equivalent atoms: #2 −x + 1, −y + 2, −z) (Table 2).
IR spectra
The IR spectra of compounds 1–4 are recorded in the region of 4000–400 cm−1 (Fig. S4–S6, ESI†). Compounds 3 and 4 are isostructural, they have many similar features corresponding to their common groups. Thus only the IR spectra of compounds 1–3 will be discussed. The C–H stretching vibrations are observed as sharp, weak bands close to 3000 cm−1 for compounds 1–3. Absorption bands at 1588, 1517 and 1442 cm−1 for 1, 1582, 1517 and 1432 cm−1 for 2, and 1591, 1519 and 1426 cm−1 for 3 can be attributed to the stretching bands of the 1,10-phenanthroline ligands.15 The bands at 750 and 699 cm−1 for 1, 750, 727 and 699 cm−1 for 2 and 752, 726 and 693 cm−1 for 3 are due to the out-of-plane CH vibrations of C6H5, and are characteristic of phenylphosphonates in general.16 Strong bands between 1200 and 900 cm−1 for three compounds are due to the stretching vibrations of the tetrahedral {CPO3} groups, as expected.17 Additional medium and weak bands at low energies for compounds 1–3 are found, which are likely assigned to the bending vibrations of the tetrahedral {CPO3} groups.Thermal analysis
In order to examine the thermal stabilities of compounds 1–4, thermogravimetric analyses were performed in the temperature range of 50–900 °C in a static air atmosphere (Fig. S7–S10, ESI†). Compound 1 was thermally stable up to a high temperature of 270 °C. Above this temperature, the TG curve shows three main continuous weight losses. At approximately 300 °C, it completes its first step of weight loss, corresponding to the partial decomposition of the free phenylphosphonate molecule. A second weight loss occurs between 352 and 530 °C, which can be attributed to the further decomposition of the free phenylphosphonate molecule, the partial decomposition of the organic moieties and the collapse of the structures. The third stage occurring between 530 and 790 °C corresponds to the further decomposition of the compound. The total weight loss of 59.5% is almost consistent with the calculated value (60.3%) if the final products are assumed to be Cu(PO3)2.We try to confirm the supposition by PXRD, but the final residues are unidentified because they are amorphous. The TG curve of compound 2 reveals two main steps of weight losses. The first step exhibits a continuous and complicated weight loss between 272 °C and 608 °C, which can be attributed to the combustion of organic groups and the collapse of the structures. The second step, from 608 to 825 °C, corresponds to the further decomposition of the compound. The final product was not characterized because they are amorphous. The total weight loss of 63.5% is basically consistent with the calculated value (60.1%) if the final products are assumed to be Zn(PO3)2. The TG curve of compound 3 exhibits a main continuous weight loss in the temperature range 192–725 °C, which can be attributed to the elimination of the organic moieties and the collapse of the structures. The final product of the thermal process is Mn(PO3)2 (JCPDS 00-029-0892) on the basis of powder X-ray diffraction (Fig. S11, ESI†). The total weight loss of 63.6% is smaller than the calculated value (69.9%), because of an amorphous product (black glassy carbon) existing at the same time. Compound 4 exhibits a continuous and complicated weight loss in the temperature range 215–800 °C, which corresponds to the pyrolysis of the organic moieties and the collapse of the structures. For compound 4, the final product of the thermal decomposition is amorphous and was not further characterized. The total weight loss of 61.4% is basically close to the calculated value (64.6%) if the final product is assumed to be Cd(PO3)2 at 800 °C.To further understand the thermal stability of these compounds, X-ray powder diffraction studies were performed for the as-synthesized compounds and the samples were heated to 160–300 °C for compound 1, 140–280 °C for compound 2, 140–230 °C for compound 3 and 140–210 °C for compound 4 for 2 h. As shown in Fig. 10, the powder XRD patterns demonstrate the retention of the framework structure of compound 1 below 260 °C. For compound 2, the pattern changes when the temperature reaches 280 °C, which indicates that the structure of compound 2 was thermally stable below 260 °C. The powder XRD patterns of compounds 3 and 4 show as the framework remains stable at 220 and 200 °C. It is obvious that the results of X-ray powder diffraction studies for compounds 1–4 basically correspond to thermogravimetric analyses.
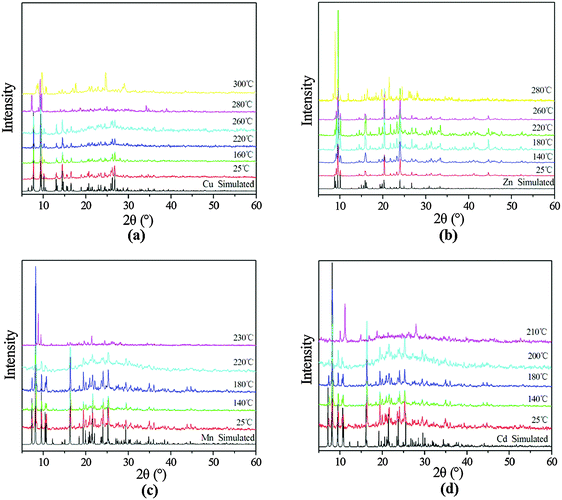 | ||
| Fig. 10 PXRD patterns for (a) 1 upon heating from 25 to 300 °C, (b) 2 upon heating from 25 to 280 °C, (c) 3 upon heating from 25 to 230 °C and (d) 4 upon heating from 25 to 210 °C. | ||
Surface photovoltage properties
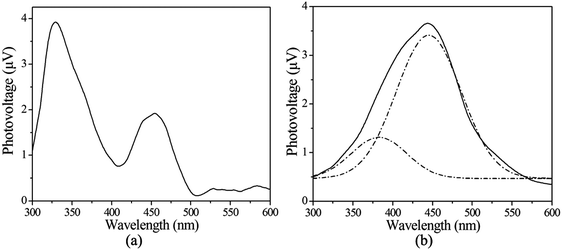
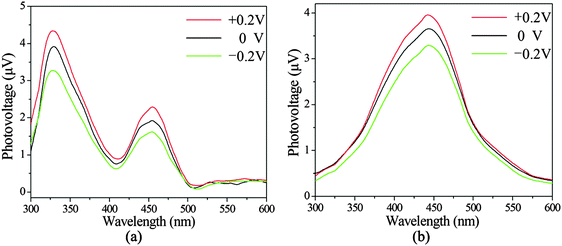
In order to continue with exploring the functional properties of the compounds, surface photovoltage spectra (SPS) are a well-established contactless and nondestructive technique for the characterization of materials. The principle and the scheme are described elsewhere.18,19 The SPS spectra of compounds 1 and 3 were recorded in the range of 300–600 nm (Fig. 11). They all appear as positive surface photovoltage (SPV) response bands between 300 and 600 nm. Compound 1 presents two positive SPV responses at 329 and 454 nm (Fig. 11a), and they are assigned to the LMCT (from ligand-to-metal charge transfer) transition. For compound 3, it can be seen that the SPS signal is a wide peak. The signal is actually the result of overlap of several SPV response bands. To make the assignment of each SPV response band clear, we separated them using the Origin 7.0 program. Compound 3 presents two positive SPV responses at 375 and 445 nm (Fig. 11b). The two response bands are assigned to the LMCT (from ligand-to-metal charge transfer) transition.On the basis of the principle of SPS, Dr Wang's group developed a field-induced surface photovoltage technique.19,20 Field-induced surface photovoltage spectroscopy (FISPS) can be measured by applying an external electric field to the sample with a transparent electrode. If a positive electric field is vertically applied on a p-type semiconductor surface, the SPV response increases since the external field is consistent with the built-in field. In contrast, when a negative electric field is applied, the SPV response is weakened. In contrast to p-type semiconductors, the SPV response intensity of n-type semiconductors increases as a negative field is applied and reduces as a positive electric field is applied. Fig. 12 shows the FISPS of compounds 1 and 3 in the range of 300–600 nm when the external electric fields are −0.2, 0, and +0.2 V, respectively. The SPV response intensities of the two compounds all increase with the application of a positive electric field and reduce with the application of a negative electric field. This is attributed to the positive electric field being beneficial to the separation of photoexcited electron–hole pairs, which in turn results in an increase of response intensity; however, the negative electric field has just the opposite effect. The FISPS confirm that compounds 1 and 3 show p-type semiconductor characteristics.
The surface photovoltage spectra (SPS) and field-induced surface photovoltage spectra (FISPS) of compounds 1 and 3 indicate that they all possess certain photo-electric conversion properties and show p-type semiconductor characteristics. These results show that compounds 1 and 3 may be applied as potential inorganic–organic hybrid semiconductor functional materials in the future.
Luminescence properties
In recent years, luminescent materials with d10 metal centres have attracted much attention due to their potential applications in many fields, such as photochemistry, chemical sensors, and electroluminescent displays.21 Therefore, the solid-state luminescence properties of the free H2L ligand, 1,10-phen ligand and compounds 2 and 4 were investigated at room temperature.The free H2L ligand exhibits an emission band at 400 nm upon excitation at 290 nm, which displays very weak luminescence in the solid state at room temperature (Fig. S12, ESI†). As shown in Fig. 13, the free 1,10-phen ligand displays luminescence with two emission maxima at 364 nm and 381 nm (λex = 280 nm). The spectra of compounds 2 and 4 are similar to the free 1,10-phen ligand, with a slight red-shift effect, showing the maxima at 368 nm and 384 nm for 2, and 365 nm and 381 nm for 4 respectively (λex = 280 nm). Because the Zn(II) ions and Cd(II) ions are difficult to oxidize or to reduce, the emissions of these compounds are neither MLCT nor LMCT.22,23 These emission spectra of compounds 2 and 4 can probably be attributed to an intraligand π–π* transitions of the phenanthroline ligand, as reported for other zinc(II) and cadmium(II) phosphonates containing an N-donor second ligand such as 4,4′-bipy or 1,10-phen.23–25 Moreover, it is clear that a significant enhancement in intensity occurs in compound 2, while compound 4 shows a slightly weakened intensity. The luminescence intensity of compound 2 is stronger than that of compound 4, which is probably due to the differences in the metal ions. The density of the electron cloud for oxygen atoms is closely associated with the coordination of the metal ions.26 Unfortunately, the luminescence lifetimes of compounds 2 and 4 are not observed, since the lifetimes of compounds 2 and 4 are too short to be measured.
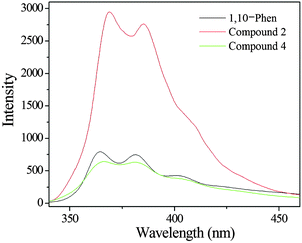 | ||
| Fig. 13 Solid-state emission spectra of 1,10-phen (black line), compound 2 (red line) and compound 4 (green line) at room temperature. | ||
Under similar measurement conditions, the luminescence intensity of compound 2 is more than 3 times larger than that of the free 1,10-phen ligand which can be attributed to the chelation of the 1,10-phen ligand to the metal centre, which effectively increases its rigidity and asymmetry and reduces the loss of energy by radiationless decay.25,27 The results indicate that the use of the second ligand (1,10-phen) may be an effective way to prepare luminescent materials.
Conclusions
In this paper, four new transition metal phosphonates with 2D and 3D supramolecular structures, namely [Cu2(1,10-phen)2(HL)2(L)]·H2L (1), [Zn(1,10-phen)(HL)2] (2), [M(1,10-phen)(HL)2(H2L)] (M = Mn (3), and Cd (4)), have been synthesized under hydrothermal conditions. In compound 1, two {CuN2O3} square pyramids and three {CPO3} tetrahedra are interconnected through phosphonate oxygen atoms to form a cluster unit via edge- and corner-sharing. Neighboring units are further assembled into a 3D supramolecular structure through π–π stacking and hydrogen bonding interactions. For compound 2, two {ZnO3N2} square pyramids and four {CPO3} tetrahedra are interconnected by phosphonate oxygen atoms to a cluster unit via corner-sharing. Then the adjacent clusters are further assembled into a 3D supramolecular structure through π–π stacking interactions. Compounds 3 and 4 are isomorphous and adopt a 2D supramolecular structure. The interconnection of {MO4N2} and {CPO3} polyhedra leads to a cluster unit through corner-sharing, and such units are further assembled into a 2D supramolecular structure by π–π stacking and hydrogen bonding interactions. The SPS and FISPS of compounds 1 and 3 indicate that they exhibit certain photo-electric conversion properties and show p-type semiconductor characteristics. These results show that compounds 1 and 3 may be applied as potential inorganic–organic hybrid semiconductor functional materials in the future. The luminescence properties of compounds 2 and 4 indicate that the use of the second ligand (1,10-phen) may be an effective way to prepare luminescent materials and compounds 2 and 4 may be candidates for use as potential luminescent materials.Acknowledgements
This work was supported by the National Natural Science Foundation of China (Grant No. 21371085).Notes and references
- Y. Z. Zhang, P. Ferko, D. Siretanu, R. Ababei, N. P. Rath, M. J. Shaw, R. Clérac, C. Mathonière and S. M. Holmes, J. Am. Chem. Soc., 2014, 136, 16854 CrossRef CAS PubMed; S. S. Hu, J. Y. Li, J. F. Xiang, J. Pan, S. Z. Luo and J. P. Cheng, J. Am. Chem. Soc., 2010, 132, 7216 CrossRef PubMed; D. W. Xu, L. H. Jiang, A. Singh, D. Dustin, M. Yang, L. Liu, R. Lund, T. J. Sellati and H. Dong, Chem. Commun., 2015, 51, 1289 RSC; V. Ramamurthy and S. Gupta, Chem. Soc. Rev., 2015, 44, 119 RSC; J. Voskuhl, S. Sankaran and P. Jonkheijm, Chem. Commun., 2014, 50, 15144 RSC.
- N. Vallavoju and J. Sivaguru, Chem. Soc. Rev., 2014, 43, 4084 RSC; Y. S. Ma, X. Y. Tang, W. Y. Yin, B. Wu, F. F. Xue, R. X. Yuan and S. Roy, Dalton Trans., 2012, 41, 2340 RSC; X. P. Yang, B. P. Hahn, R. A. Jones, W. K. Wong and K. J. Stevenson, Inorg. Chem., 2007, 46, 7050 CrossRef CAS PubMed; P. Yang, J. J. Wu, H. Y. Zhou and B. H. Ye, Cryst. Growth Des., 2012, 12, 99 Search PubMed.
- A. Clearfield and K. Demadis, Metal Phosphonate Chemistry: From Synthesis to Applications, Royal Society of Chemistry, Oxford, 2012, p. 164 RSC; F. P. Zhai, Q. S. Zheng, Z. X. Chen, Y. Ling, X. F. Liu, L. H. Weng and Y. M. Zhou, CrystEngComm, 2013, 15, 2040 RSC; L. H. Schilling and N. Stock, Dalton Trans., 2014, 43, 414 RSC; S. F. Tang, L. J. Li, X. X. Lv, C. Wang and X. B. Zhao, CrystEngComm, 2014, 16, 7043 RSC.
- Z. Y. Du, H. B. Xu, X. L. Li and J. G. Mao, Eur. J. Inorg. Chem., 2007, 4520 CrossRef CAS; K. D. Demadis, A. Panera, Z. Anagnostou, D. Varouhas, A. M. Kirillov and I. Císařová, Cryst. Growth Des., 2013, 13, 4480 Search PubMed; M. Taddei, F. Costantino, R. Vivani, C. Sangregorio, L. Sorace and L. Castelli, Cryst. Growth Des., 2012, 12, 2327 Search PubMed; T. T. Wang, M. Ren, S. S. Bao, B. Liu, L. Pi, Z. S. Cai, Z. H. Zheng, Z. L. Xu and L. M. Zheng, Inorg. Chem., 2014, 53, 3117 CrossRef PubMed.
- A. Bulut, Y. Zorlu, R. Topkaya, B. Aktaş, S. Doğan, H. Kurt and G. Yücesan, Dalton Trans., 2015, 44, 12526 RSC; F. Tong, Z. G. Sun, K. Chen, Y. Y. Zhu, W. N. Wang, C. Q. Jiao, C. L. Wang and C. Li, Dalton Trans., 2011, 40, 5059 RSC; M. J. Zheng, Y. Y. Zhu, Z. G. Sun, J. Zhu, C. Q. Jiao, W. Chu, S. H. Sun and H. Tian, CrystEngComm, 2013, 15, 1445 RSC.
- R. Clarke, K. Latham, C. Rix, M. Hobday and J. White, CrystEngComm, 2004, 6, 42 RSC; K. Latham, A. M. Coyle, C. J. Rix, A. Fowless and J. M. White, Polyhedron, 2007, 26, 222 CrossRef CAS; K. Latham, K. F. White, K. B. Szpakolski, C. J. Rix and J. M. White, Inorg. Chim. Acta, 2009, 362, 1872 CrossRef.
- V. Chandrasekhar, J. Goura and E. C. Sañudo, Inorg. Chem., 2012, 51, 8479 CrossRef CAS PubMed; J. A. Sheikh, A. Adhikary, H. S. Jena, S. Biswas and S. Konar, Inorg. Chem., 2014, 53, 1606 CrossRef PubMed; B. K. Tripuramallu, S. Mukherjeeand and S. K. Das, Cryst. Growth Des., 2012, 12, 5579 Search PubMed.
- L. Kronik and Y. Shapira, Surf. Sci. Rep., 1999, 37, 1 CrossRef CAS; Y. Zidon, Y. Shapira, H. Shaim and T. Dittrich, Appl. Surf. Sci., 2008, 254, 3255 CrossRef.
- C. Li, C. Q. Jiao, Z. G. Sun, K. Chen, C. L. Wang, Y. Y. Zhu, J. Zhu, Y. Zhao, M. J. Zheng, S. H. Sun, W. Chu and H. Tian, CrystEngComm, 2012, 14, 5479 RSC; S. H. Sun, Z. G. Sun, Y. Y. Zhu, D. P. Dong, C. Q. Jiao, J. Zhu, J. Li, W. Chu, H. Tian, M. J. Zheng, W. Y. Shao and Y. F. Lu, Cryst. Growth Des., 2013, 13, 226 Search PubMed; D. P. Dong, Z. G. Sun, F. Tong, Y. Y. Zhu, K. Chen, C. Q. Jiao, C. L. Wang, C. Li and W. N. Wang, CrystEngComm, 2011, 13, 3317 RSC.
- G. M. Sheldrick, Acta Crystallogr., Sect. A: Found. Crystallogr., 2008, 64, 112 CrossRef CAS PubMed.
- S. Ushak, E. Spodine, E. L. Fur, D. Venegas-Yazigi, J.-Y. Pivan, W. Schnelle, R. Cardoso-Gil and R. Kniep, Inorg. Chem., 2006, 45, 5393 CrossRef CAS PubMed.
- C. Janiak, J. Chem. Soc., Dalton Trans., 2000, 3885 RSC; W. Zhou, Y. Y. Zhu, C. Q. Jiao, Z. G. Sun, S. P. Shi, L. L. Dai, T. Sun, W. Z. Li, M. X. Ma and H. Luo, CrystEngComm, 2014, 16, 1174 RSC.
- R. B. Fu, S. M. Hu and X. T. Wu, CrystEngComm, 2013, 15, 8937 RSC.
- Z. Y. Du, A. V. Prosvirin and J. G. Mao, Inorg. Chem., 2007, 46, 9884 CrossRef CAS PubMed.
- L. L. Dai, Y. Y. Zhu, C. Q. Jiao, Z. G. Sun, S. P. Shi, W. Zhou, W. Z. Li, T. Sun, H. Luo and M. X. Ma, CrystEngComm, 2014, 14, 5050 RSC.
- R. C. Clarke, K. Latham, C. J. Rix and M. Hobday, Chem. Mater., 2004, 16, 2463 CrossRef CAS; K. P. Rao and K. Vidyasagar, Eur. J. Inorg. Chem., 2005, 4936 CrossRef.
- A. Cabeza, X. Ouyang, C. V. K. Sharma, M. A. G. Aranda, S. Bruque and A. Clearfield, Inorg. Chem., 2002, 41, 2325 CrossRef CAS PubMed.
- J. Zhang, D. J. Wang, Y. M. Chen, T. J. Li, H. F. Mao, H. J. Tian, Q. F. Zhou and H. J. Xu, Thin Solid Films, 1997, 300, 208 CrossRef CAS; L. Q. Jing, X. J. Sun, J. Shang, W. M. Cai, Z. L. Xu, Y. G. Du and H. G. Fu, Sol. Energy Mater. Sol. Cells, 2003, 97, 133 Search PubMed.
- Y. H. Lin, D. J. Wang, Q. D. Zhao, M. Yang and Q. L. Zhang, J. Phys. Chem. B, 2004, 108, 3202 CrossRef CAS.
- D. J. Wang, J. Zhang, T. S. Shi, B. H. Wang, X. Z. Cao and T. J. Li, J. Photochem. Photobiol., A, 1996, 93, 21 CrossRef CAS.
- J. E. McGarrah, Y. J. Kim, M. Hissler and R. Eisenberg, Inorg. Chem., 2001, 40, 4510 CrossRef CAS PubMed; B. An, R. Zhou, D. Dang, J. Wang, H. Pan and Y. Bai, Spectrochim. Acta, Part A, 2014, 122, 392 CrossRef PubMed; M. Zhang, Y. Ren and X. Chen, J. Mol. Struct., 2014, 1075, 7 CrossRef.
- L. F. Ma, C. P. Li, L. Y. Wang and M. Du, Cryst. Growth Des., 2010, 10, 2641 CAS.
- W. Q. Kan, J. F. Ma, Y. Y. Liu, J. Yang and B. Liu, CrystEngComm, 2012, 14, 2268 RSC.
- J. L. Song, H. H. Zhao, J. G. Mao and K. R. Dunbar, Chem. Mater., 2004, 16, 1884 CrossRef CAS.
- E. Fernández-Zapico, J. Montejo-Bernardo, A. Fernández-González, J. R. García and S. García-Granda, J. Solid State Chem., 2015, 225, 285 CrossRef.
- H. Y. Wang, S. Gao, L. H. Huo, S. W. Ng and J. G. Zhao, Cryst. Growth Des., 2008, 8, 665 CAS.
- S. Wang, Coord. Chem. Rev., 2001, 215, 79 CrossRef CAS.
Footnote |
| † Electronic supplementary information (ESI) available. CCDC 1043125–1043128. For ESI and crystallographic data in CIF or other electronic format see DOI: 10.1039/c5nj02417j |
| This journal is © The Royal Society of Chemistry and the Centre National de la Recherche Scientifique 2016 |


