Ti–Sn–O composite oxides coated with N-doped carbon exhibiting enhanced lithium storage performance†
Liu-Xia
Zhang
a,
Tao
Li
a,
Rui-Lin
Bai
b,
Yong-Xin
Qi
a,
Ning
Lun
*a and
Yu-Jun
Bai
*a
aKey Laboratory for Liquid–Solid Structural Evolution and Processing of Materials (Ministry of Education), Shandong University, Jinan 250061, People's Republic of China. E-mail: byj97@126.com; lunning66@sdu.edu.cn; Fax: +86 531 88392315; Tel: +86 531 88392315
bShandong Experimental High School, Jinan 250001, People's Republic of China
First published on 30th October 2015
Abstract
The composite oxides of TiO2 and SnO2 (Ti–Sn–O) were fabricated by a simple precipitation method, followed by sintering at 400 °C and coating with N-doped carbon at 550 °C using pyridine as the carbon source. The carbon-coated composite with a Ti/Sn molar ratio of 1.7![[thin space (1/6-em)]](https://www.rsc.org/images/entities/char_2009.gif) :
:![[thin space (1/6-em)]](https://www.rsc.org/images/entities/char_2009.gif) 0.3 used as anode materials for lithium ion batteries could deliver a reversible capacity of 629 mA h g−1 after cycling 300 times at a current density of 100 mA g−1, and a capacity of 289 mA h g−1 when cycling 300 times at 500 mA g−1. The outstanding cycling performance and high-rate performance result from the uniform N-doped carbon coating around the mutually dispersed TiO2 and SnO2 nanoparticles.
0.3 used as anode materials for lithium ion batteries could deliver a reversible capacity of 629 mA h g−1 after cycling 300 times at a current density of 100 mA g−1, and a capacity of 289 mA h g−1 when cycling 300 times at 500 mA g−1. The outstanding cycling performance and high-rate performance result from the uniform N-doped carbon coating around the mutually dispersed TiO2 and SnO2 nanoparticles.
1. Introduction
TiO2 and SnO2 are two common oxides with high abundance, low cost, environmental friendliness and easy availability. TiO2 has several polymorphs, such as anatase TiO2, rutile TiO2 and TiO2–B (a monoclinic metastable phase of TiO2), which reveal different electrochemical performances used as anode materials for Li-ion batteries (LIBs). Anatase TiO2 exhibits a stable voltage window during Li-ion insertion/extraction, good cycling and rate performance, making it a promising anode material for high-power LIBs. Though the theoretical capacity of the anatase TiO2 is 335 mA h g−1, the practical capacity is only 168 mA h g−1, corresponding to 0.5 mol Ti per molar TiO2 taking part in the electrochemical reaction,1,2 SnO2 utilized as anode materials demonstrates a theoretical capacity as high as 790 mA h g−1, however the capacity fades rapidly during cycling, and the rate capabilities are usually poor. Combining the priority of the two oxides in electrochemical performance, the composite oxides of TiO2 and SnO2 (Ti–Sn–O) have recently attracted increasing interest.1–13 Nanocrystalline Ti2/3Sn1/3O2 displayed a reversible capacity of 300 mA h g−1 cycled at 0.05 C between 0.02 and 3.0 V, and a faster cycling leads to the rapid decrease in capacity.13 Rutile-type (Ti,Sn)O2 solid solutions with nanorod architecture retained a specific capacity of about 300 mA h g−1 at the current density of 30 mA g−1 and showed minimal capacity fading even at 3000 mA g−1.4 TiO2 doped with 5% Sn exhibited a reversible capacity of 198 mA h g−1 in a potential range from 1.2 to 2.5 V (vs. Li/Li+).5 Rutile-type TixSn1−xO2 (x = 0–0.79) solid solutions delivered a constant lithium storage capacity corresponding to ca. 0.35 mol Li/mol at 100 mA g−1 in the potential range of 1.2–3.5 V.6 SnO2@TiO2 double-shell nanotubes achieved reversible capacities of 300 and 200 mA h g−1 after cycling 50 times at 800 and 1500 mA g−1, respectively.7 Highly uniform TiO2/SnO2/carbon hybrid nanofibers delivered a reversible capacity of 442.8 mA h g−1 at 30 mA g−1 after 100 cycles.8 Mesoporous graphene-based TiO2/SnO2 hybrid nanosheets retained a reversible capacity of 246.5 mA h g−1 at 100 mA g−1 after 200 cycles.9 Graphene–TiO2–SnO2 ternary nanocomposites exhibited a reversible capacity of 537 mA h g−1 after cycling 50 times at 50 mA g−1.10 Electrospun SnO2 and TiO2 composite nanofibers demonstrated fast capacity decay to below 50 mA h g−1 after cycling 80 cycles at 100 mA g−1.11 The encapsulation of SnO2 nanoparticles into hollow TiO2 nanowires achieved a reversible capacity of 445 mA h g−1 at 800 mA g−1 after 500 cycles.12 TiO2 nanotube@SnO2 nanoflake core–branch arrays retained a capacity of 580 mA h g−1 at 1.6 A g−1 despite the downdraught with cycling.13 From the investigations available, though the performance is significantly different due to the discrepancy in the composition ratio, the preparation method, the structure and morphology, the capacity of the composite is markedly higher than that of TiO2. Moreover, the combination of Ti–Sn–O oxides with carbon materials with high electronic conductivity could further improve the electrochemical performance.8–10 The enhanced capacity and rate performance could meet the requirement for large-scale LIBs with high energy density and power density, such as those utilized in electric vehicles (EV), hybrid electric vehicles (HEV) and large-scale energy storage devices.Coating carbon on metal oxides is an effective route to improve their electrochemical performance, and most of the present work have focused on coating carbon on individual oxides of SnO2 and TiO2.14–17 Although compositing with carbon materials could enhance the rate performance of Ti–Sn–O composite anodes,8–10 to the best of our knowledge, no work has so far been related to carbon-coated Ti–Sn–O anodes for lithium storage.
Due to the enhanced electronic conductivity of carbon materials by N-doping, very recently, carbon precursors containing amines were attempted to act as carbon sources for electrode materials. For example, nitrogen-doped carbon coated TiO2 nanocomposites using polydopamine as a carbon precursor showed very good capacity retention and cycling performance.18 Fe3O4 composites with N-doped carbon coating derived from dopamine exhibited remarkably high specific capacity, high rate capability and excellent cycling performance.19 MgFe2O4 encapsulated in carbon coating derived from pyrrole delivered a high reversible capacity and greatly improved rate performance.20 These results demonstrate the superiority of N-doped carbon coating for improving the rate capability and cyclability of electrode materials.
In this work, a simple precipitation method was adopted to fabricate Ti–Sn–O composite oxides on a large scale. Pyridine was used as the carbon source to prepare carbon-coated Ti–Sn–O composites. The carbon-coated composites exhibit a reversible capacity of 438 mA h g−1 at 100 mA g−1 after 100 cycles. Though pyrrole is effective for obtaining carbon-coated Fe-based oxides with excellent electrochemical performance.19,20 Pyridine is more efficient for the Ti–Sn–O anode materials to form carbon coating to enhance the electrochemical performance.
2. Experimental methods
2.1 Synthesis of Ti–Sn–O composite oxides
All the chemicals employed in this work are analytically pure and without further purification. As an example for the preparation of Ti–Sn–O composite oxides with a Ti/Sn molar ratio of 1.7![[thin space (1/6-em)]](https://www.rsc.org/images/entities/char_2009.gif) :
:![[thin space (1/6-em)]](https://www.rsc.org/images/entities/char_2009.gif) 0.3, the NaOH solution (1.2 g NaOH dissolved in 50 mL deionized water) was titrated into the SnCl2 solution (3.38 g SnCl2·2H2O dissolved in 50 mL deionized water) under magnetic stirring at ambient temperature. After washing the precipitates three times with deionized water to remove the by-product NaCl, the solution of 28.93 g tetrabutyl titanate (TBT) dissolved in absolute ethyl alcohol was titrated into the precipitates. The precipitates dried at 110 °C for 12 h were sintered, respectively, at 400 and 600 °C for 5 h in a muffle furnace in air atmosphere, and the sintered products are denoted as S1-400 and S1-600. The Ti–Sn–O composite with a Ti/Sn molar ratio of 1
0.3, the NaOH solution (1.2 g NaOH dissolved in 50 mL deionized water) was titrated into the SnCl2 solution (3.38 g SnCl2·2H2O dissolved in 50 mL deionized water) under magnetic stirring at ambient temperature. After washing the precipitates three times with deionized water to remove the by-product NaCl, the solution of 28.93 g tetrabutyl titanate (TBT) dissolved in absolute ethyl alcohol was titrated into the precipitates. The precipitates dried at 110 °C for 12 h were sintered, respectively, at 400 and 600 °C for 5 h in a muffle furnace in air atmosphere, and the sintered products are denoted as S1-400 and S1-600. The Ti–Sn–O composite with a Ti/Sn molar ratio of 1![[thin space (1/6-em)]](https://www.rsc.org/images/entities/char_2009.gif) :
:![[thin space (1/6-em)]](https://www.rsc.org/images/entities/char_2009.gif) 1 was also fabricated by the similar process except for the NaOH solution containing 2.4 g NaOH, the SnCl2 solution containing 6.8 g SnCl2·2H2O, and the TBT solution containing 10.2 g TBT. The washed precipitates were also sintered at 400 °C for 5 h in air (designated as S2-400). Individual oxides of SnO2 and TiO2 were also prepared under the analogous conditions and sintered at 400 °C for 5 h.
1 was also fabricated by the similar process except for the NaOH solution containing 2.4 g NaOH, the SnCl2 solution containing 6.8 g SnCl2·2H2O, and the TBT solution containing 10.2 g TBT. The washed precipitates were also sintered at 400 °C for 5 h in air (designated as S2-400). Individual oxides of SnO2 and TiO2 were also prepared under the analogous conditions and sintered at 400 °C for 5 h.
2.2 Coating carbon
Pyridine was used as the carbon source to form carbon coating on Ti–Sn–O oxides. Typically, 1.5 g samples were separately put into stainless steel autoclaves of 30 mL capacity, followed by uniformly adding 0.51 mL pyridine into the samples. The tightly sealed autoclaves were heated to 550 °C for 5 h. For comparison, the as-sintered products of SnO2 and TiO2 were also coated with carbon at 550 °C for 5 h using pyridine as the carbon source. The carbon-coated products using pyridine as the carbon source are marked as C1. Meanwhile, 0.51 mL pyrrole and 1.05 g glucose were also utilized as the carbon source to form carbon coating on S1-400 under the same conditions (denoted as S1-400C2 and S1-400C3) to compare the effect of different carbon sources on the electrochemical performance. The preparation conditions of the Ti–Sn–O composites are listed in Table 1.| Sample | Ti/Sn molar ratio | Sintering temperature (°C) | Carbon source |
|---|---|---|---|
| S1-400 | 1.7/0.3 | 400 | — |
| S1-400C1 | 1.7/0.3 | 400 | Pyridine |
| S1-400C2 | 1.7/0.3 | 400 | Pyrrole |
| S1-400C3 | 1.7/0.3 | 400 | Glucose |
| S1-600C1 | 1.7/0.3 | 600 | Pyridine |
| S2-400C1 | 1/1 | 400 | Pyridine |
| SnO2 | — | 400 | — |
| SnO2-400C1 | — | 400 | Pyridine |
| TiO2 | — | 400 | — |
| TiO2-400C1 | — | 400 | Pyridine |
2.3 Characterization of the products
The morphology of the products was examined using a JEOL JEM-2100 high-resolution transmission electron microscope (HRTEM), and a Hitachi SU-70 field emission scanning electron microscope (FESEM) equipped with an energy-dispersive X-ray spectrometer (EDX). X-ray diffraction (XRD) patterns were acquired at a scanning rate of 4° min−1 using a Rigaku Dmax-2500 diffractometer with Ni filtered Cu Kα radiation at a voltage of 50 kV and an electric current of 100 mA. The nitrogen adsorption/desorption isotherms were acquired at 77 K on a Quadrasorb SI sorption analyzer, and the specific surface area was calculated based on the Brunauer–Emmett–Teller (BET) method. Thermogravimetric (TG) analysis was performed from ambient temperature to 800 °C in air at a heating rate of 10 °C min−1 in a SDT thermal-microbalance apparatus to evaluate the carbon content. X-ray photoelectron spectra (XPS) were analyzed on a KARTOS XSAM800 X-ray photoelectron spectrometer (Kratos Analytical Ltd, Manchester, UK) using Al Kα radiation (hν = 1486.6 eV) as the excitation source (V = 12 kV, I = 10 mA).2.4 Electrochemical performance measurements
Half cells of 2025 coin-type were assembled for electrochemical performance measurements. The active materials (80 wt%), carbon black (10 wt%), and polyvinylidene fluoride (PVDF) (10 wt%) were mixed in n-methyl pyrrolidinone (NMP). The uniform slurry was coated on the Cu foil substrate, followed by drying at 120 °C for 12 h in a vacuum oven. The mixture of LiPF6 in ethylene carbonate and diethyl carbonate (EC/DMC, 1![[thin space (1/6-em)]](https://www.rsc.org/images/entities/char_2009.gif) :
:![[thin space (1/6-em)]](https://www.rsc.org/images/entities/char_2009.gif) 1 by volume) was used as an electrolyte, Li foil as the reference electrode, and Celgard 2300 as a separator. The assembly of the cells was conducted in an argon-filled glovebox at room temperature. The active material loaded on each disk (14 mm in diameter, punched from the Cu foils) is about 3.0 mg in weight.
1 by volume) was used as an electrolyte, Li foil as the reference electrode, and Celgard 2300 as a separator. The assembly of the cells was conducted in an argon-filled glovebox at room temperature. The active material loaded on each disk (14 mm in diameter, punched from the Cu foils) is about 3.0 mg in weight.
The electrochemical performance of the cells was tested galvanostatically at a variety of current densities in the voltage range of 0.02–3 V on a Land CT2001A battery test system. Cyclic voltammogram (CV) was acquired on an IviumStat electrochemistry workstation at a scanning rate of 0.3 mV s−1 in the potential window of 0.01–3 V vs. Li/Li+. The electrochemical impedance spectra (EIS) were measured in the frequency range of 100 kHz–0.01 Hz by applying a 5 mV amplitude signal.
3. Results and discussion
3.1 Electrochemical performance
The cycling performance of carbon-coated Ti–Sn–O composites with various Ti/Sn molar ratios of 2![[thin space (1/6-em)]](https://www.rsc.org/images/entities/char_2009.gif) :
:![[thin space (1/6-em)]](https://www.rsc.org/images/entities/char_2009.gif) 1, 3
1, 3![[thin space (1/6-em)]](https://www.rsc.org/images/entities/char_2009.gif) :
:![[thin space (1/6-em)]](https://www.rsc.org/images/entities/char_2009.gif) 1, 4
1, 4![[thin space (1/6-em)]](https://www.rsc.org/images/entities/char_2009.gif) :
:![[thin space (1/6-em)]](https://www.rsc.org/images/entities/char_2009.gif) 1, 5
1, 5![[thin space (1/6-em)]](https://www.rsc.org/images/entities/char_2009.gif) :
:![[thin space (1/6-em)]](https://www.rsc.org/images/entities/char_2009.gif) 1, 1.7
1, 1.7![[thin space (1/6-em)]](https://www.rsc.org/images/entities/char_2009.gif) :
:![[thin space (1/6-em)]](https://www.rsc.org/images/entities/char_2009.gif) 0.3 and 6
0.3 and 6![[thin space (1/6-em)]](https://www.rsc.org/images/entities/char_2009.gif) :
:![[thin space (1/6-em)]](https://www.rsc.org/images/entities/char_2009.gif) 1 using glucose as the carbon source was measured at a current density of 100 mA g−1 (Fig. S1, ESI†). Apparently, after 100 cycles, the composite with a Ti/Sn molar ratio of 1.7
1 using glucose as the carbon source was measured at a current density of 100 mA g−1 (Fig. S1, ESI†). Apparently, after 100 cycles, the composite with a Ti/Sn molar ratio of 1.7![[thin space (1/6-em)]](https://www.rsc.org/images/entities/char_2009.gif) :
:![[thin space (1/6-em)]](https://www.rsc.org/images/entities/char_2009.gif) 0.3 (i.e. S1-400C3) exhibits the best performance of 182 mA h g−1. As a consequence, the composite was selected to investigate the effect of carbon source on the performance.
0.3 (i.e. S1-400C3) exhibits the best performance of 182 mA h g−1. As a consequence, the composite was selected to investigate the effect of carbon source on the performance.
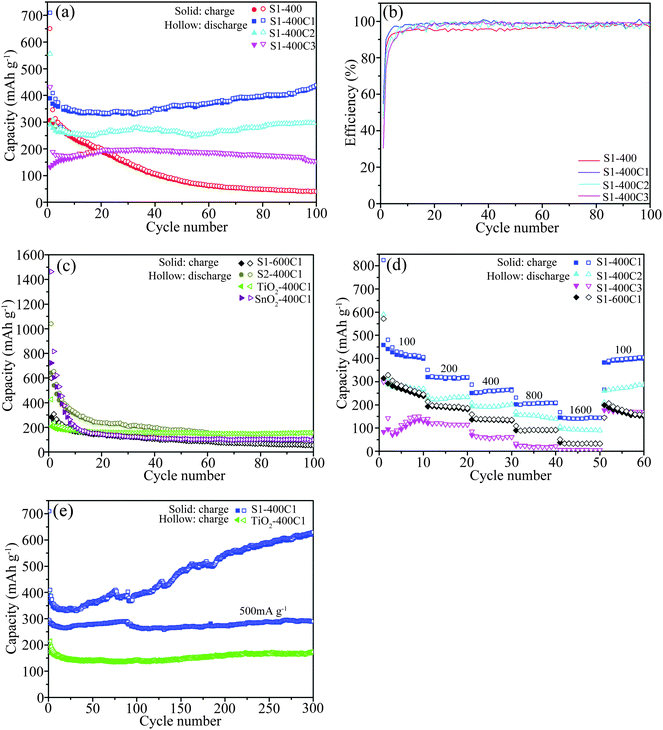
The cycling performance of the carbon-coated S1-400 derived from various carbon sources was tested at 100 mA g−1, as presented in Fig. 1a. The first discharge/charge capacities are 650/306 mA h g−1 for S1-400, 709/389 mA h g−1 for S1-400C1, 556/290 mA h g−1 for S1-400C2, and 432/132 mA h g−1 for S1-400C3, corresponding to the initial Columbic efficiency of 47.1, 54.8, 52.1 and 30.4% (Fig. 1b). After cycling 100 times, the reversible capacities are 41, 438, 297 and 160 mA h g−1 for S1-400, S1-400C1, S1-400C2, and S1-400C3, respectively, and the Coulombic efficiency is close to 100%. Apparently, the carbon source has a critical effect on the electrochemical performance of Ti–Sn–O composites, and the pyridine as the N-containing carbon source could achieve optimal performance. For S1-400C1 and S1-400C2, the slight increase in capacity with cycling is ascribed to the activation effect, interfacial Li-ion storage and the formation of polymeric gel-like films.21,22 Similar capacity increase with cycling also occurs in other metal oxides.20,23–25
The cycling performance of some other products using pyridine as the carbon source at 100 mA g−1 is shown in Fig. 1c. Combined with the first discharge/charge capacities of the carbon-coated SnO2 (1464/723 mA h g−1), the high initial capacity for S2-400C1 (1040/642 mA h g−1) is associated with the high Sn content which also leads to the rapid capacity decay in the subsequent cycles due to the large volume change resulting from the lithiation/delithiation of SnO2. After 100 cycles, the reversible capacities are 55 mA h g−1 for S1-600C1 and 158 mA h g−1 for S2-400C1 despite the coulombic efficiency close to 100%, demonstrating that the cycling performance of the carbon-coated Ti–Sn–O oxides associates significantly with the Ti/Sn molar ratio, sintering temperature, and the carbon source. The reversible capacities of S1-400C1 and S1-400C2 after the 100th cycle are much higher than that of the carbon-coated TiO2 (156 mA h g−1). The superior reversible capacity of S1-400C1 compared to the other products suggests that the composite with the Ti/Sn molar ratio of 1.7![[thin space (1/6-em)]](https://www.rsc.org/images/entities/char_2009.gif) :
:![[thin space (1/6-em)]](https://www.rsc.org/images/entities/char_2009.gif) 0.3 sintered at 400 °C using pyridine as the carbon source could achieve the optimal cycling performance.
0.3 sintered at 400 °C using pyridine as the carbon source could achieve the optimal cycling performance.
Owing to the better cycling performance of S1-400C1, S1-400C2, S1-400C3 and S1-600C1, their rate performance was also measured at various current densities each for 10 cycles, as displayed in Fig. 1d. Obviously, the reversible capacities of S1-400C1 are markedly higher than those of S1-400C2, S1-400C3 and S1-600C1, at the corresponding densities of 100, 200, 400, 800 and 1600 mA g−1. For clarity, the capacities at various densities are summarized in Table 2.
| Sample no. | Current density (mA g−1) | |||||
|---|---|---|---|---|---|---|
| 100 | 200 | 400 | 800 | 1600 | 100 | |
| S1-400C1 | 406 | 319 | 262 | 209 | 144 | 404 |
| S1-400C2 | 270 | 230 | 196 | 152 | 94 | 275 |
| S1-400C3 | 139 | 114 | 60 | 21 | 5 | 169 |
| S1-600C1 | 245 | 195 | 140 | 93 | 34 | 172 |
Furthermore, the S1-400C1 tested in 300 cycles at 100 mA g−1 achieved a reversible capacity of 629 mA h g−1. The signally increasing capacity with cycling confirms the activation effect mentioned in above section and after the rate performance measurement, the S1-400C1 cells were continuously tested at a density of 500 mA g−1 (Fig. 1e). A reversible capacity of 289 mA h g−1 is retained after cycling 300 times at 500 mA g−1 which is much higher than the capacity of TiO2-400C1 even cycled at 100 mA g−1, demonstrating compared with the cycling performance of TiO2 and SnO2 that the composite oxide of S1-400C1 with the merits of both the structure stability of TiO2 and high capacity of SnO2 exhibits outstanding rate performance and long-term cycling stability.
For a better understanding of the enhanced electrochemical performance of Ti–Sn–O composite oxides, a series of characterization studies were performed as follows.
3.2 XRD results
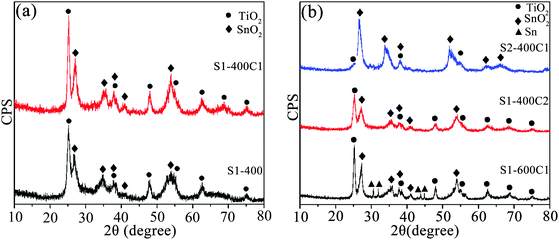
The XRD patterns of the as-sintered and carbon-coated products are shown in Fig. 2. From Fig. 2a, both the as-sintered product of S1-400 and the carbon-coated product of S1-400C1 are comprised of two phases of anatase TiO2 (JCPDS card No. 21-1272) and cassiterite SnO2 (JCPDS card No. 41-1445), i.e. coating carbon on the as-sintered product does not change the structure of the composite oxides. However, the diffractions of S1-400C1 are slightly sharper than those of S1-400 due to the improved crystallinity resulting from the higher temperature of 550 °C for coating carbon than the sintering temperature of 400 °C. The wide diffraction peaks are indicative of the formation of nanocrystallites, and the average crystallite size estimated by the Scherer formula is 12.8 nm for TiO2 and 6.7 nm for SnO2 in S1-400C1. Fig. 2b shows the XRD patterns of the carbon-coated products with varied Ti/Sn molar ratios sintered at two temperatures using different carbon sources. Although the carbon-coated product of S2-400C1 also contains two phases of SnO2 and TiO2, the diffractions from TiO2 are markedly weaker than those from SnO2 owing to the decreased Ti/Sn molar ratio. The TiO2 and SnO2 crystallites in S1-400C2 are 11.4 and 8.6 nm, respectively, those in S1-600C1 are 17.4 and 12 nm, and the SnO2 crystallites in S2-400C1 is 7.4 nm, demonstrating that lower sintering temperature is favorable for obtaining smaller crystallites. It is noteworthy that a small amount of tin was reduced in S1-600C1 due to the reaction of SnO2 and carbon. The low performance of S1-600C1 is due to the larger crystallites resulting from the higher sintering temperature than S1-400C1, and the inferior performance of S2-400C1 is associated with the lower Ti content in the product. In other words, the superior performance of S1-400C1 is ascribed to the appropriate Ti/Sn molar ratio and sintering temperature, because the stable structure of TiO2 and fine crystallites could endow the composite with enhanced electrochemical performance.3.3 TEM and SEM observation
The TEM images of the carbon-coated Ti–Sn–O composites are displayed in Fig. 3. From Fig. 3a and b, the nanoparticles of about 5–20 nm in diameter in S1-400C1 are coated with an amorphous carbon layer of about 1.2 nm in thickness. The carbon coating could effectively restrict the aggregation and growth of nanoparticles encapsulated,26–28 and could function as a physical layer to buffer a large volume change during Li+ insertion/extraction, contributing to the improved electrochemical performance. In Fig. 3b, the lattice fringes with a d-spacing of 0.35 nm correspond to the (101) plane of TiO2.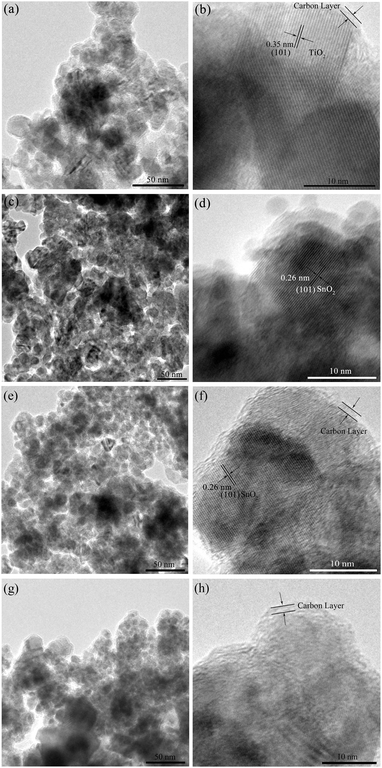 | ||
| Fig. 3 TEM images of (a and b) S1-400C1, (c and d) S1-600C1, (e and f) S1-400C2 and (g and h) S2-400C1. | ||
From the TEM images of S1-600C1 shown in Fig. 3c and d, the carbon coating is not well formed and the particle size is not uniform with some particles larger than 40 nm, indicating that 600 °C is not an appropriate sintering temperature for Ti–Sn–O composite oxides. The interplanar spacing of 0.26 nm in Fig. 3d represents that of the (101) plane of SnO2. For S1-400C2 (Fig. 3e and f), the uniform particle size is about 14 nm with the carbon coating of about 1.5 nm in thickness, similar to that for S1-400C1. In Fig. 3f, the lattice spacing of 0.26 nm is also ascribed to that of the (101) plane of SnO2. From Fig. 3g and h the particles in S2-400C1 are significantly inhomogenous in spite of the uniform carbon coating (about 1.7 nm in thickness) on the particles, accountable for the low electrochemical performance.
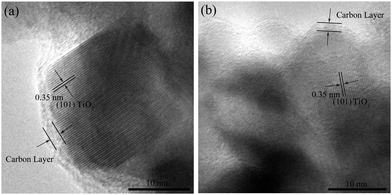
For verifying the structural stability of the carbon-coated products, we dissected the cells of S1-400C1 after cycling 300 times at 500 mA g−1, washed the active materials thoroughly with acetone and ethanol, and examined the structure by HRTEM, as shown in Fig. 4. Apparently, the carbon coating remains uniform around the TiO2 nanoparticles. The good stability of carbon coating and TiO2 nanoparticles during cycling is responsible for the stable electrochemical performance of S1-400C1.
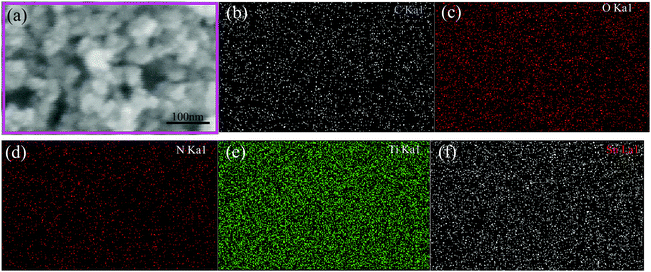
Fig. 5 shows the SEM image and the corresponding element scanning maps of S1-400C1. The uniform distribution of C, N, O, Ti and Sn in the product demonstrates the mutually dispersed TiO2 and SnO2 nanoparticles with the carbon coating, favorable for rapid Li-ion diffusion and efficient charge transfer.16,29–31
3.4 Specific surface area
For further confirming the results from TEM and XRD, nitrogen adsorption/desorption isotherms were measured and are shown in Fig. S2 (ESI†). Calculated from the isotherms by the BET model, the specific surface areas are 88.2 m2 g−1 for S1-400, 29 m2 g−1 for S1-400C1, 25.3 m2 g−1 for S1-600C1, and 13.4 m2 g−1 for S1-400C2. Apparently, the surface area decreases after carbon coating. In particular, for the same carbon source of pyridine, the higher sintering temperature of 600 °C (S1-600C1) results in a smaller surface area in comparison with the sample sintered at 400 °C (S1-400C1), demonstrating the grain growth at high sintering temperature.3.5 TG analysis
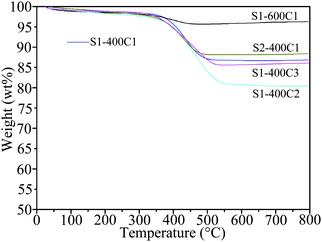
The carbon content in the carbon-coated products was determined by TG analysis, as revealed in Fig. 6. The abrupt weight loss occurring between 350 and 550 °C is due to the oxidation of carbon, which is 11.2% for S1-400C1, 2.5% for S1-600C1, 16% for S1-400C2, 13.2% for S1-400C3 and 9.1% for S2-400C1.3.6 XPS spectra of the carbon-coated products
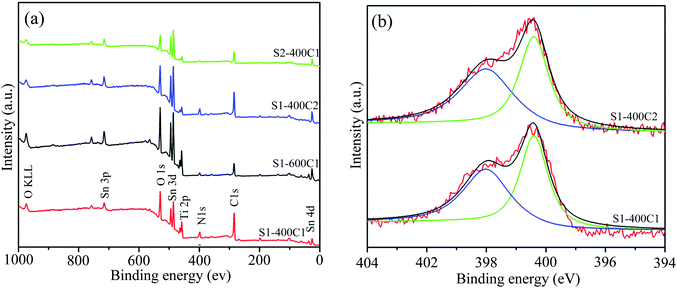
The XPS spectra of the carbon-coated products are displayed in Fig. 7. The survey spectra in Fig. 7a clearly reveal the existence of Sn, Ti, and O along with N and C despite the difference in peak intensity due to varied compositions. The peaks at around 486.0 and 494.4 eV correspond to Sn3d5/2 and 3d3/2 spin–orbit splitting peaks, respectively, and the ones at around 458.4 and 464.0 eV to Ti2p3/2 and 2p1/2. The binding energy of O1s at 530 eV could be assigned to the lattice oxygen and that of O KLL at 974 eV to the absorbed oxygen.27 The N1s spectra of S1-400C1 and S1-400C2 (Fig. 7b) could be deconvoluted into two peaks at around 398.3 and 400.0 eV, corresponding, respectively, to pyridine N and pyrrolic N in carbon materials. The N-containing carbon coating could significantly improve the electronic conductivity of electrode materials,18–20,25,32,33 thus contributing to enhanced electrochemical performance of Ti–Sn–O composites.3.7 Raman spectra of the carbon-coated products
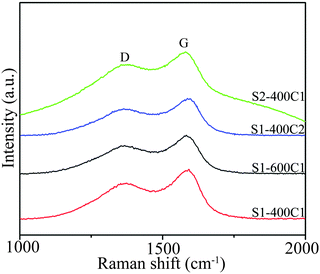
To determine the structure of the carbon material in carbon-coated products, Raman spectra were measured, as shown in Fig. 8. The two strong peaks at around 1375 and 1580 cm−1 are attributed to the D band (amorphous carbon, sp3) and the G band (graphitic carbon, sp2).25,28,34 The high intensity ratio of the two peaks (ID/IG) is an indication of the low graphitization degree of carbon coating.3.8 Electrochemical reaction
For a better understanding of the lithiation/delithiation mechanism during discharge/charge cycling, CV plots were tested, as shown in Fig. 9. For further support, the corresponding capacity–voltage curves are also presented in Fig. 9. From the CV plot of S1-400C1 in Fig. 9a, the curve for the initial cycle is greatly different from those for the following cycles. The main reduction peak at about 0.8 V during the first cycle is due to the conversion of SnO2 to Sn along with the formation of Li2O and a solid–electrolyte interface (SEI) film.3,35–37 From the second cycle, the peak markedly weakens because both the SEI film and the irreversible capacity dominantly occur in the first cycle. The weak reduction peak at around 1.75 V is ascribed to the reaction of Li+ with anatase TiO2 to form LixTiO2 (x ≤ 1).3,38,39 The cathodic peak at around 0.168 V corresponds to the Li+ insertion into carbon to form C6Li and into metallic Sn to form a Li–Sn alloy.36,37 The main oxidation peak at around 0.58 V is ascribed to the extraction of Li+ from carbon and the delithiation of the Li–Sn alloy to Sn,36,37 and the one at around 2.1 V to the delithiation of LixTiO2.3,38,39 From the capacity–voltage plots in Fig. 9b, the plateaus occurring at various voltages during discharging/charging correspond well with the peaks in the CV plots. For S1-600C1, S1-400C2 and S2-400C1, the peak positions in the CV plots (Fig. 9c, e and g) are approximately close to those for S1-400C1 in spite of the varied peak intensity resulting from different Ti/Sn molar ratios, sintering temperatures and carbon sources. From the charge/discharge profiles shown in Fig. 9b, d, f and h, there is a large difference between the capacity–voltage curves despite similar plateaus during the first discharge/charge cycle. S2-400C1 delivers much higher capacities than the other products in the initial discharge/charge cycle, however, the capacity decreases rapidly during subsequent cycling. The high initial capacity of S2-400C1 originates from the high SnO2 due to its high theoretical capacity of 790 mA h g−1, while the large volume change and pulverization of SnO2 during charging/discharging also lead to the fast capacity decay. Despite the same Ti/Sn molar ratio in S1-400C1, S1-400C2, and S1-600C1, the higher sintering temperature of 600 °C for S1-600C1 gives rise to the grain growth as confirmed by the XRD patterns in Fig. 2 and TEM images in Fig. 3. The aggregation and growth of SnO2 particles is dominantly responsible for the rapid capacity decrease in S1-600C1. Thus it can be seen that both the high content of SnO2 in the Ti–Sn–O oxides and the high sintering temperature are not favorable for achieving good electrochemical performance.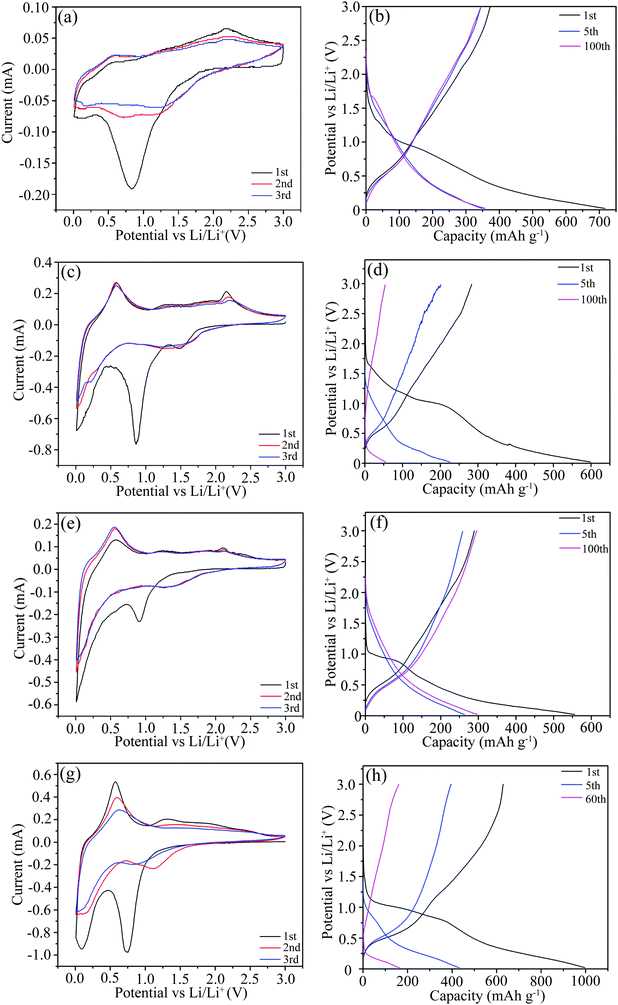 | ||
| Fig. 9 CV plots and charge/discharge profiles of S1-400C1 (a and b), S1-600C1 (c and d), S1-400C2 (e and f) and S2-400C1 (g and h). | ||
3.9 Electrochemical impedance
In order to understand the difference in electrochemical performance of the carbon-coated products, EIS of the charged cells were measured, as shown in Fig. 10. From Fig. 10a, the Nyquist plots contain two depressed semicircles in the high and medium frequency region and an inclined line in the low frequency region. The diameters of the semicircle represent the SEI film resistance (Rsf) and charge-transfer resistance (Rct), respectively, and the slope of the line is associated with Li-ion diffusion in solid active materials,28,29,32i.e. the Warburg impedance (Zw). The fitting plots in Fig. 10b obtained from the equivalent circuit in Fig. 10c (where Re represents the ohmic resistance including total resistance of the electrolyte, separator and electrical contact, CPE is the constant phase-angle element involving double layer capacitance) agree well with the experimental results, so the electrical resistance values could be determined by the fitted plots. The Rct value of S1-400C1 (32.0 Ω) is much smaller than those of S1-600C1 (311.8 Ω), S1-400C2 (50.0 Ω) and S2-400C1 (1396.0 Ω). The enhanced charge-transfer for S1-400C1 is due to the fast electron transport and a large electrode–electrolyte contact area resulting from the N-doped carbon coating on the well-dispersed nanoparticles. Meanwhile, the small crystallite size of S1-400C1 could dramatically shorten the diffusion length of Li-ions, thus significantly improving Li-ion diffusion kinetics.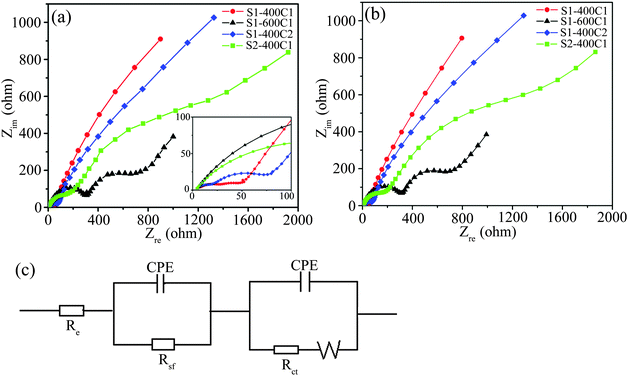 | ||
| Fig. 10 (a) Nyquist plots of charged cells for S1-400C1, S1-600C1, S1-400C2 and S2-400C1 after cycling 5 times, (b) the corresponding fitting plots and (c) the equivalent circuit. | ||
The Nyquist plots of S1-400C1 charged at 100 and 500 mA g−1 for different cycles were also measured to explain the cycling performance (Fig. 11), and the Rct values fitted from the plots are summarized in Table S1 (ESI†). When cycled at 100 mA g−1, the Rct value (Fig. 11a and Table S1, ESI†) increases gradually from 5 to 50 cycles and then decreases markedly from 50 to 200 cycles, consistent with the variation tendency of cycling performance in Fig. 1e. The initial capacity fading is due to the mechanical degradation and unstable SEI formation during cycling, and the subsequent increase is due to reactivation.40 The reactivation effect is attributed to the synergistic combination of lithiation–delithiation refinement of the microstructure and optimization of stable SEI.40,41
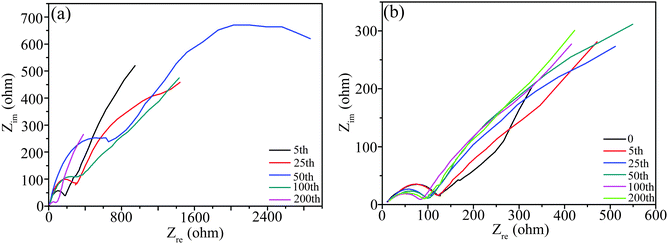 | ||
| Fig. 11 Nyquist plots of S1-400C1 charged at different rates for various cycles. (a) At 100 mA g−1, and (b) at 500 mA g−1 after the rate performance test. | ||
From Fig. 11b and Table S1 (ESI†), the cell after the rate performance test exhibits a higher Rct, and when continuously cycled at 500 mA g−1, the Rct tends to be of stable values, in good agreement with the stable capacity at 500 mA g−1, in other words, the stable performance at 500 mA g−1 is associated with the stable internal resistance.
4. Conclusions
In summary, using pyridine as the carbon source could form uniform N-doped carbon coating on Ti–Sn–O composite oxides. The carbon-coated composites exhibit enhanced electrochemical performance compared to the individual oxides of TiO2 and SnO2 coated carbon under the same conditions. The uniform N-doped carbon layer could effectively enhance the electronic conductivity, and the appropriate Ti/Sn molar ratio of 1.7![[thin space (1/6-em)]](https://www.rsc.org/images/entities/char_2009.gif) :
:![[thin space (1/6-em)]](https://www.rsc.org/images/entities/char_2009.gif) 0.3 could form mutually dispersed TiO2 and SnO2 nanoparticles, effectively preventing the SnO2 nanoparticles from agglomeration. As a consequence, the carbon-coated Ti–Sn–O composite oxides could be used as promising anode materials for LIBs with high performance.
0.3 could form mutually dispersed TiO2 and SnO2 nanoparticles, effectively preventing the SnO2 nanoparticles from agglomeration. As a consequence, the carbon-coated Ti–Sn–O composite oxides could be used as promising anode materials for LIBs with high performance.
Acknowledgements
This work was supported by Shandong Provincial Natural Science Foundation, China (ZR2015EM016), Science and Technology Development Project of Shandong Province (2014GGX102009 and 2015GGX102005), and Independent Innovation Foundation of Shandong University, IIFSDU (2012ZD004).References
- H. K. Wang, H. Huang, C. Niu and A. L. Rogach, Small, 2015, 11, 1364–1383 CrossRef CAS PubMed.
- M. V. Reddy, G. V. Subba Rao and B. V. R. Chowdari, Chem. Rev., 2013, 113, 5364–5457 CrossRef CAS PubMed.
- I. Issac, M. Scheuermann, S. M. Becker, E. G. Bardají, C. Adelhelm, D. Wang, C. Kübel and S. Indris, J. Power Sources, 2011, 196, 9689–9695 CrossRef CAS.
- Y. C. Chen, T. F. Hung, C. W. Hu, C. Y. Chiang, C. W. Huang, H. C. Su, R. S. Liu, C. H. Lee and C. C. Chang, Nanoscale, 2013, 5, 2254–2258 RSC.
- L. Aldon, P. Kubiak, A. Picard, J. C. Jumas and J. O. Fourcade, Chem. Mater., 2006, 18, 1401–1406 CrossRef CAS.
- H. Uchiyama, E. Hosono, H. S. Zhou and H. Imai, Solid State Ionics, 2009, 180, 956–960 CrossRef CAS.
- J. H. Jeun, K. Y. Park, D. H. Kim, W. S. Kim, H. C. Kim, B. S. Lee, H. Kim, W. R. Yu, K. Kang and S. H. Hong, Nanoscale, 2013, 5, 8480–8483 RSC.
- Z. X. Yang, Q. Meng, Z. P. Guo, X. B. Yu, T. L. Guo and R. Zeng, J. Mater. Chem., 2013, 1, 10395–10402 RSC.
- Y. P. Tang, D. Q. Wu, S. Chen, F. Zhang, J. P. Jia and X. L. Feng, Energy Environ. Sci., 2013, 6, 2247–2451 Search PubMed.
- X. Jiang, X. L. Yang, Y. H. Zhu, K. C. Fan, P. Zhao and C. Z. Li, New J. Chem., 2013, 37, 3671–3678 RSC.
- T. Trana, K. McCormaca, J. L. Li, Z. H. Bi and J. Wu, Electrochim. Acta, 2014, 117, 68–75 CrossRef.
- Q. Tian, Z. X. Zhang, L. Yang and S. Hirano, J. Power Sources, 2014, 253, 9–16 CrossRef CAS.
- C. G. Zhu, X. H. Xia, J. l. Liu, Z. X. Fan, D. L. Chao, H. Zhang and H. J. Fan, Nano Energy, 2014, 4, 105–112 CrossRef CAS.
- X. Y. Yu, S. Y. Yang, B. H. Zhang, D. Shao, X. M. Dong, Y. P. Fang, Z. S. Li and H. Q. Wang, J. Mater. Chem., 2011, 219, 12295–12301 RSC.
- B. H. Zhang, X. Y. Yu, C. Y. Ge, X. M. Dong, Y. P. Fang, Z. S. Li and H. Q. Wang, Communications, 2010, 10, 9188–9190 Search PubMed.
- Y. Li, S. M. Zhu, Q. L. Liu, J. J. Gu, Z. P. Guo, Z. X. Chen, C. L. Feng, D. Zhang and W. J. Moon, J. Mater. Chem., 2012, 22, 2766–2772 RSC.
- W. S. Wang, Q. Sa, J. H. Chen, Y. Wang, H. J. Jung and Y. D. Yin, ACS Appl. Mater. Interfaces, 2013, 5, 6478–6483 CAS.
- L. Tan, L. Pan, C. Y. Cao, B. F. Wang and L. Li, J. Power Sources, 2014, 253, 193–2000 CrossRef CAS.
- C. Lei, F. Han, D. Li, W. C. Li, Q. Sun, X. Q. Zhang and A. H. Lu, Nanoscale, 2013, 5, 1168–1175 RSC.
- C. Gong, Y. J. Bai, Y. X. Qi, N. Lun and J. Feng, Electrochim. Acta, 2013, 90, 119–127 CrossRef CAS.
- S. Grugeon, S. Laruelle, L. Dupont and J. M. Tarascon, Solid State Sci., 2003, 5, 895–904 CrossRef CAS.
- J. Maier, Nat. Mater., 2005, 5, 805–815 CrossRef.
- Y. Ma, C. Fang, B. Ding, G. Ji and J. Y. Lee, Adv. Mater., 2013, 25, 4646–4652 CrossRef CAS PubMed.
- K. Zhang, P. Han, L. Gu, L. Zhang, Z. Liu, Q. Kong, C. Zhang, S. Dong, Z. Zhang, J. Yao, H. Xu, G. Cui and L. Chen, ACS Appl. Mater. Interfaces, 2012, 4, 658–664 CAS.
- G. X. Lu, S. Qiu, H. L. Lv, Y. Fu, J. R. Liu, X. Y. Li and Y. J. Bai, Electrochim. Acta, 2014, 146, 249–256 CrossRef CAS.
- G. N. Zhu, H. J. Liu, J. H. Zhuang, C. X. Wang, Y. G. Wang and Y. Y. Xia, Energy Environ. Sci., 2011, 4, 4016–4022 CAS.
- L. X. Yang and L. J. Gao, J. Alloys Compd., 2009, 485, 93–97 CrossRef CAS.
- C. F. Zhang, X. Peng, Z. P. Guo, C. B. Cai, Z. X. Chen, D. Wexler, S. Li and H. K. Liu, Carbon, 2012, 50, 1897–1903 CrossRef CAS.
- B. G. Choi, S. J. Chang, Y. B. Lee, J. S. Bae, H. J. Kim and Y. S. Huh, Nanoscale, 2012, 4, 5924–5930 RSC.
- S. Yang, W. B. Yue, J. Zhu, Y. Ren and X. J. Yang, Adv. Funct. Mater., 2013, 23, 3570–3576 CrossRef CAS.
- Z. Y. Wang, D. Y. Luan, F. Yin, C. Boey, X. Wen and D. Lou, J. Am. Chem. Soc., 2011, 133, 4738–4741 CrossRef CAS PubMed.
- T. Li, Y. Y. Wang, R. Tang, Y. X. Qi, N. Lun, Y. J. Bai and R. H. Fan, ACS Appl. Mater. Interfaces, 2013, 5, 9470–9477 CAS.
- C. Lai, X. C. Yuan, X. L. Cao, Q. Q. Qiao, Y. L. Wang and S. H. Yeb, Electrochem. Solid-State Lett., 2012, 15, A65–A67 CrossRef CAS.
- X. B. Hu, Z. J. Lin, K. R. Yang, Y. J. Huai and Z. H. Deng, Electrochim. Acta, 2011, 56, 5046–5053 CrossRef CAS.
- J. X. Li, Y. Zhao, N. Wang and L. H. Guan, Chem. Commun., 2011, 47, 5238–5240 RSC.
- L. L. Li, S. J. Peng, J. Wang, Y. L. Cheah, P. F. Teh, Y. W. Ko, C. L. Wong and M. H. Srinivasan, ACS Appl. Mater. Interfaces, 2012, 4, 6005–6012 CAS.
- Y. Z. Jiang, T. Z. Yuan, W. P. Sun and M. Yan, ACS Appl. Mater. Interfaces, 2012, 4, 6216–6220 CAS.
- N. A. Kyeremateng, F. Vacandio, M. T. Sougrati, H. Martinez, J. C. Jumas, P. Knauth and T. Djenizian, J. Power Sources, 2013, 224, 269–277 CrossRef CAS.
- H. E. Wang, Z. G. Lu, L. J. Xi, R. G. Ma, C. D. Wang, J. A. Zapien and I. Bello, ACS Appl. Mater. Interfaces, 2012, 4, 1608–1613 CAS.
- H. T. Sun, G. Q. Xin, T. Hu, M. P. Yu, D. Shao, X. Sun and J. Lian, Nat. Commun., 2014, 5, 4526–4534 CAS.
- A. D. Bart, L. Dupont, P. Poizot, J. B. Leriche and J.-M. Tarascon, J. Electrochem. Soc., 2001, 148, 1266–1274 CrossRef.
Footnote |
| † Electronic supplementary information (ESI) available. See DOI: 10.1039/c5nj02006a |
| This journal is © The Royal Society of Chemistry and the Centre National de la Recherche Scientifique 2016 |

