 Open Access Article
Exploring the phase explosion of water using SOM-mediated micro-bubbles
Basudev
Roy
,
Mayukh
Panja
,
Subhrokoli
Ghosh
,
Supratim
Sengupta
,
Dibyendu
Nandy
and
Ayan
Banerjee
*
Indian Institute of Science Education and Research, Kolkata, Mohanpur 741246, India. E-mail: ayan@iiserkol.ac.in
First published on 11th November 2015
Abstract
The phase explosion of water at a solid–water interface has been typically observed experimentally with the use of pulsed lasers inducing cavitation bubbles near an absorbing surface. Here we show that a tightly focused CW laser beam can be used to achieve phase explosion in a microscopic domain inside a thin film of water in contact with a specially created soft-oxometalate (SOM) coated glass surface. The laser beam induces a homogeneously nucleated micro-bubble at the water–glass (SOM-coated) interface due to high absorptivity of the SOMs at the laser wavelength, and the very high light intensity at the laser spot (∼10s' of MW cm−2). Increasing the laser power creates an interesting variation in the size of the bubble formed due to convective effects, until a certain power level is reached at which the bubble size increases very drastically. We demonstrate using a simulation based on a solution of the heat equation at the glass substrate–water interface, and by experimental consistency checks, that the size of the bubble essentially traces phase explosion in superheated water. The sudden increase in the bubble size occurs when we approach the critical point of water beyond which it cannot exist as a liquid. The size variation of the bubble at lower laser powers also serve as a probe to the microscopic flows of water around the bubble, and could help modulate the size of SOM microbubbles in the context of controlled lithography.
1 Introduction
The critical temperature of water marks the regime where water cannot exist as a liquid under any applied pressure. Under normal boiling, this condition is rarely reached since water bubbles begin forming as a result of heterogeneous nucleation due to the presence of nucleation sites. If the heating occurs very rapidly, though, liquid water may reach a superheated state. Further heating may cause the superheated liquid to approach the spinodal line,1,2 and thus the critical temperature Tc, beyond which it becomes unstable, and often catastrophically relax to a two-phase liquid–vapor mixture.3 However, the onset of homogeneous nucleation often prevents superheated water from reaching the spinodal line. Homogeneous nucleation4–7 implies the spontaneous formation of vapor bubbles without the presence of nucleation sites, and often prevents superheated water from reaching the point of ‘explosive boiling’ or ‘phase explosion’ – typically observed when the temperature of the superheated liquid reaches at around 0.9Tc.8 Experimentally, this was first observed when Ruby laser radiation [λ = 690 nm] was incident on 100 to 200 μm colored water droplets with the energy density of the laser exceeding a threshold value.9It is well known that such phase explosion often occurs in thin water films in close proximity to absorbing substrates due to strong laser pulses,10 resulting in a variety of applications ranging from eye surgery,11,12 to steam cleaning of surfaces,13 and laser desorption mass spectrometry.14 Such phase explosion experiments are mostly conducted using pulsed lasers focused on metallic absorbing surfaces that are often specific to the wavelength of the pulsed laser. In this paper, we present a technique of investigating phase explosion in water by the use of homogeneously nucleated microbubbles in an aqueous dispersion of a soft oxometalate (SOM).15,16 The SOM dispersion is taken in a glass sample chamber, where the top surface of the chamber is pre-coated in selected regions by thin layers of crystalline SOMs.17 A continuous wave (CW) laser is then tightly focused to a diffraction limited spot (size ∼λ, where λ is the laser wavelength) on a SOM-coated region, so that the intensity at the focus is ∼few 10s' of MW cm−2 for less than 100 mW power of the CW laser. Note that the tight focusing addresses the requirement of large light intensity as provided by pulsed lasers typically used to form homogeneously nucleated microbubbles in water. The wavelength of light is chosen based on the fact that SOMs are highly absorptive at 1064 nm.17 The large laser intensity coupled with high absorption of the SOMs leads to the formation of a microbubble in the aqueous dispersion due to explosive boiling of water in the vicinity of the laser ‘hot spot’ on the glass surface. We proceed to study the size of the microbubble as a function of laser power and obtain clear signatures of phase explosion in water as we describe subsequently. Also, the process of growth of a cavitation bubble formed due to the incidence of pulsed laser is an adiabatic process. However, in the presence of a continuous wave laser, the very mechanism is different since energy is exchanged with the surroundings through the formation of surface tension gradients that drive Marangoni convection. The only constraint is that the temperature of the point of incidence of the laser is constant in time and so this mechanism can be called isothermal. This paper develops an approach to study the problem in such a case, and in general, helps develop a framework to allow the study of microfluidics in complex boundary conditions.
On another note, we have developed a new method of controlled lithography using thermo-optically manipulated microbubbles in an aqueous dispersion of SOMs.17 The method relies on Marangoni convection that initiates due to the temperature, and resultant surface tension gradient across the bubble which has one of its ends in contact with the laser ‘hot spot’, and the opposite end in water at a much lower temperature. The Marangoni convection leads to the flow of SOM particles in the aqueous dispersion towards the bubble that eventually adhere to the base of the bubble and undergo a phase transition to form crystalline SOMs. Manipulation of the bubble causes a continuous deposition of particles, thus creating controlled patterns.17 The pattern width depends on the size of the micro-bubble, which in turn is dependent on the heat dissipated from the hot spot in the aqueous dispersion. Thus, a study of the bubble size as a function of laser intensity provides valuable information about the dissipation of the heat locally, which in turn, is decided by the dynamics of the flow created by the bubble. Such a study also provides a means of manipulating the bubble size upon tuning the laser power and can be very useful for feedback protocols when trying to control the pattern widths in an automated fashion. The controlled creation of small bubbles can also be useful for manipulating the near field of light, having a significant reflectivity at the air–water interface,18 and could also affect surface plasmon propagation.19
2 Experimental system
The experimental system has been described in detail in ref. 17. Here we describe it briefly. The apparatus is developed around an optical tweezers system consisting of an inverted microscope (Zeiss Axiovert.A1) with a 100× high numerical aperture (NA) objective lens (NA = 1.41). The sample is taken inside a glass sample chamber constructed out of a glass microscope slide (top surface) and a cover slip (bottom surface) stuck together by a double-sided sticky tape. The top slide was pre-coated in microscopic regions with crystalline SOMs using the patterning method described in ref. 17. The sample consists of an aqueous dispersion of the SOM that was prepared by dispersing 817.6 mg of ammonium heptamolybdate tetrahydrate (from Sigma Aldrich) in 4 mL of water which was warmed until a homogeneous dispersion that scattered laser light was obtained. This led to the formation of SOM nanotube bundles, details of which can be found in ref. 15 and 16. The bundles are finally between 2–5 microns in size, and are rather arbitrarily shaped. This dispersion was then cooled to room temperature, and around 100 μL of it was typically taken in the sample chamber. A laser at 1064 nm (Lasever LSR1064ML) of maximum power 500 mW was coupled into the microscope using coupling optics consisting of mirrors and lenses, so that beyond the 100× objective, a focal spot of diameter of around 1 μm was obtained. This spot was aligned using the microscope scanning stage on a pre-coated SOM region of the top slide of the sample chamber with the help of a camera (Axiocam) attached to the side-port of the microscope. The maximum power obtained at the focal spot was around 100 mW, which was measured using a power meter probe (Thorlabs PM100D) that was placed on the exit pupil of the objective lens. Due to the high absorption of the coated SOMs and the high laser intensity at the focal spot, a bubble was formed around the laser ‘hot spot’. A schematic of the bubble grown on the top slide and the resultant convective flows is shown in Fig. 1(a). We will later go on to show why the formation of the bubble indeed marks superheating in water. The bubble was imaged by the microscope camera and its size was measured using a pixel to physical distance calibration provided in the camera software.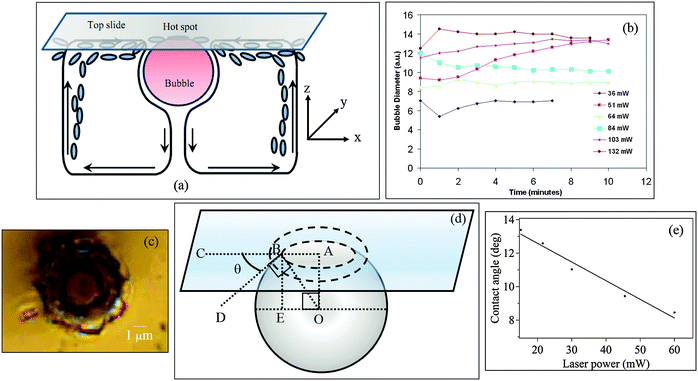 | ||
| Fig. 1 (a) Schematic of the bubble grown at the top slide. The onset of convection currents is depicted as arrows. The blue ovals are SOM particles converging towards the bubble base due to the flow. The figure is reproduced from ref. 17. The axes are provided to help understand the simulation for determining the temperature profile around the hot spot. (b) Growth of the bubble in a SOM suspension at different laser powers (measured at the microscope entry port). The bubble grows rapidly to a finite diameter and becomes constant as the ring of material is deposited at the base. (c) Material of crystallized SOMs deposited at the base of the bubble in the shape of an annular ring. (d) Our method to determine the contact angle of the bubble on the glass substrate. The angle θ is given by arcs in AB/BO. The ring of material at the bubble base is shown in dashed lines. (e) Plot of contact angles versus bubble diameter. | ||
3 Results and discussion
3.1 Experimental results
After determining that bubbles reached their equilibrium sizes very quickly, we performed two types of experiments on the size measurement of bubbles:
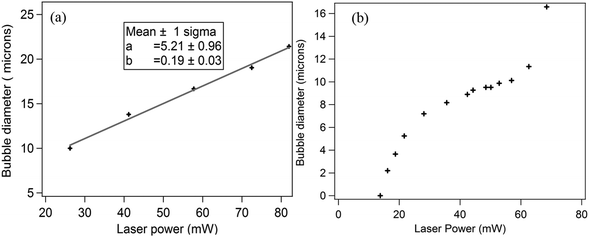
Type (a): increasing laser power for a single bubble: in this case, a single bubble was generated by the laser and the laser power was then increased gradually. The size of the bubble was measured from camera images at different powers (the power values are at the sample plane). At each value of laser power, the bubble diameter was measured after 10 seconds, by which time it reached the equilibrium diameter. Note that, once the bubble is formed, the dissipation of heat from the hot spot in the axial (z) direction occurs through the bubble. The results for one such bubble with increasing laser power is shown in Fig. 2(a). The bubble diameter increases linearly with power. The measured slope of the straight line fit basically shows the rate of growth of the bubble diameter with laser power.
Type (b): creating different bubbles at different laser powers: in this measurement design, the laser was used to generate new bubbles at different powers. The bubble diameter for each laser power was again measured after 10 seconds. After the measurement, the laser was turned off, and the bubble was allowed to shrink entirely. Then, the laser was turned on at a higher power to generate a new bubble, whose diameter was measured again. This procedure was repeated for different bubbles at increasing laser powers. Therefore, in these experiments, the dissipation of heat from the hot spot produced by the laser occurs through the liquid for all laser powers. The results are shown in Fig. 2(b).
We observe that in Fig. 2(b), the bubble diameter initially grows with laser power at a rate much higher than that in Fig. 2(a) (almost 4 times from a rough estimate of the respective slopes), the growth slows down at intermediate laser powers, and then increases sharply at even higher powers. In fact, we have just two points for the sharp rise of the bubble diameter, since on increasing the laser power value beyond around 70 mW, the size of the bubble was too large to fit on the camera field of view. This was repeated for different sets of experiments, and the sharp rise was always obtained.
It is therefore quite clear that the increase of the bubble diameter is very different with power for experimental types (a) and (b). The rather complicated behaviour of the bubble diameter against laser power for case (b) requires a thorough analysis of the system. An explanation would require us to understand the growth of the bubble, how it is related to the hot spot temperature and particularly how heat is dissipated in the aqueous medium, as is described later.
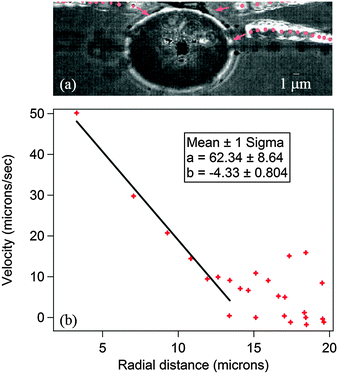
| vx = −4.33x + (mTH + n), or | (1) |
| vx = −4.33x + (k0 + k1TH) + k2(TH − Tth)2 | (2) |
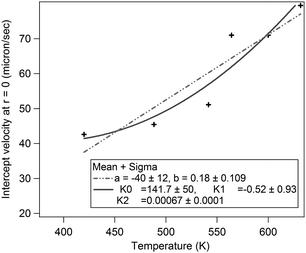 | ||
| Fig. 4 This figure shows the intercept of the linear region of the velocity–radius curve as a function of hot-spot temperature. This has been fitted with two different types of fits to determine which fits better. The first fit was a straight line of the form y = a + bx and the trend incorporated into eqn (1). The second trend was a quadratic of the form y = k0 + k1x + k2x2. Both the fits seem comparable in terms of errors, and so we applied them both to check best match of the simulations with experimental data. | ||
3.2 Theory and simulations
 | (3) |
 | (4) |
To determine the equilibrium radius, we developed a model in which we considered a glass–water interface (for simplicity we ignored the SOMs adsorbed on the glass surface) where a high temperature region of 1 μm diameter is created on the glass surface due to the tightly focused trapping beam. We then proceeded to solve the heat equation to find the 3-dimensional temperature distribution inside water due to the focused laser beam assuming a certain temperature of the hot spot. We estimated the critical radius for a bubble at each value of calculated temperature away from the hot spot.
The advection–diffusion partial differential equation when expressed in 2D Cartesian co-ordinates is
 | (5) |
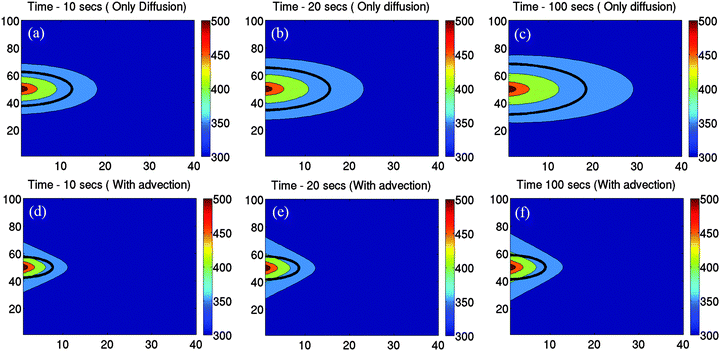 | ||
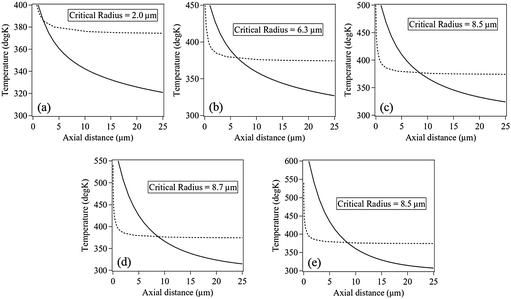
| Fig. 6 Simulation results to determine the evolution of the bubble size with time with only diffusion incorporated into the model (a)–(c), and diffusion + advection (d)–(f). The hot spot temperature is 550 K. The bubble size is indicated with the black bold line in each figure. The size is determined from the intersection of the critical radius curve and axial temperature distribution due to the hot spot as described in Fig. 3. It is clear that the bubble size increases continuously in (a)–(c), while it is almost constant in (e) and (f) with advection turned on. Advection also causes a smaller bubble size at a given time due to slower heat dissipation. | ||
The nature of bubble growth with time due to diffusion only is shown in Fig. 6(a)–(c). The temperature of the hot spot was 550 K for this particular simulation, and the evolution of the temperature distribution with the axial distance as a function of time is displayed in the figures. The calculated bubble size at each instant of time is shown by the bold black line. But we failed to recover the behaviour for intermediate laser powers in the curve obtained from experiment, shown in Fig. 2(b). This led us to add an extra convective term in the diffusion equation to take into account the flow of water that enhances the dissipation of heat from the hot-spot. The convection velocity used for the heat dissipation simulation uses the empirical trends that we obtained from the experiment, as defined in eqn (1) and (2). The convective/advective term impedes the growth of the bubble with time, as is apparent from Fig. 6(d)–(f). However, it is also clear that even with the advective term included, the bubble grows quite rapidly in early times (as seen in Fig. 6(d)), which implies that in such times the bubble growth is essentially diffusion driven. At later times, as shown in Fig. 6(e) and (f), the horizontal convective flows (that are converging in nature) dominate, causing large dissipation of heat which prevents the bubble from growing further. This also explains the large value of the slope between laser powers 14–28 mW in the data for experimental condition 2 as shown in Fig. 2(b), since in this regime the equilibrium diameter of the bubbles is rather small so that the diffusion term dominates over the advective term, and the size of the bubbles thus increase rapidly as the laser power is increased.
It is clear that bubble formation takes place only beyond a certain temperature of the hot spot. As this temperature is increased further, the formation of the bubble leads to convective flows which increase with the size of the bubble. This is because larger bubbles lead to larger temperature (resultant surface tension) gradients across them, and subsequently stronger Marangoni flows. The experimental results clearly demonstrate an inward flow towards the bubble, which implies a negative sign for the flow velocity that reduces the dissipation of heat from the hot spot, thus impeding the growth of the bubble. The theoretically obtained curves are shown in Fig. 7 at different values of convective flows (different colored continuous lines) along with the experimentally observed trend for comparison (in crosses). The red curve in Fig. 7 depicts the increase in the bubble radius as a function of hot spot temperature when the convection velocity is made zero. As can be seen, there is no plateau-like regime formed as the radius increases monotonically.
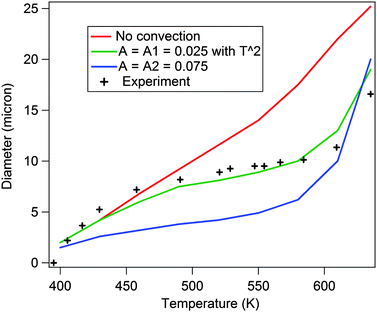 | ||
| Fig. 7 This indicates the theoretically computed diameters as a function of hot spot temperature. It shows how the curve compares to the experimentally obtained curve of the size of the bubble with illumination intensity. The plateau is obtained as the convection term is introduced with the velocity given by eqn (1). When the coefficient A = 0.025 the plateau is obtained. When the value of A is made even larger (A = 0.075), the radius of the bubble becomes too small in comparison to the experiment. To get a better match with the trend of the experimental curve, the intercept of eqn (6) has been modified to the form eqn (7) while having A = 0.025. | ||
Note that in this particular model, we are attempting to understand the situation before the bubble reaches equilibrium, or at time scales before the bubble is formed and when it is growing. The flow velocity trends in eqn (1) and (2) are for bubbles under equilibrium, so that the magnitude of the velocities would be different at times prior to this. Therefore, we use a scale factor to control the magnitude of the velocity. Thus, new equations for the velocity become:
| vx = A(−4.33x + (mTH + n)), and | (6) |
| vx = A(−4.33x + (k0 + k1TH) + k2(TH − Tth)2) | (7) |
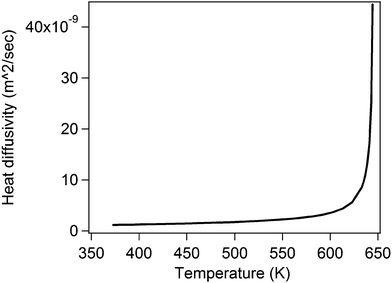 | ||
| Fig. 8 This plot shows the value of the thermal diffusivity as a function of temperature. The value of the diffusivity becomes very large as the critical temperature of water is reached. The different constants used for the diffusivity of water are obtained from the engineering tables.27 | ||
Thus, aided by the understanding of the results we obtained in Type (b) experiments, we are also able to fully comprehend the results obtained for Type (a). In that case, a single bubble was formed and the laser power subsequently increased for the same bubble. The increase in laser power increases the radial (along the x-axis) temperature profile which in turn modulates the temperature distribution in the liquid leading to an increase in temperature of the liquid near the bubble surface. For that enhanced temperature, the critical radius is smaller than the radius of the bubble which therefore becomes super-critical and starts expanding. The expansion continues until the bubble–water interface temperature intersects the new critical radius curve corresponding to the enhanced laser power. Since the laser power is increased after the bubble has formed, it is clear that the air inside the bubble provides some sort of a ‘shielding effect’ due to its much lower thermal conductivity compared to water (almost 30 times28), which prevents a larger increase in temperature near the bubble surface. The equilibrium radii of the bubble at each laser power is reached by an interplay of diffusion and convective flows, but as the laser power is subsequently increased, the bubble grows at a rate that is similar to the region where convective effects start dominating in experiments of Type (b). This can be easily seen by a quantitative comparison of the slopes of the bubble diameter vs. laser power plots in Fig. 2(a) and (b). The slope of the straight line in Fig. 2(a) is much lesser than the diffusion-dominated region of Fig. 2(b) (i.e. the region between laser powers 116–30 mW), but similar to that in the region where convection sets in (i.e. between laser powers 335–60 mW). The sharp increase in diameter due to hot spot temperatures nearing the critical temperature of water is never reached in Type (a) experiments since water is not in contact with the hot spot on the glass substrate due to the presence of the air-bubble. It can be hypothesized that the phase explosion akin to that seen in Type (b) experiments may be seen in this case as well for much higher laser powers than what we can presently achieve in our laboratory.
4 Conclusions
We have explored the spinodal limit in water by growing homogeneously nucleated bubbles in a soft oxometalate-water dispersion in contact with a glass substrate pre-coated with SOMs. The bubbles are grown by tightly focusing an optical tweezers laser beam at 1064 nm, where the soft oxometalates are absorbing on the pre-coated soft oxometalates so as to create a hot spot on the glass substrate. The size of the bubble is determined by the temperature of the hot spot that is controlled by the laser power. We observe that the equilibrium size of bubbles created at different laser powers is a function of the latter. The size increases linearly at a rather fast rate initially, and then slows down remarkably with change in laser power, before it increases drastically as the power is increased further. We explain this observation by a numerical simulation of the temperature profile around the hot spot created on the glass surface, where we determine the bubble size by calculating the critical radius (i.e. the maximum allowed size of the bubble) at each axial distance with a known value of temperature. The temperature of the hot-spot is held constant in the simulation. We observe that the experimental trend can be reproduced from simulation only by considering convective flows of water set in by the formation of the bubble – the effect of which increase as the bubble size increases, thus creating a large temperature gradient across it. The convection velocities are estimated experimentally by measuring the flow of polystyrene beads for equilibrium bubbles, and fitted to experimental data by a scale factor which we determine empirically. The simulated data matches with experiments quite well over the entire range of hot spot temperature only when we consider the values of diffusivity of water as a function of temperature, with the diffusivity increasing drastically near the critical point. This also establishes the fact that we do indeed approach the phase explosion point or spinodal limit of water. The bubble can thus serve as an efficient probe for investigating flows on a microscopic domain. The dependence of the bubble diameter on laser power is also useful in a technique we have recently developed in forming controlled patterns on a glass substrate by using a thermo-optically manipulated bubble.17 The pattern width depends on the bubble size, and knowing the laser power dependence of the bubble size would enable automation of the entire patterning process in the future.References
- V. Ginzburg and L. Landau, J. Exp. Theor. Phys. USSR, 1950, 20, 1064–1070 CAS.
- J. W. Cahn and J. E. Hilliard, J. Chem. Phys., 1960, 31, 688–699 CrossRef.
- A. V. Kuzikovskii, Izv. Vyssh. Uchebn. Zaved., Fiz., 1970, 5, 89–95 Search PubMed.
- M. Volmer and A. Weber, Z. Phys. Chem., 1925, 119, 277–285 Search PubMed.
- R. Becker and W. Doring, Ann. Phys., 1935, 24, 719–752 CrossRef CAS.
- J. Frenkel, J. Chem. Phys., 1939, 7, 200–201 CrossRef.
- J. B. Zeldovich, Acta Physicochim. USSR, 1943, 18, 1–3 Search PubMed.
- X. Xu, Appl. Surf. Sci., 2002, 197, 61–66 CrossRef.
- V. Kostin, V. A. Pogodaev, S. Khmelevtsov and L. K. Chistyakova, J. Exp. Theor. Phys. USSR, 1974, 66, 1970–1972 CAS.
- A. Vogel, N. Linz, S. Preidank and G. Paltauf, Phys. Rev. Lett., 2008, 100, 038102 CrossRef PubMed.
- A. Vogel, J. Noack, G. Huttman and G. Paltauf, Appl. Phys. B: Lasers Opt., 2005, 81, 1015–1047 CrossRef CAS.
- H. Soong and J. B. Malta, Am. J. Ophthalmol., 2009, 147, 189–197 CrossRef PubMed.
- A. Tam, H. K. Park and C. P. Grigoropoulos, Appl. Surf. Sci., 1998, 127, 721–725 CrossRef.
- Y. Dou, L. V. Zhigilei, N. Winograd and B. J. Garrison, J. Phys. Chem. A, 2001, 105, 2748–2755 CrossRef CAS.
- S. Roy, Comments Inorg. Chem., 2011, 32, 113 CrossRef CAS.
- S. Roy and A. Hor, J. Mol. Eng. Mater., 2014, 2, 1402001 CrossRef.
- B. Roy, M. Arya, P. Thomas, J. K. Jurgschat, K. V. Rao, A. Banerjee, C. Reddy and S. Roy, Langmuir, 2013, 29, 14733–14742 CrossRef CAS PubMed.
- X. Mao, J. Waldeisen, B. Juluri and T. J. Huang, Lab Chip, 2007, 7, 1303–1308 RSC.
- C. Zhao, Y. Liu, Y. Zhao, N. Fang and T. J. Huang, Nat. Commun., 2013, 4, 2305 Search PubMed.
- C. Sagui and M. Grant, Phys. Rev. E: Stat. Phys., Plasmas, Fluids, Relat. Interdiscip. Top., 1999, 59, 4175–4187 CrossRef CAS.
- N. B. Vargaftik, B. N. Volkov and L. D. Voljak, J. Phys. Chem. Ref. Data, 1983, 12, 817–820 CrossRef CAS.
- R. Reid, Properties of Gases and Liquids, McGraw-Hill Inc., 2nd edn, 1966 Search PubMed.
- J. M. A. Ashbourn, L. Geris, A. Gerisch and C. J. S. Young, Proc. R. Soc. London, Ser. A, 2010, 466, 1621–1643 CrossRef CAS.
- W. Press, S. A. Teukolsky, T. W. Vetterling and P. B. Flannery, Numerical Recipes in Fortran, Cambridge University Press India Pvt. Ltd, 1998 Search PubMed.
- P. Atkins and J. d. Paula, Physical Chemistry, W. H. Freeman, 8th edn, 2006, p. 21 Search PubMed.
- P. Rock, Chemical Thermodynamics, Macmillan, 1969, p. 123 Search PubMed.
- http://www.engineeringtoolbox.com/water-thermal-properties-d_162.html .
- http://www.engineeringtoolbox.com/water-thermal-properties-d_429.html .
| This journal is © The Royal Society of Chemistry and the Centre National de la Recherche Scientifique 2016 |

