 Open Access Article
Creative Commons Attribution 3.0 Unported Licence
High-throughput computational screening of nanoporous adsorbents for CO2 capture from natural gas†
Efrem Brauna,
Alexander F. Zurhelleab,
Wouter Thijssena,
Sondre K. Schnell ac,
Li-Chiang Linad,
Jihan Kime,
Joshua A. Thompsonf and
Berend Smit*aghi
aDepartment of Chemical and Biomolecular Engineering, University of California, Berkeley, Berkeley, CA 94720, USA. E-mail: berend-smit@berkeley.edu
bDepartment of Chemistry, RWTH Aachen University, Templergraben 55, D-52056 Aachen, Germany
cDepartment of Chemistry, Norwegian University of Science and Technology, 7491 Trondheim, Norway
dDepartment of Process and Energy, Delft University of Technology, Leeghwaterstraat 39, 2628 CB Delft, The Netherlands
eDepartment of Chemical and Biomolecular Engineering, Korea Advanced Institute of Science and Technology, 291 Daehak-ro, Yuseong-gu, Daejeon 305-338, Republic of Korea
fChevron USA Inc., 100 Chevron Way, Richmond, CA 94801, USA
gDepartment of Chemistry, University of California, Berkeley, Berkeley, CA 94720, USA
hMaterials Science Division, Lawrence Berkeley National Laboratory, 1 Cyclotron Road, Berkeley, CA 94720, USA
iInstitut des Sciences et Ingénierie Chimiques (ISIC), Valais, École Polytechnique Fédérale de Lausanne (EPFL), Rue de l'Industrie 17, CH-1951 Sion, Switzerland
First published on 14th June 2016
Abstract
With the growth of natural gas as an energy source, upgrading CO2-contaminated supplies has become increasingly important. Here we develop a single metric that captures how well an adsorbent performs the separation of CH4 and CO2, and we then use this metric to computationally screen tens of thousands of all-silica zeolites. We show that the most important predictors of separation performance are the CO2 heat of adsorption (Qst,CO2) and the CO2 saturation loading capacity. We find that a higher-performing material results when the absolute value of the CH4 heat of adsorption (Qst,CH4) is decreased independently of Qst,CO2, but a correlation that exists between Qst,CH4 and Qst,CO2 in all-silica zeolites leads to incongruity between the objectives of optimizing Qst,CO2 and minimizing Qst,CH4, rendering Qst,CH4 nonpredictive of separation performance. We also conduct a large-scale analysis of ideal adsorbed solution theory (IAST) by comparing results obtained using directly-generated mixture isotherms to those obtained using IAST; IAST appears adequate for the purposes of establishing performance trends and structure–property relationships in a high-throughput manner, but it must be tested for validity when analyzing individual adsorbents in detail since it can produce significant errors for materials in which there is site segregation of the adsorbate species.
Design, System, ApplicationDesigning adsorbents for the separation of natural gas components requires an understanding of how molecular structure affects gas adsorption. Such understanding can be gained through high-throughput screenings of material databases, which require a quantitative separation performance metric to evaluate the adsorbents. In this work, we develop such a metric and then use it to screen tens of thousands of all-silica zeolites in search of filling in crucial gaps of knowledge that remain in our understanding of CH4/CO2 gas separations using nanoporous materials, such as the seeming unimportance of the CH4 heat of adsorption to the design of an adsorbent and the validity of the commonly-used ideal adsorbed solution theory (IAST) to predict mixture isotherms from pure-component data. |
1. Introduction
Natural gas, composed largely of (CH4), is a large and growing part of the domestic and global energy portfolio, with total domestic production having grown by 35% from 2005 to 2013 and now representing 28% of total American energy consumption.1 Although this growth occurred for largely economic reasons as a response to the development of shale gas resources,1 since the carbon dioxide (CO2) emissions per unit of electricity are about half as large from natural gas power plants as from coal power plants, a shift from coal to natural gas may be an effective way to reduce anthropogenic greenhouse gas emissions during the transitory period toward a sustainable energy economy,2 though the practical achievement of these environmental benefits requires adequate controls of fugitive gas emissions.3,4 Additionally, since natural gas power plants have lower cycling times and costs than coal power plants, they can adjust more quickly to fluctuations in grid electricity demands:5 an advantage of increasing importance given the intermittency of many renewable energy sources such as wind and solar power.Prior to use, the natural gas must be treated to remove contaminants including acid gases such as CO2 and hydrogen sulfide, inert gases such as nitrogen (N2) and helium, and other species such as water and heavier hydrocarbons.6 CO2 is one of the most common impurities, and in addition to its presence decreasing the natural gas's heating value, it can cause problems during transportation by corroding pipelines or forming solids in cryogenic tanker trucks, necessitating purity specifications like <2 mol% CO2 for a natural gas pipeline.6,7
Porous solids can be used for the separation of CH4 and CO2via the processes of pressure-swing adsorption (PSA), temperature-swing adsorption (TSA), or a hybrid process (PTSA), in all of which the adsorption columns undergo a cycle of adsorption followed by a regenerating desorption cycle at conditions of decreased pressure and/or increased temperature. In order to find the optimal adsorbents for a particular separation, metrics are necessary to quantify an adsorbent's separation performance. Two of the most widely used metrics are the adsorption selectivity, defined as the ratio of the loading mole fractions divided by the ratio of the gas phase mole fractions, and the working capacity for each of the adsorbates, defined as the difference in loading of each adsorbate at adsorption and desorption conditions. These metrics are easily calculated from mixture adsorption isotherms, and many adsorbent screening projects have examined these metrics individually to evaluate an adsorbent at given adsorption and desorption conditions.8–12 However, the selectivity and working capacities are not necessarily representative of the economic drivers that chemical process designers actually consider;13,14 in fact, they can even be deceptive, as increasing the selectivity of an already highly selective material may provide no true improvement in performance, and recent process modeling studies have found no significant correlation between selectivity and process cost.15,16
Other metrics have been proposed as being more appropriate for the comparison of adsorbents. Rege and Yang17 and Wiersum et al.18 suggested multiplying the selectivities and working capacities in different manners to obtain metrics they called the sorbent selection parameter (S) and the adsorbent performance indicator (API). As we will show, these metrics can lead to undesirable results since they directly include the selectivity, which is unbound and can approach infinity. Some studies have created metrics that aim to provide a more direct representation of the process economics. For example, in the CO2/N2 gas separation being investigated for carbon capture and storage (CCS) from the flue gas of fossil-fuel powered power plants, the economic driver is the energy cost of the separation, which has been estimated to parasitically reduce the net output of power plants by 30%.13 This parasitic energy has been simply estimated as a sum of the thermal energy required to desorb the adsorbate and of the compression work by Lin et al.,13 and Maring and Webley14 has developed a simplified process model to estimate the power required for the vacuum pump. Of course, a full process modeling analysis provides the most realistic cost estimates, but such detailed process modeling can be computationally expensive and thus unfeasible for a high-throughput screening study.15,16 Additionally, such process modeling requires expertise beyond what many researchers studying adsorption science possess.14
In this contribution, we first develop a single simple metric that is representative of the economic drivers behind the CH4/CO2 gas separation required for upgrading various natural gas sources to pipeline quality, which we call the separation performance parameter (SPP). We then use this metric to explore the separation performance and structure–property relationships of tens of thousands of all-silica zeolites taken from the International Zeolite Association (IZA) database19 and the predicted crystallography open database (PCOD) of hypothetical zeolites,20 using a high-performance GPU grand-canonical Monte Carlo (GCMC) code to directly-generate mixture isotherms.21–26 Finally, we take the opportunity afforded by the large amount of data collected in this study to evaluate the accuracy of ideal adsorbed solution theory (IAST),27 a prominent technique to generate mixture adsorption isotherms. Details of the methods used in this work can be found in the ESI.†
We considered three different sources of natural gas, all at a temperature of 300 K and assumed to be a binary mixture of CH4 and CO2: (1) landfill fill gas (LFG), produced by microorganisms acting upon municipal wastes, assumed to contain 60 mol% CH4 at a total pressure of 1 bar, (2) associated petroleum gas (APG), found in oil reservoirs, assumed to contain 90 mol% CH4 at a total pressure of 7 bar, and (3) non-associated gas (NAG), found apart from oil, assumed to contain 90 mol% CH4 at a total pressure of 70 bar.6 These pressures and temperatures were used as the adsorption conditions. As different materials perform optimally at different conditions, we evaluated each material at desorption conditions that optimize its SPP to allow for fair comparison.
2. Metric development
We chose to model the natural gas upgrading process as one in which CO2 is selectively adsorbed for several reasons. As CO2 tends to adsorb onto zeolites more strongly than CH4 due to its quadrupole moment, more zeolites will be capable of performing this separation, with about 90% of the hypothetical zeolites having a CO2 selectivity greater than 1 at conditions of 1 bar total pressure, 300 K, and 90 mol% CH4. Furthermore, in making the raffinate the high-value stream, there is no energetic cost to performing PSA down to atmospheric pressure since there is no need to compress the product,6 unlike in CCS and other adsorption processes where the adsorbed gas is the desired product. Finally, in adsorbing the minor component in the processes we analyzed, cycle times and energetic costs are expected to be less.Upgrading natural gas requires the examination of multiple costs to evaluate the economics of different adsorbents. The fixed costs vary with the size of the adsorption column and thus the amount of adsorbent required for the separation. The variable costs include the energy required for operating the adsorption column. A high fractional CH4 recovery is also desirable to reduce the variable cost of the feed gas as well as to reduce the loss of CH4 to the atmosphere with the waste CO2. If equilibrium adsorption and desorption are assumed, i.e., the mass transfer zone length approaches 0, these metrics can be individually calculated given mixture adsorption isotherms, as shown below. They can also be grouped into a single objective function to form a multiple-input single-output optimization problem, with the inputs being the desorption pressure (PSA), desorption temperature (TSA), or both (PTSA), and the output being the objective function value (OFV). By varying the inputs to minimize the OFV, one finds the optimal desorption conditions for a given adsorbent.28,29 The better-performing adsorbents will have a lower OFV, which leads us to term the inverse of the OFV the separation performance parameter (SPP), which we use to evaluate the screening results.
It would seem that the objective function that most appropriately captures the process economics would be a summation of the capital and operating expenditures of the separations plant. However, our goal of creating a simple and nonephemeral metric (the value of which is not dependent on present market conditions) precludes such a calculation. Instead, we will assume that the mass of adsorbent, energy, and fractional CH4 recovery are equally important economic drivers, and we will then go on to show that this assumption results in a metric that closely agrees with the economic results of a more detailed process simulation study. Thus we use as a definition of the OFV and SPP:
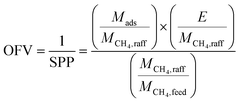 | (1) |
The first term in eqn (1) is the mass of adsorbent required per mole of CH4 captured in one batch adsorption–desorption cycle:
 | (2) |
 can alternatively be thought of as a proxy for the cycle time of a batch when comparing equally-sized columns. Eqn (2) may be further understood in the context of two extremes. A perfectly selective adsorbent will have ΔqCH4 = 0, and if yCH4,raff is set to 1, then
  is simply equal to
  . At the other extreme, as a material's ratio of
  increases, approaching the ratio of
  , less and less separation will be performed and
  will approach infinity. Materials with a working capacity ratio exceeding this limit will have a required mass of adsorbent that is negative, and cannot perform the given separation.
If yCH4,raff is set to 1, one obtains the mass of adsorbent required to capture a mole of CH4 in an adsorption column operated until the column is completely saturated. Alternatively, one may set yCH4,raff to the purity required for a specific application, which corresponds to an adsorption column with a mass transfer zone length approaching 0 that is operated beyond initial breakthrough in order to obtain more product which on average still meets its specifications. The latter option was chosen for this study, and yCH4,raff was set to 98 mol% CH4.
The second term in eqn (1) is the energy required per mole of CH4 captured:
 | (3) |
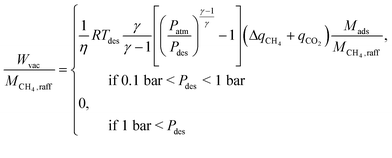 | (4) |
The third term in eqn (1) is the fractional CH4 recovery:
 | (5) |
Using eqn (2)–(5) we can calculate the OFV and SPP in eqn (1) at a given desorption pressure and desorption temperature. The components of the objective function given by these equations can be individually evaluated, but they cannot necessarily be individually used as the full objective function to find the optimal desorption conditions because this can result in desorption conditions that are at the most extreme values allowed. For example, if one were to attempt to minimize the mass of adsorbent metric for a PSA process, one would arrive at a desorption pressure of 0.1 bar for every material as there would be no energetic penalty.
We have placed the computer code we developed for the screening online with the Open Science Framework, along with the pure-component and mixture isotherms and the screening results.33 The code is capable of computing the SPP at optimized or set desorption conditions either by using input mixture isotherms or by using input pure-component isotherms to calculate mixture isotherms with IAST.
Separation performance parameter validity
At this point it is important to mention that a requirement imposed during the development of the SPP was that it be practical to compute the metric for thousands of materials, which precludes a full process design for all zeolites. We intended for the SPP to be representative of the most important economic drivers behind the CH4/CO2 gas separation. However, the particular form of the SPP (a product of factors) instead of the conventional sum of capital and operating costs assumes that all costs scale with the amount of adsorbent. In some important cases a significant fraction of the capital costs is independent of the amount of material, and if these capital costs dominate, the amount of material can become irrelevant. In addition, our study used isothermal working capacities to calculate the SPP for PSA processes whereas industrial adsorption columns operate under adiabatic conditions, which leads to lower working capacities.14 It is therefore important to compare the SPP with the separation costs calculated by a more detailed process engineering analysis which used adiabatic working capacities. First et al.16 conducted just such a study. From a database of 199 IZA zeolites, the authors selected 86 that topological analysis suggested would be viable for the CH4/CO2 separation, and adsorption isotherms indicated that 22 of these were highly selective for CO2. These 22 zeolites then underwent PSA process modeling and optimization to minimize the separation cost. Of the processes First et al.16 analyzed, the most similar to one of the three processes we analyzed was one which had adsorption pressures of 3 to 5 bar, desorption pressures of approximately 0.1 bar, and 90 mol% CH4: conditions quite similar to the APG process. The authors found that 8 zeolites could most feasibly perform the separation (ABW, AEN, AHT, APC, BIK, JBW, MON, and WEI), with the separation cost being practically identical among them. Of these top 8 performing zeolites, the SPP identified 4 as the top 4 materials of the 110 IZA zeolites we investigated, and the remaining 4 as being within the top 20 (Table S2†). These results indicate that the SPP is a reasonable indicator of separation performance.To further justify the need to use the SPP, we can compare it to alternative metrics that have been given earlier, such as the sorbent selection parameter (S) of Rege and Yang:17
 | (6) |
 is the selectivity for species i over species j at adsorption or desorption conditions. The sorbent selection parameter seemingly has the advantage of being simpler than the SPP in eqn (1), though the only additional data required by eqn (1) are the heats of adsorption and an estimate for the specific heat of the adsorbent (with the latter being unnecessary for the evaluation of a PSA process). Indeed, we found that the sorbent selection parameter compared as favorably with the results of First et al.16 as the SPP, with the 8 top performing zeolites all being within the top 20 zeolites as ranked by the sorbent selection parameter (2 were tied for first with 11 zeolites that had infinite selectivity for CO2, and 6 were ranked within 12–20), so a justification for the value of the SPP is wanted.
Fig. 1 shows the relationship between the SPP developed in this work and the sorbent selection parameter for the APG process carried out with PSA at a set desorption pressure, which is representative of the results for the other two processes as well. A close correlation between the two metrics can be observed, though the metrics begin to differ for the top-performing materials, with the sorbent selection parameter being more variable than the SPP due to the selectivity being unbound. We examine a subset of materials selected for their deviating SPP and sorbent selection parameter in Table 1. Here, the undesirability of having a performance metric dependent on the unbound selectivity is demonstrated as all the materials in Table 1 have sufficiently low ΔqCH4 values such that additional decreases in ΔqCH4 should have little effect on separation performance, yet the sorbent selection parameter continues to increase as ΔqCH4 is negligibly decreased despite much more significant decreases in ΔqCO2; for example, compare PCOD8294501 and PCOD8310046 in Table 1: both have ΔqCH4 two orders of magnitude lower than ΔqCO2 and thus effectively zero, yet the sorbent selection parameter of PCOD8294501 is greater than that of PCOD8310046 despite the latter's much larger ΔqCO2. Furthermore, for materials which do not load any CH4 at all, the selectivity for CO2 goes to infinity and yields sorbent selection parameter that are uncomparable. Overall, the use of the sorbent selection parameter can thus mislead scientific efforts focused on finding the highest-performing materials.14
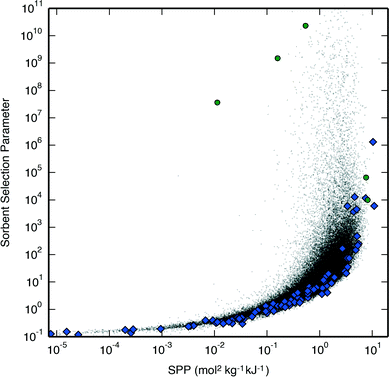 | ||
| Fig. 1 A correlation between the SPP and the sorbent selection parameter for the APG process carried out with PSA at set desorption conditions of 1 bar and 300 K. Hypothetical zeolites are shown as black dots, IZA zeolites are shown as blue diamonds, and the hypothetical zeolites in Table 1 are shown as green circles. | ||
| Adsorbent | ΔqCH4 (mol kg−1) | ΔqCO2 (mol kg−1) | SPP (mol2 kg−1 kJ−1) | S |
|---|---|---|---|---|
| PCOD8294501 | 1 × 10⁻⁵ | 0.005 | 0.01 | 3.6 × 10⁷ |
| PCOD8164653 | 8 × 10⁻⁶ | 0.063 | 0.16 | 1.5 × 10⁹ |
| PCOD8306302 | 4 × 10⁻⁶ | 0.192 | 0.54 | 2.3 × 10¹⁰ |
| PCOD8238989 | 7 × 10⁻² | 2.359 | 8.18 | 9.9 × 10³ |
| PCOD8310046 | 3 × 10⁻² | 2.550 | 7.71 | 6.6 × 10⁴ |
In addition, the sorbent selection parameter cannot be used to find the optimal desorption conditions for a given adsorbent,14 as we found that the ratio of working capacities was almost always more sensitive to a change in desorption conditions than the selectivity at desorption conditions (the selectivity at adsorption conditions does not change as a function of desorption conditions). For example, with PSA the sorbent selection parameter was almost always maximized at either the lowest or the highest allowed desorption pressure, simply depending on whether the relative change in ΔqCH4 or ΔqCO2 is greater as a function of desorption pressure (it was very rare for the relative changes to become equal in the desorption pressure range allowed). This can be unrelated to the adsorbent's performance, e.g., for an adsorbent very selective for CO2 one may find that the sorbent selection parameter is maximized at a high desorption pressure because negligible changes in ΔqCH4 have a greater impact on the working capacity ratio than significant changes in ΔqCO2. Thus, the sorbent selection parameter cannot be used if one is interested in finding optimal desorption conditions.
We similarly compared the SPP to the alternative metric of the adsorbent performance indicator (API) given by Wiersum et al.:18
 | (7) |
However, the adsorbent performance indicator is highly correlated with the sorbent selection parameter, and suffers from much the same problems (Fig. S1†).
3. Results and discussion
3.1 Screening
We first investigated the relative merits of PSA and TSA by examining the optimal desorption pressure and desorption temperature for the IZA zeolites undergoing PTSA processes. For all three process, less than 10% of the zeolites displayed an optimal desorption temperature above 305 K, with most materials benefiting more from pulling vacuum than from a temperature-swing (Fig. S2†). For the few zeolites that had a higher optimal desorption temperature, PTSA only negligibly increased the SPP from its value with PSA, so the temperature-swing does not appear to be truly beneficial for any material; conversely, PTSA significantly increased the SPP of several materials compared to that obtained with TSA, demonstrating that pulling vacuum can be truly beneficial (Fig. S3†). In industrial practice as well, PSA is generally preferable to TSA due to a shorter cycle time and lower complexity.6 It was thus concluded that only PSA processes need be analyzed for the larger datasets studied herein.PSA screening was then performed for the three processes using all IZA and hypothetical zeolites. Optimal desorption pressures and the resulting SPP are given for the IZA zeolites in Tables S1–S3,† from which a list of top-performing materials can be identified. For the hypothetical zeolites, we plot the SPP as a function of Qst,CO2 and the CO2 saturation loading capacity (as obtained by fitting the pure-component isotherm) in Fig. 2, and we illustrate topologies and potential energy surfaces of some of the highest-performing frameworks in Fig. 3. The LFG, APG, and NAG processes exhibit different ranges of optimal Qst,CO2, centered around approximately 37, 35 and 32 kJ mol−1 respectively, decreasing with an increase in adsorption pressure as predicted by theory.34 Although these optimal Qst,CO2 values are different from each other, they are not so different that the zeolites' SPP for different processes are not well-correlated with each other (Fig. S4†). However, this finding of zeolite performance being correlated between processes may be specific to our choice of processes, which exhibit some overlap in the CO2 partial pressures over which they cycle; processes with a smaller overlap may in fact exhibit unique optimal adsorbents.8,11 Our optimal Qst,CO2 values are larger than those found in a screening of a large database of hypothetical metal–organic frameworks (MOFs) by Wilmer et al.,11 where processes similar to the LFG and APG processes showed optimal sorbent selection parameter with materials having Qst,CO2 values centered around approximately 29 and 31 kJ mol−1, respectively. This is likely due in part to the different performance metric, pressures, and mole fractions used between our studies, and in part due to zeolites being more confining materials than MOFs, with typically smaller pores and void fractions35 that provide a larger decrease in entropy upon adsorption of CO2 and thus a larger optimal Qst,CO2.34
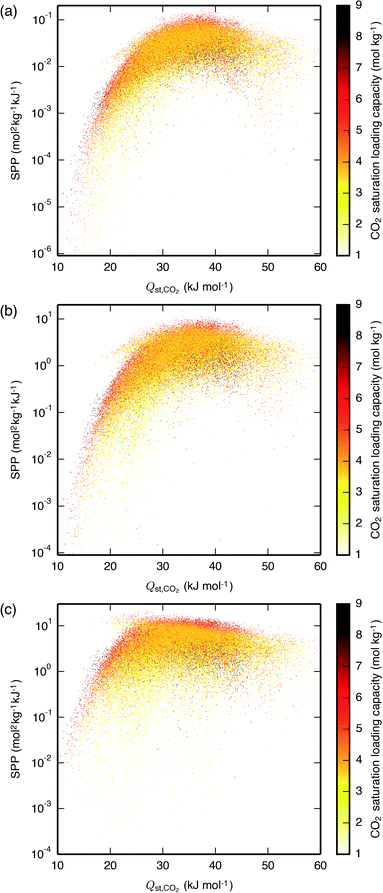 | ||
| Fig. 2 SPP of the hypothetical zeolites as a function of Qst,CO2 and the CO2 saturation loading capacity for the (a) LFG, (b) APG, and (c) NAG processes, all carried out with PSA. The materials are plotted in random order such that the data shown are representative of the materials hidden due to having similar Qst,CO2 and SPP. For the same plot with the IZA zeolites overlaid, see Fig. S5.† Similar results are also seen when using the CO2 Henry coefficient in place of Qst,CO2 (Fig. S6†). | ||
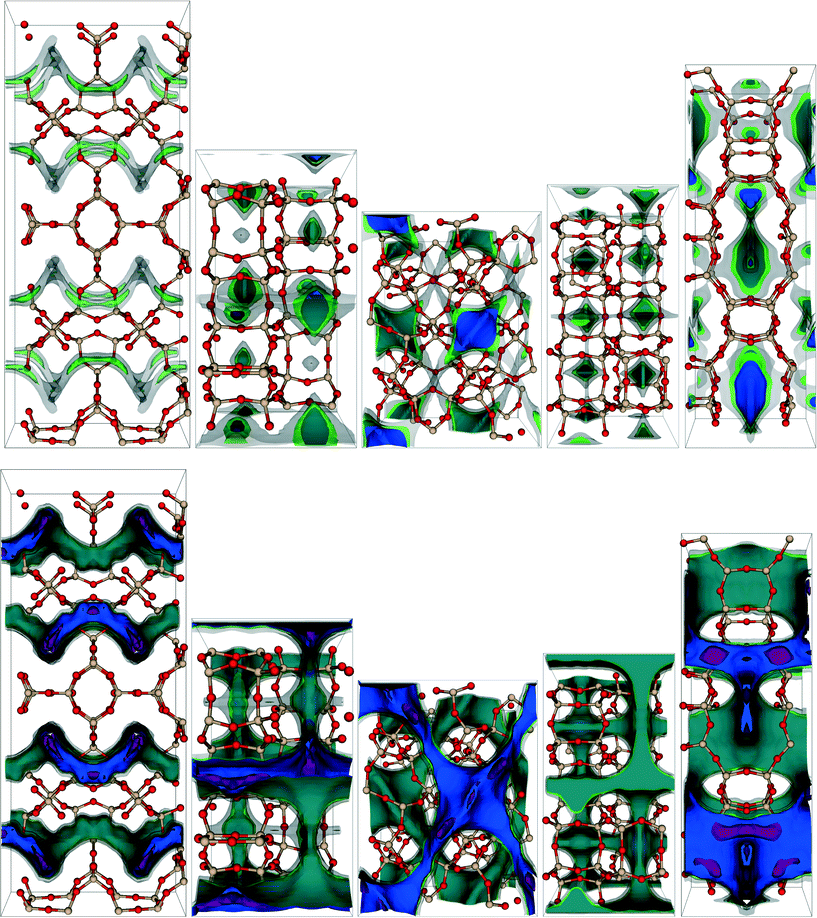 | ||
| Fig. 3 Visualization of the (top) CH4 and (bottom) CO2 potential energy surfaces of some of the top-performing hypothetical zeolites for the APG PSA process. From left to right, the zeolites shown are PCOD8284104, PCOD8246225, PCOD8184913, PCOD8246205, and PCOD8310046. Contours correspond to potential energies of −30 kJ mol−1 (purple), −10 kJ mol−1 (blue), 0 kJ mol−1 (green), and 37.4 kJ mol−1 (gray), with the last representing the limits of accessible channels, approximately defined as 15R × 300 K, which our GPU GCMC code uses to determine blocked pockets inaccessible from the gas phase, which are then eliminated from use as possible adsorption sites.21 The second and fourth zeolites from the left demonstrate some CH4 blocked pockets. Both cage- and channel-containing topologies are seen in these top-performing materials. Framework silicon and oxygen atoms are beige and red. The CO2 potential energy shown at each grid point is a Boltzmann-weighted average of 1000 random rotations of the CO2 molecule about the carbon atom which remains stationary at the grid point.21,22 | ||
Within the optimal ranges of Qst,CO2, the best materials are those with a sufficiently large CO2 saturation loading capacity. The range of the SPP for all materials spans several orders of magnitude; by selecting only those materials with near-optimal Qst,CO2 values, the range is reduced but still spans orders of magnitude, and by filtering out the materials with too low a CO2 saturation loading capacity the variability is reduced further. As others have found in large database screenings, bounds on the optimal performance of materials appear to follow simple functions of descriptors, but a given material's performance cannot be perfectly predicted with these same descriptors.11,13
3.2 Performance prediction
One wishes to find material descriptors that allow one to predict a zeolite's performance. For this purpose there exist several well-established geometric descriptors of porous media including void fraction (as measured using a helium atom probe), crystal density, accessible surface area, largest included sphere diameter (largest sphere that can fit inside the material), and largest free sphere diameter (largest sphere that can diffuse through the material).36,37 In addition, the pure-component isotherm descriptors Qst and saturation loading capacity are available for each adsorbate. To determine which of these descriptors are the most important predictors of an adsorbent's performance, we used a random forest machine learning algorithm,38,39 a method that Simon et al.40 used to screen similar materials for a Xe/Kr separation process and which provides a quantitative measure of a descriptor's importance to improving the quality of prediction. Since it has been shown that the helium void fraction and the crystal density are strongly negatively correlated while the largest included sphere diameter and the largest free sphere diameter are strongly positively correlated,40 we did not include the crystal density and the largest free diameter as descriptors in the regression; we verified that switching these choices did not give qualitatively different results.Results from performing the random forest regression on all three processes are shown in Fig. 4. The CO2 isotherm descriptors show the greatest influence. Fig. 2 and 4 both show that for the high-pressure NAG process, the SPP becomes less dependent on Qst,CO2 and more on the CO2 saturation loading capacity, which can be easily rationalized based on the shape of a Langmuir isotherm, which is more sensitive to the Henry coefficient (and thus Qst) at low pressures and saturation loading capacity at high pressures.
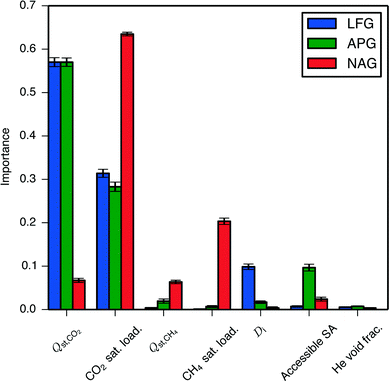 | ||
| Fig. 4 Importance of geometric and isotherm descriptors to the SPP of the hypothetical zeolites undergoing PSA processes, as determined using a random forest of decision trees. The importance of a descriptor is calculated by summing the reductions in mean squared error brought about at each node where that descriptor splits a decision tree, averaging over all decision trees, and normalizing.41 Here, sat. load. is the saturation loading capacity, Di is the largest included sphere diameter, Accessible SA is the accessible surface area, and He void frac. is the helium void fraction. | ||
That the isotherm descriptors proved more important than the geometric descriptors is not altogether surprising. Separation performance is directly dictated by a material's adsorption isotherms, which in turn are determined by a zeolite's topology; thus, the geometric descriptors are at least one step further from separation performance than isotherm descriptors. Less intuitive is the seemingly minor role taken by the CH4 isotherm descriptors. The low importance of the CH4 isotherm descriptors cannot be attributed to the presence of a correlation with the CO2 isotherm descriptors corrupting the regression results, as scatter plots show no clear relationship between CH4 isotherm descriptors and the SPP, while the CO2 isotherm descriptors are seen to create upper and lower limits on an adsorbent's performance (Fig. S7–S9†).
The effect of the CH4 isotherm descriptors' influence on separation performance is complicated by the fact that the CH4 and CO2 isotherm descriptors are correlated (Fig. 5). While saturation loading capacities of the two species may be difficult to decouple due their heavy dependence on an adsorbent's topology, Qst,CH4 and Qst,CO2 can be separately tuned by taking advantage of the molecules' difference in electrostatics. It would therefore be useful to observe the effect of removing this correlation and then varying the Qst of one adsorbate while keeping the Qst of the other adsorbate constant. We accomplished this by varying the guest–host force field parameters for one adsorbate at a time, i.e. to see the individual effect of Qst,CH4, the CH4–Ozeo epsilon parameter of the Lennard-Jones potential was varied above and below its original value, while the individual effect of Qst,CO2 was observed by varying the CCO2–Ozeo and OCO2–Ozeo epsilon parameters. The resulting Qst are shown along with the SPP of the PSA APG process for a subset of the IZA zeolites in Fig. 6. It can be seen that lowering Qst,CH4 independently of Qst,CO2 increases performance for a range of zeolites nearly uniformly, with the SPP approaching limiting values where no CH4 adsorbs at all. Conversely, Qst,CO2 exhibits an optimal value unique to each zeolite and process, with performance getting worse as Qst,CO2 decreases or increases from this optimal value. For several of the zeolites, the Qst,CO2 graph is broadly peaked, with the SPP remaining near its maximum value over a range of about 10 kJ mol–1. The top-performing zeolites seem to exhibit a Qst,CO2 near their optimal values, but there clearly exist materials which would perform poorly even at their optimal Qst,CO2 due to a low CO2 saturation loading capacity. Overall, an ideal material with uncorrelated heats of adsorption for CH4 and CO2 would exhibit a very small Qst,CH4 and an appropriately-sized Qst,CO2.
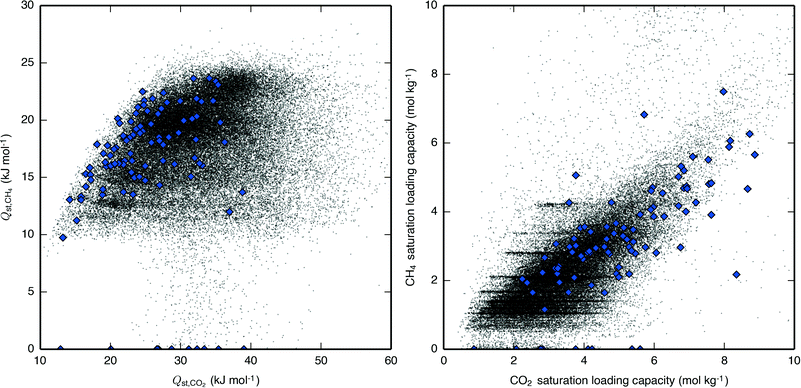 | ||
| Fig. 5 Correlations between (left) Qst,CH4 and Qst,CO2 and (right) saturation loading capacities of CH4 and CO2. Hypothetical zeolites are shown as black dots and IZA zeolites are shown as blue diamonds. The stripes seen in the CH4 saturation loading capacity are due to that variable being more likely to be integer values of CH4 molecules per unit cell (Fig. S10†). | ||
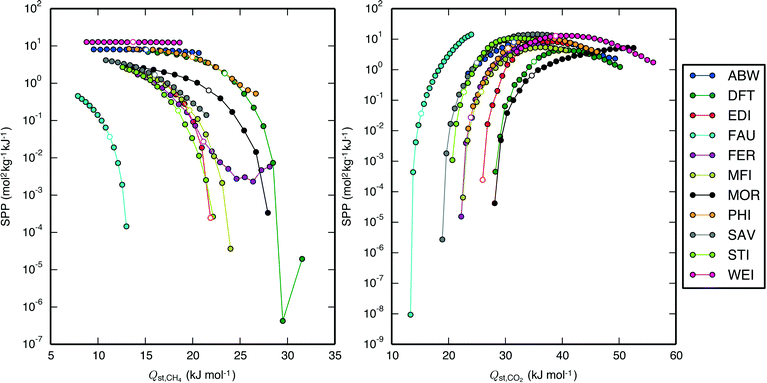 | ||
| Fig. 6 SPP of a subset of IZA zeolites undergoing the APG PSA process as a function of (left) Qst,CH4 and (right) Qst,CO2. The points with white marker color represent the data with original guest–host epsilon parameters of the Lennard-Jones potential (115 K for CH4–Ozeo, 50.2 K for CCO2–Ozeo, and 84.93 K for OCO2–Ozeo). (Left) The CH4–Ozeo epsilon value was varied between 75 K and 155 K in increments of 5 K (4.35% of the original value), with larger values resulting in a larger Qst,CH4. (Right) The CCO2–Ozeo epsilon value was varied between 32.128 K and 88.603 K in increments of 2.259 K while the OCO2–Ozeo epsilon value was concurrently varied between 54.354 K and 149.904 K in increments of 3.822 K (both 4.50% of the original values), with larger values resulting in a larger Qst,CO2. When Qst,CH4 was brought too high or Qst,CO2 was brought too low, the material would become unfit for the separation, so these points are not shown. Note that the SPP of the zeolite WEI does not change with Qst,CH4 because CH4 loading is negligibly low at all Qst,CH4 values. Qualitatively similar results for the LFG and NAG processes are shown in Fig. S11 and S12.† | ||
To understand these trends, consider the argument of Bhatia and Myers34 that the working capacity of a single-component gas in a porous material is maximized at a particular Qst, which is simply demonstrated by finding the analytical maximum of the difference between loadings at two pressures of a Langmuir isotherm, and positing that the entropy of adsorption is similar in many materials. One expects a similar argument to hold for CO2 in our multicomponent separation, and one might also expect that to maximize the SPP, one would like a Qst,CH4 that is either much larger or much smaller than the Qst,CH4 that maximizes its single-component working capacity. Since a large Qst,CH4 takes adsorption sites away from CO2, it instead makes sense that the SPP increases with a decreasing Qst,CH4. Indeed, even for the zeolite FER, in which SPP is seen to increase with increasing Qst,CH4 beyond a certain point, the CO2 working capacity is decreasing, and the improved SPP is due only to the working capacity of CH4 decreasing at an even faster rate than that of CO2. Notably, the zeolites do not exhibit a single optimal Qst,CO2 but rather a range of optimal Qst,CO2 values, e.g., for the APG PSA process, the zeolites STI, WEI, and MOR exhibit optimal Qst,CO2 of 32, 41, and >50 kJ mol−1, respectively, reflecting the negation of the assumption of similar entropies of adsorption across all materials, which Simon et al.42 has recently demonstrated.
Since Qst,CH4 and Qst,CO2 are positively correlated, it becomes difficult to obtain an optimal Qst,CO2 while minimizing Qst,CH4, so Qst,CH4 becomes difficult to relate to a zeolite's performance, which explains the low importance of Qst,CH4 obtained from the regression. This understanding suggests that the ability to tune the CO2–host interaction potential independently of the CH4–host interaction potential can lead to higher-performing materials; this can be achieved in practice by changing the charges of framework atoms, more easily done with different material classes like cation-exchanged zeolites or MOFs.
3.3 Structure–property relationships
To aid in the design of new materials, it is preferable to be able to predict a material's performance based solely on geometric descriptors (e.g., helium void fraction, crystal density, accessible surface area, largest included sphere diameter, and largest free sphere diameter), and so we would like to eliminate the use of isotherm descriptors. Within a material class, one would expect this to be possible in theory, particularly for purely-siliceous zeolites as they have identical stoichiometric makeup. Since we have shown that isotherm descriptors are well-capable of predicting a zeolite's performance, if geometric proxies can be found that have a strong relationship with the important isotherm descriptors, the necessity for the isotherm descriptors should be able to be eliminated. However, while it is known that saturation loading capacities of both CO2 and CH4 can be predicted by several simple geometric descriptors, and past studies have shown a clear relationship between a material's largest sphere diameter and CH4 adsorption energetics,43 more complex descriptors are necessary to predict Qst,CO2 (Fig. S13 and S14†).44,45 Since we lack a simple geometric proxy for Qst,CO2, we will be unable to remove it from use. Indeed, although past screening studies have shown that purely geometric descriptors can predict performance for single-component gas storage of simple molecules like CH4,46 for more complicated multicomponent gas separation processes involving CO2 it has been found necessary for geometric parameters to be supplemented by Qst,CO2 or by both Qst values.11,47 It appears that the inclusion of Qst,CO2 (or a similar isotherm descriptor such as the Henry coefficient) as a performance predictor will be necessary until simple geometric descriptors that are well-correlated with Qst,CH4 are found.Conversely, one would expect to find the CO2 saturation loading capacity unnecessary because it seems to have strong relationships with several geometric descriptors. However, the relationship between the geometric descriptors and the SPP is more ambiguous than that between the CO2 saturation loading capacity and the SPP, so a simple heuristic cannot be deduced (Fig. S15–S20†), though the descriptor is less crucial for machine learning prediction.
3.4 IAST validity
As we have generated both pure and mixture adsorption isotherms for over 80![[thin space (1/6-em)]](https://www.rsc.org/images/entities/char_2009.gif) 000 zeolites, we can study the validity of the IAST assumption for nanoporous materials at a larger scale than has been attempted before. Many studies have evaluated the validity of IAST for a small number of materials.48–57 Of these, the ones that have focused on mixtures of CO2 and CH4 in zeolites and MOFs have generally found good agreement between IAST and mixture isotherms at low pressures but some divergence emerging at pressures above about 1 bar, with the various studies showing that divergence can manifest itself in several ways.48–52
000 zeolites, we can study the validity of the IAST assumption for nanoporous materials at a larger scale than has been attempted before. Many studies have evaluated the validity of IAST for a small number of materials.48–57 Of these, the ones that have focused on mixtures of CO2 and CH4 in zeolites and MOFs have generally found good agreement between IAST and mixture isotherms at low pressures but some divergence emerging at pressures above about 1 bar, with the various studies showing that divergence can manifest itself in several ways.48–52
One reason commonly cited for the violation of IAST is its assumption that the same adsorbent surface area is available to all adsorbate molecules,53,54 an assumption that Myers and Prausnitz27 acknowledged is invalid for molecular sieves, and which tends to be less valid at higher pressures as adsorbate molecules compete for adsorption sites and adsorbates become accommodated at less energetically favorable adsorption sites. Another reason commonly cited for the violation of IAST is its assumption of adsorbed-phase ideality,53 which also becomes less valid at higher pressures as higher adsorbate loadings are induced.
We compared mixture isotherm loadings obtained directly with those obtained through IAST, with results shown for a 60 mol% CH4 mixture in Fig. 7 and qualitatively similar results shown for a 90 mol% CH4 mixture in Fig. S21.† For CH4, it can be seen that at low pressures the IAST error is centered around 0, but as the pressure increases IAST tends to underpredict the loading, with errors becoming considerable by around 5 bar. For CO2, IAST brings about less bias at all pressures investigated. These divergence trends are similar to what was seen in Krishna and van Baten,50 where it was found that different adsorption sites (e.g., windows versus cages) contain different proportions of the two adsorbates; this leads IAST to anticipate greater competition between the adsorbates than actually occurs, and the loading of the weaker-adsorbing species is underpredicted. This type of error brought about by IAST due to site segregation can be eliminated by using a segregated IAST model.54
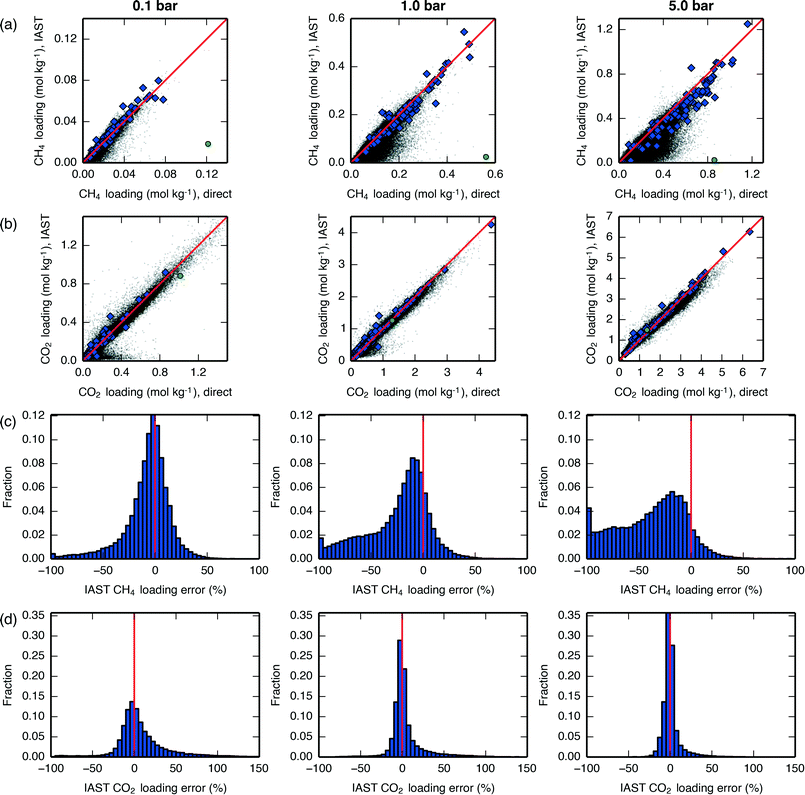 | ||
Fig. 7 Loadings of (a) CH4 and (b) CO2 at various total pressures, 300 K, and 60 mol% CH4. Data on the x-axis are taken from directly-simulated mixture isotherms, while data on the y-axis are taken from applying IAST to pure-component isotherms. A line is drawn at y = x for reference. Hypothetical zeolites are shown as black dots, IZA zeolites are shown as blue diamonds, and hypothetical zeolite PCOD8205017 is shown as a green circle. Histograms of the fractional IAST error  of the hypothetical zeolites for (c) CH4 and (d) CO2 at the same conditions. A line is drawn at x = 0 for reference. All plots in the left-column are at 0.1 bar, all plots in the middle-column are at 1 bar, and all plots in the right-column are at 5 bar. A similar plot showing results at 90 mol% CH4 is given in Fig. S21.† of the hypothetical zeolites for (c) CH4 and (d) CO2 at the same conditions. A line is drawn at x = 0 for reference. All plots in the left-column are at 0.1 bar, all plots in the middle-column are at 1 bar, and all plots in the right-column are at 5 bar. A similar plot showing results at 90 mol% CH4 is given in Fig. S21.† | ||
For both adsorbates and at all pressures, there exist materials in which IAST introduces large errors. One of the materials with the largest introduced error, PCOD8205017, was investigated in further detail. Pure-component and mixture isotherms of CH4 and CO2 in this material are shown in Fig. 8, where it can be seen that the directly-generated mixture isotherms are similar to the pure-component isotherms, and that IAST drastically underpredicts CH4 loading. The snapshots in Fig. 8 show that the CH4 and CO2 adsorbates occupy very distinct adsorption sites; these same sites are also preferentially occupied by each adsorbate during pure-component adsorption, so during mixture adsorption there is a lack of competition between adsorbates for adsorption sites until a pressure is reached at which one of the two sites becomes saturated. This extreme case of site segregation illustrates the dangers of not verifying the validity of IAST, as IAST results lead to the prediction that PCOD8205017 is a much higher-performing material than it actually is.
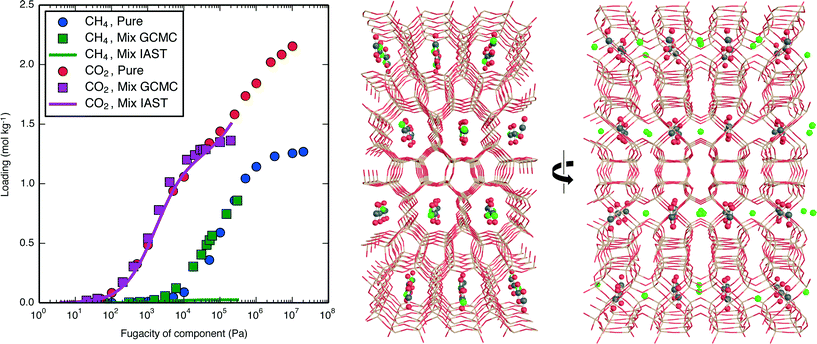 | ||
| Fig. 8 (left) Pure-component and mixture isotherms of CH4 (60 mol%) and CO2 (40 mol%) in the hypothetical zeolite PCOD8205017 at 300 K. Mixture isotherms are shown both as directly-generated from GCMC and as calculated from the pure-component isotherms using IAST.27 Unlike the isotherms used in the screening, these used the ideal gas equation of state to ensure consistency of units on the x-axis. (right) A snapshot of CH4 and CO2 in hypothetical zeolite PCOD8205017 taken from the mixture isotherm simulation conducted at CH4 and CO2 fugacities of 0.6 and 0.4 bar, respectively, shown at viewing angles orthogonal to each other. Framework silicon and oxygen atoms are beige and red, CH4 united atoms are green, and CO2 carbon and oxygen atoms are gray and red. | ||
By further examining the PCOD8205017 isotherms in Fig. 8, it can be seen that at certain points the uptakes are even larger in the directly-generated mixture isotherms than in the pure-component isotherms. This is due to the CH4–CCO2 and CH4–OCO2 adsorption site distances both being approximately 1.1 times their Lennard-Jones sigma values, near the potential's minimum. Thus, rather than following the IAST assumption that adsorbates compete for the same adsorption sites, this guest–guest nonideality instead makes the presence of the second adsorbate species conducive to the uptake of the first. That only small deviations from ideality occur despite such positioning of adsorption sites lends support to the ideality assumption of IAST and segregated IAST, as well as to a previous finding that guest–host interactions give rise to nonideality to a greater extent than do guest–guest interactions.58
For the purposes of high-throughput materials screening, a small number of outliers is less important than the introduction of systematic errors. To test whether IAST brought about systematic errors, we redid our earlier analysis of descriptors using the IAST results, and we obtained qualitatively-similar results, with the higher-pressure NAG process associated with a decrease in the optimal Qst,CO2 values and an increased dependence on the CO2 saturation loading capacity (Fig. S22 and S23†). Thus, IAST appears to be adequate for the purposes of performing high-throughput materials screening to find trends that relate structure to performance, but it must be tested for validity when performing detailed analyses of individual adsorbents.
4. Conclusions
In this work, we have developed the SPP metric, which avoids the pitfalls associated with other adsorption metrics such as the sorbent selection parameter and the adsorbent performance indicator: namely that they can overemphasize negligible gains in selectivity at the expense of more important changes in working capacity. Although the SPP was developed specifically for a process in which CO2 is adsorbed from a CH4/CO2 mixture, it can be easily adapted for other adsorption processes.The screening work that we then undertook with the SPP is complementary to several recent screening analyses of materials for CO2 capture.8,11–13,47,59–61 Similarly to several of these studies8,13,11 we found that Qst,CO2 should be neither too low nor too high to make an optimal material. We built on this finding to show that the CO2 saturation loading capacity is another important parameter to consider when designing materials, particularly for high-pressure processes. We then extended the theory of Bhatia and Myers,34 initially developed for storage of a single-component gas, to a multicomponent gas separation case by demonstrating that Qst,CH4 should be as low as possible to optimize separations, but that because Qst,CH4 is positively correlated with Qst,CO2, it misleadingly appears to be an unimportant parameter.
Since we chose to directly generate mixture isotherms rather than rely on the predictions of IAST, we were also able to perform a large-scale evaluation of the validity of IAST for siliceous zeolites. We found that IAST works reliably for the purposes of using high-throughput screening to find performance trends, but above about 5 bar IAST begins to underpredict the loading of CH4. At all pressures there exist zeolites for which IAST does not work, which we showed can be due to site segregation.
Acknowledgements
This research was supported through the Center for Gas Separations Relevant to Clean Energy Technologies, an Energy Frontier Research Center funded by the U.S. Department of Energy, Office of Science, Office of Basic Energy Sciences under Award DE-SC0001015. A. F. Z. thanks the German Academic Exchange Service (DAAD) for financial funding through the thematic network ACalNet. S. K. S. acknowledges financial support from the Research Council of Norway through a Post-Doctoral Fellowship, Grant No. 230534. E. B. acknowledges Cory M. Simon for helpful discussion and for a tutorial on machine learning, and Maciej Haranczyk for calculating the geometric descriptors of the hypothetical zeolites. J. A. T. acknowledges support from Alice He, Fermin Rodriguez, and Kamal Gursahani at Chevron.References
- Annual Energy Outlook 2015, U. S. Energy Information Administration technical report, 2015.
- S. Pacala and R. Socolow, Science, 2004, 305, 968–972 CrossRef CAS PubMed.
- R. W. Howarth, R. Santoro and A. Ingraffea, Clim. Change, 2011, 106, 679–690 CrossRef CAS.
- A. R. Brandt, G. A. Heath, E. A. Kort, F. O'Sullivan, G. Pétron, S. M. Jordaan, P. Tans, J. Wilcox, A. M. Gopstein, D. Arent, S. Wofsy, N. J. Brown, R. Bradley, G. D. Stucky, D. Eardley and R. Harriss, Science, 2014, 343, 733–735 CrossRef CAS PubMed.
- N. Kumar, P. Besuner, S. Lefton, D. Agan and D. Hilleman, Power Plant Cycling Costs, NREL subcontract report prepared by Intertek APTECH, 2012 Search PubMed.
- M. Tagliabue, D. Farrusseng, S. Valencia, S. Aguado, U. Ravon, C. Rizzo, A. Corma and C. Mirodatos, Chem. Eng. J., 2009, 155, 553–566 CrossRef CAS.
- S. Cavenati, C. A. Grande and A. E. Rodrigues, J. Chem. Eng. Data, 2004, 49, 1095–1101 CrossRef CAS.
- J. M. Simmons, H. Wu, W. Zhou and T. Yildirim, Energy Environ. Sci., 2011, 4, 2177–2185 CAS.
- Y. Bae and R. Q. Snurr, Angew. Chem., Int. Ed., 2011, 50, 11586–11596 CrossRef CAS PubMed.
- R. Krishna and J. M. van Baten, Phys. Chem. Chem. Phys., 2011, 13, 10593–10616 RSC.
- C. E. Wilmer, O. K. Farha, Y. Bae, J. T. Hupp and R. Q. Snurr, Energy Environ. Sci., 2012, 5, 9849–9856 CAS.
- J. Kim, A. Maiti, L.-C. Lin, J. K. Stolaroff, B. Smit and R. D. Aines, Nat. Commun., 2013, 4, 1694 CrossRef PubMed.
- L.-C. Lin, A. H. Berger, R. L. Martin, J. Kim, J. A. Swisher, K. Jariwala, C. H. Rycroft, A. S. Bhown, M. W. Deem, M. Haranczyk and B. Smit, Nat. Mater., 2012, 11, 633–641 CrossRef CAS PubMed.
- B. J. Maring and P. A. Webley, Int. J. Greenhouse Gas Control, 2013, 15, 16–31 CrossRef CAS.
- M. M. F. Hasan, E. L. First and C. A. Floudas, Phys. Chem. Chem. Phys., 2013, 15, 17601–17618 RSC.
- E. L. First, M. M. F. Hasan and C. A. Floudas, AIChE J., 2014, 60, 1767–1785 CrossRef CAS.
- S. Rege and R. Yang, Sep. Sci. Technol., 2001, 36, 3355–3365 CrossRef CAS.
- A. D. Wiersum, J.-S. Chang, C. Serre and P. L. Llewellyn, Langmuir, 2013, 29, 3301–3309 CrossRef CAS PubMed.
- C. Baerlocher and L. B. McCusker, Database of Zeolite Structures, http://www.iza-structure.org/databases/, Online; accessed Jan. 1, 2010 Search PubMed.
- R. Pophale, P. A. Cheeseman and M. W. Deem, Phys. Chem. Chem. Phys., 2011, 13, 12407 RSC.
- J. Kim, R. L. Martin, O. Rübel, M. Haranczyk and B. Smit, J. Chem. Theory Comput., 2012, 8, 1684–1693 CrossRef CAS PubMed.
- J. Kim and B. Smit, J. Chem. Theory Comput., 2012, 8, 2336–2343 CrossRef CAS PubMed.
- D. Frenkel and B. Smit, Understanding Molecular Simulation: From Algorithms to Applications, Elsevier Science, 2002 Search PubMed.
- E. García-Pérez, J. B. Parra, C. O. Ania, A. García-Sánchez, J. M. van Baten, R. Krishna, D. Dubbeldam and S. Calero, Adsorption, 2007, 13, 469–476 CrossRef.
- D. Peng and D. B. Robinson, Ind. Eng. Chem. Fundam., 1976, 15, 59–64 CAS.
- O. Talu and A. L. Myers, AIChE J., 2001, 47, 1160–1168 CrossRef CAS.
- A. L. Myers and J. M. Prausnitz, AIChE J., 1965, 11, 121–127 CrossRef CAS.
- E. Jones, T. Oliphant and P. Peterson, et al., SciPy: Open source scientific tools for Python, 2001, http://www.scipy.org/, Online; accessed Apr. 8, 2015 Search PubMed.
- H. Akima, J. Assoc. Comput. Mach., 1970, 17, 589–602 CrossRef.
- J. Boerio-Goates, R. Stevens, B. K. Hom, B. F. Woodfield, P. M. Piccione, M. E. Davis and A. Navrotsky, J. Chem. Thermodyn., 2002, 34, 205–227 CrossRef CAS.
- S. Krishnamurthy, V. R. Rao, S. Guntuka, P. Sharratt, R. Haghpanah, A. Rajendran, M. Amanullah, I. A. Karimi and S. Farooq, AIChE J., 2014, 60, 1830–1842 CrossRef CAS.
- J. M. Smith, H. C. Van Ness and M. M. Abbott, Introduction to Chemical Engineering Thermodynamics, McGraw-Hill, 7th edn, 2005 Search PubMed.
- E. Braun, A. F. Zurhelle, W. Thijssen, S. K. Schnell, L.-C. Lin, J. Kim, J. A. Thompson and B. Smit, High-Throughput Computational Screening of Nanoporous Adsorbents for CO2 Capture from Natural Gas, Open Science Framework, 2016, DOI:10.17605/OSF.IO/KTBY4, Online.
- S. K. Bhatia and A. L. Myers, Langmuir, 2006, 22, 1688–1700 CrossRef CAS PubMed.
- C. M. Simon, J. Kim, D. A. Gomez-Gualdron, J. S. Camp, Y. G. Chung, R. L. Martin, R. Mercado, M. W. Deem, D. Gunter, M. Haranczyk, D. S. Sholl, R. Q. Snurr and B. Smit, Energy Environ. Sci., 2015, 8, 1190–1199 CAS.
- T. F. Willems, C. H. Rycroft, M. Kazi, J. C. Meza and M. Haranczyk, Microporous Mesoporous Mater., 2012, 149, 134–141 CrossRef CAS.
- M. Pinheiro, R. L. Martin, C. H. Rycroft and M. Haranczyk, CrystEngComm, 2013, 15, 7531–7538 RSC.
- L. Breiman, Mach. Learn., 2001, 45, 5–32 CrossRef.
- F. Pedregosa, G. Varoquaux, A. Gramfort, V. Michel, B. Thirion, O. Grisel, M. Blondel, P. Prettenhofer, R. Weiss, V. Dubourg, J. Vanderplas, A. Passos, D. Cournapeau, M. Brucher, M. Perrot and E. Duchesnay, J. Mach. Learn. Res., 2011, 12, 2825–2830 Search PubMed.
- C. M. Simon, R. Mercado, S. K. Schnell, B. Smit and M. Haranczyk, Chem. Mater., 2015, 27, 4459–4475 CrossRef CAS.
- L. Breiman, J. Friedman, C. J. Stone and R. Olshen, Classification and Regression Trees, Chapman & Hall/CRC, 1984 Search PubMed.
- C. M. Simon, J. Kim, L.-C. Lin, R. L. Martin, M. Haranczyk and B. Smit, Phys. Chem. Chem. Phys., 2014, 16, 5499–5513 RSC.
- E. Haldoupis, S. Nair and D. S. Sholl, Phys. Chem. Chem. Phys., 2011, 13, 5053–5060 RSC.
- H. Amrouche, B. Creton, F. Siperstein and C. Nieto-Draghi, RSC Adv., 2012, 2, 6028–6035 RSC.
- E. J. García, J. Pérez-Pellitero, C. Jallut and G. D. Pirngruber, Phys. Chem. Chem. Phys., 2013, 15, 5648–5657 RSC.
- M. Fernandez, T. K. Woo, C. E. Wilmer and R. Q. Snurr, J. Phys. Chem. C, 2013, 117, 7681–7689 CAS.
- D. Wu, Q. Yang, C. Zhong, D. Liu, H. Huang, W. Zhang and G. Maurin, Langmuir, 2012, 28, 12094–12099 CrossRef CAS PubMed.
- R. Babarao, Z. Hu, J. Jiang, S. Chempath and S. I. Sandler, Langmuir, 2007, 23, 659–666 CrossRef CAS PubMed.
- H. Chen and D. S. Sholl, Langmuir, 2007, 23, 6431–6437 CrossRef CAS PubMed.
- R. Krishna and J. M. van Baten, Sep. Purif. Technol., 2008, 61, 414–423 CrossRef CAS.
- Y.-S. Bae, K. L. Mulfort, H. Frost, P. Ryan, S. Punnathanam, L. J. Broadbelt, J. T. Hupp and R. Q. Snurr, Langmuir, 2008, 24, 8592–8598 CrossRef CAS PubMed.
- S. E. Jee and D. S. Sholl, J. Am. Chem. Soc., 2009, 131, 7896–7904 CrossRef CAS PubMed.
- N. F. Cessford, N. A. Seaton and T. Düren, Ind. Eng. Chem. Res., 2012, 51, 4911–4921 CrossRef CAS.
- J. A. Swisher, L.-C. Lin, J. Kim and B. Smit, AIChE J., 2013, 59, 3054–3064 CrossRef CAS.
- A. Goj, D. S. Sholl, E. D. Akten and D. Kohen, J. Phys. Chem. B, 2002, 106, 8367–8375 CrossRef CAS.
- E. D. Akten, R. Siriwardane and D. S. Sholl, Energy Fuels, 2003, 17, 977–983 CrossRef CAS.
- M. Murthi and R. Q. Snurr, Langmuir, 2004, 20, 2489–2497 CrossRef CAS PubMed.
- M. Sakuth, J. Meyer and J. Gmehling, Chem. Eng. Process.: Process Intesif., 1998, 37, 267–277 CrossRef CAS.
- E. Haldoupis, S. Nair and D. S. Sholl, J. Am. Chem. Soc., 2012, 134, 4313–4323 CrossRef CAS PubMed.
- J. Kim, L.-C. Lin, J. A. Swisher, M. Haranczyk and B. Smit, J. Am. Chem. Soc., 2012, 134, 18940–18943 CrossRef CAS PubMed.
- J. Kim, M. Abouelnasr, L.-C. Lin and B. Smit, J. Am. Chem. Soc., 2013, 135, 7545–7552 CrossRef CAS PubMed.
Footnote |
| † Electronic supplementary information (ESI) available. See DOI: 10.1039/c6me00043f |
| This journal is © The Royal Society of Chemistry 2016 |
