
 Open Access Article
 This Open Access Article is licensed under a
 Creative Commons Attribution 3.0 Unported Licence
Small-molecule binding sites to explore protein–protein interactions in the cancer proteome†
David
Xu
ab,
Shadia I.
Jalal
c,
George W.
Sledge
Jr.
d and
Samy O.
Meroueh
*aef
aCenter for Computational Biology and Bioinformatics, Indiana University School of Medicine, Indianapolis, Indiana 46202, USA
bDepartment of BioHealth Informatics, Indiana University School of Informatics and Computing, Indianapolis, Indiana 46202, USA
cDepartment of Medicine, Indiana University School of Medicine, Indianapolis, Indiana 46202, USA
dDivision of Oncology, Stanford University Medical Center, USA
eDepartment of Biochemistry and Molecular Biology, Indiana University School of Medicine, 410 W. 10th Street, HITS 5000, Indianapolis, Indiana 46202, USA. E-mail: smeroueh@iu.edu; Fax: +1 (317) 278-9217; Tel: +1 (317) 274-8315
fStark Neuroscience Research Institute, Indiana University School of Medicine, Indianapolis, Indiana 46202, USA
First published on 5th July 2016
Abstract
The Cancer Genome Atlas (TCGA) offers an unprecedented opportunity to identify small-molecule binding sites on proteins with overexpressed mRNA levels that correlate with poor survival. Here, we analyze RNA-seq and clinical data for 10 tumor types to identify genes that are both overexpressed and correlate with patient survival. Protein products of these genes were scanned for binding sites that possess shape and physicochemical properties that can accommodate small-molecule probes or therapeutic agents (druggable). These binding sites were classified as enzyme active sites (ENZ), protein–protein interaction sites (PPI), or other sites whose function is unknown (OTH). Interestingly, the overwhelming majority of binding sites were classified as OTH. We find that ENZ, PPI, and OTH binding sites often occurred on the same structure suggesting that many of these OTH cavities can be used for allosteric modulation of enzyme activity or protein–protein interactions with small molecules. We discovered several ENZ (PYCR1, QPRT, and HSPA6) and PPI (CASC5, ZBTB32, and CSAD) binding sites on proteins that have been seldom explored in cancer. We also found proteins that have been extensively studied in cancer that have not been previously explored with small molecules that harbor ENZ (PKMYT1, STEAP3, and NNMT) and PPI (HNF4A, MEF2B, and CBX2) binding sites. All binding sites were classified by the signaling pathways to which the protein that harbors them belongs using KEGG. In addition, binding sites were mapped onto structural protein–protein interaction networks to identify promising sites for drug discovery. Finally, we identify pockets that harbor missense mutations previously identified from analysis of TCGA data. The occurrence of mutations in these binding sites provides new opportunities to develop small-molecule probes to explore their function in cancer.
Introduction
Cancer is a collection of more than 100 diseases that share a number of characteristics as defined by Hanahan and Weinberg:1 self-sufficiency in growth signals, insensitivity to growth inhibitory signals, evasion from programmed cell death (apoptosis), ability to undergo limitless cycles of cell growth, sustained ability to be supplied by blood (angiogenesis), and tissue invasion and spread to other parts of the body (metastasis). Large-scale sequencing studies of human tumors such as The Cancer Genome Atlas project (TCGA) provide an opportunity to uncover the genetic basis of the processes that drive cancer. Analysis of this genomic data has revealed that the complex phenotypes that define cancer are driven by tens of somatic mutations that occur on proteins across the cellular network.2 Recent whole genome sequencing studies have profiled the molecular signatures of individual tumors, including ovarian,3 colorectal,4 breast,5 renal,6 and lung7,8 cancer, to identify underlying driver mutations of each disease. Tumors were found to harbor tens of mutations. Whole-genome gene expression profiling studies have been instrumental not only in classifying tumors and uncovering genetic alterations in cancer cells (mutations, copy number, and rearrangements), but as a rich source of potential targets in cancer.9,10 A growing list of three-dimensional protein structures make it now possible to rationally develop small-molecule probes to explore these targets. Small-molecule probes can also provide leads for drug-discovery validation.TCGA is an ongoing effort that aims to catalog clinical and molecular profiles of tumor samples from over 30 cancer types to discover cancer-causing alterations in large cohorts through integrated multi-platform analyses. The project aims to integrate the clinical and molecular profiles of at least 500 tumors for each disease and to determine its underlying molecular mechanism. Multiple platforms capture the clinical, pathological, genomic, epigenomic, transcriptomic, and proteomic profiles of cancers in TCGA project. Among these platforms, RNA-seq is a widely-used technology for the characterization of mRNA expression. RNA-seq uses high-throughput short reads that offer several distinct advantages over its array-based predecessors. RNA-seq is not limited by a set of predetermined probes seen in microarrays, and is superior in its ability to identify low abundance transcripts, biological isoforms, and genetic variants.11 RNA-seq was performed for both tumor and normal tissue for each disease at TCGA. Comparison of tumor and normal mRNA levels can be used to identify overexpressed genes and their corresponding protein product that may contribute to tumor formation, progression, and metastasis. Patient information that accompanies the genomic data affords further analyses to assess the correlation of mRNA levels with patient outcome. Survival curves constructed by plotting patient outcome with time can be used to generate metrics such as hazard ratios and other coefficients to determine the correlation between overexpression of individual genes and clinical outcome. This analysis has been widely used in clinical trials, where Kaplan–Meier survival curves are used to determine the time-to-event differences between placebo and drug groups.12
Whether overexpressed genes contribute to the cancer phenotype must be confirmed in follow-up studies in vitro and in vivo, especially since studies have shown that there is not always a direct correlation between the levels of gene expression and the proteins that they encode.13–15 This is typically accomplished using molecular biology approaches such as RNAi16 or CRISPR/Cas917 technologies. A complementary approach is the use of small organic molecules that work by binding to well-defined cavities or binding sites on the surface of a protein and compete with the target's ligands either in an orthosteric or allosteric manner. Binding sites that are located at enzyme active sites, protein–protein interfaces, or known allosteric sites, have particular functional relevance. Identification of binding sites is accomplished by analyzing the three-dimensional structure of a protein. Several computational methods have been developed to scan the surface of proteins for binding sites.18 Binding site detection algorithms, such as CavBase,19 fpocket,20 and LIGSITECSC,21 often represent the protein structure through the use of points on a three-dimensional grid. Other algorithms, such as Q-SiteFinder,22 PocketFinder,23 and SiteHound,24 employ energy-based approaches to calculate interaction potentials at points in the grid and cluster favorable points together into binding sites. Finally, ensemble or combinatorial algorithms, such as SiteMap25 and metaPocket,26 use a combination of geometric and energy-based methods to identify potential binding sites.
Extensive data from TCGA combined with the exponentially growing structural data at the Protein Data Bank (PDB) offers a unique opportunity to identify protein structures of overexpressed or clinically-relevant genes in cancer. These structures can be used to scan for binding sites to develop chemical probes and lead compounds for drug discovery. In addition to detecting binding sites, algorithms have been developed to score these binding sites based on whether they can accommodate a small molecule. Both SiteMap and fpocket provide descriptors to assess binding sites that are suitable for small-molecule ligands based on the amino acid composition of the binding site and its collective physicochemical properties. SiteMap uses the hydrophobicity and accessibility of a detected binding site to assess how likely a small-molecule inhibitor will bind. It provides two scores, SiteScore and DrugScore. The latter score goes beyond just assessing a binding site for ligand binding. It measures whether a binding site is druggable, or whether it possesses similar properties to other binding sites that have led to FDA-approved drugs. fpocket provides a measure called the druggability score, which is a general logistical model based on the local hydrophobic density of the binding site, as well as a hydrophobicity and normalized polarity score. The discovery of binding sites within structures that are encoded by overexpressed genes with clinical relevance is highly significant as these binding sites can be used to develop novel cancer therapeutics that are likely to exhibit greater efficacy in humans.
In addition to druggability, the binding sites must be functionally important to serve as targets for small molecules. For example, binding sites located at enzyme active sites or at the interface between a protein–protein complex are expected to disrupt protein function. Protein kinases are one example of an enzyme class with druggable binding sites that occur at the enzyme active site.27 The ATP binding site of kinases is highly druggable with a SiteMap SiteScore and DrugScore above 1.1.28 There are fewer small-molecule inhibitors of protein–protein interactions, which is partly due to the lack of druggable binding sites at protein–protein interfaces. The only examples of PPI inhibitors that have shown in vivo efficacy, such as MDM2/p53 or BcL-xL, possess druggable binding sites (DrugScore of 0.92 and 0.82, respectively).29 Therefore, the identification of binding sites that are considered druggable at protein–protein interaction interfaces can provide new avenues to develop chemical probes and cancer therapeutics. Finally, it is worth mentioning that binding sites located outside an enzyme active site or protein–protein interface can also be functionally relevant. These binding sites may modulate protein function in an allosteric manner through long-range interactions that involve dynamic changes of the target protein.30–34 Allosteric inhibitors have been successfully used to inhibit kinase activity and in some cases, such as AKT, have shown more promise than competitive inhibitors.
Here, we collect gene expression profiles for 10 cancer types from TCGA and compare the expression profiles between cancer and normal samples to identify genes that are overexpressed in each cancer type. We search the Protein Data Bank for crystal structures of the protein products of these genes. We scan the surface of these proteins and identify binding sites. The functional relevance of these binding sites is explored by classifying them into known enzyme active sites, protein–protein interaction sites, or other sites that may lie outside of functional sites. To further explore the biological outcome of small molecules that bind to these binding sites, proteins harboring binding sites are further characterized in the context of a global PPI network and cancer signaling pathways to gain insight into the biological effect of binding at these binding sites. Patient data is used to investigate the correlation of overexpressed genes with clinical outcome. Our analysis uncovered new unexplored and potentially druggable and clinically-relevant protein targets. The study also provides new avenues for the rational design of small-molecule probes for well-established oncogenes. This is the first study that maps binding pockets on three-dimensional structures of the PDB within the context of cancer genomic data.
Results
Three-dimensional structures of proteins encoded by differentially-expressed genes
We collected mRNA gene expression profiles of 10 cancer types from TCGA: breast invasive carcinoma (BRCA), colon adenocarcinoma (COAD), glioblastoma multiforme (GBM), head-and-neck squamous cell carcinoma (HNSC), kidney renal clear cell carcinoma (KIRC), lung adenocarcinoma (LUAD), lung squamous cell carcinoma (LUSC), thyroid adenocarcinoma (THCA), triple-negative breast cancer (TNBC), and uterine corpus endometrioid carcinoma (UCEC). For each cancer type, we collected the gene expression profiles of both normal and tumor samples from RNA sequencing platforms using TCGA's Level 3 data. A search from among the 20![[thin space (1/6-em)]](https://www.rsc.org/images/entities/char_2009.gif) 192 reference proteins using UniProt35 identifiers led to 7044 proteins that are encoded by TCGA overexpressed genes (Table 1 and Table S1, ESI†). For each cancer type, we identified the number of overexpressed genes with protein products having at least one high-resolution crystal structure by mining the Protein Data Bank (PDB). A total of 5069 unique protein chains on 2758 crystal structures from the PDB mapped to at least one of the 7044 overexpressed genes. In cases where more than one crystal structure was identified for a protein, the computer program CD-HIT was used to cluster the protein sequences of the crystal structures to find a set of non-redundant representative structures for the given protein. This resulted in 1624 unique crystal structures of proteins encoding overexpressed genes. The total number of proteins that encoded overexpressed genes ranged from 839 for TNBC to 2096 for LUSC (Table 2). Overall, the percentage of differentially-expressed genes with at least one crystal structure spanning at least a portion of the gene sequence ranges from 20% in LUSC to 34% in GBM. Additionally, we introduce more stringent cutoffs to distinguish between proteins that can act as probes versus those that feature druggable binding sites by increasing cutoffs of both the log2 fold change and the druggability property of a binding site. Using these increased cutoffs, we identify 5218 overexpressed proteins in TCGA, with only 1218 having a high quality crystal structure at the PDB (Table 1).
192 reference proteins using UniProt35 identifiers led to 7044 proteins that are encoded by TCGA overexpressed genes (Table 1 and Table S1, ESI†). For each cancer type, we identified the number of overexpressed genes with protein products having at least one high-resolution crystal structure by mining the Protein Data Bank (PDB). A total of 5069 unique protein chains on 2758 crystal structures from the PDB mapped to at least one of the 7044 overexpressed genes. In cases where more than one crystal structure was identified for a protein, the computer program CD-HIT was used to cluster the protein sequences of the crystal structures to find a set of non-redundant representative structures for the given protein. This resulted in 1624 unique crystal structures of proteins encoding overexpressed genes. The total number of proteins that encoded overexpressed genes ranged from 839 for TNBC to 2096 for LUSC (Table 2). Overall, the percentage of differentially-expressed genes with at least one crystal structure spanning at least a portion of the gene sequence ranges from 20% in LUSC to 34% in GBM. Additionally, we introduce more stringent cutoffs to distinguish between proteins that can act as probes versus those that feature druggable binding sites by increasing cutoffs of both the log2 fold change and the druggability property of a binding site. Using these increased cutoffs, we identify 5218 overexpressed proteins in TCGA, with only 1218 having a high quality crystal structure at the PDB (Table 1).
| TCGA druggable binding sites (log2FC ≥ 2.0, DS ≥ 1.0) |
TCGA binding sites (log2FC ≥ 1.5, DS ≥ 0.8) |
All proteins | |
|---|---|---|---|
| Total number of proteins | 5218 | 7044 | 20192 |
| Proteins with structure | 1218 | 1624 | 4124 |
| Proteins with druggable binding sites | 405 | 1044 | 2607 |
| Number of druggable binding sites | 502 | 2214 | 5498 |
| ENZ | 126 | 434 | |
| PPI | 55 | 231 | |
| OTH | 331 | 1576 |
FC ≥ 2.0, DS ≥ 1.0)
| Cancer type | Cancer name | Total number of proteins | Proteins with structure | Proteins with druggable binding sites | Number of druggable binding sites | Binding site type | ||
|---|---|---|---|---|---|---|---|---|
| ENZ | PPI | OTH | ||||||
| BRCA | Breast invasive carcinoma | 1314 | 280 | 79 | 93 | 29 | 14 | 54 |
| COAD | Colon adenocarcinoma | 971 | 187 | 47 | 64 | 15 | 8 | 45 |
| GBM | Glioblastoma multiforme | 1168 | 429 | 161 | 145 | 34 | 13 | 99 |
| HNSC | Head and neck squamous cell carcinoma | 697 | 128 | 28 | 34 | 10 | 4 | 21 |
| KIRC | Kidney renal clear cell carcinoma | 1437 | 376 | 132 | 158 | 32 | 19 | 109 |
| LUAD | Lung adenocarcinoma | 1780 | 363 | 114 | 169 | 38 | 15 | 117 |
| LUSC | Lung squamous cell carcinoma | 2096 | 402 | 111 | 158 | 49 | 16 | 96 |
| THCA | Thyroid adenocarcinoma | 888 | 207 | 65 | 103 | 27 | 7 | 72 |
| TNBC | Triple-negative breast carcinoma | 839 | 211 | 51 | 64 | 21 | 10 | 38 |
| UCEC | Uterine corpous endometrioid carcinoma | 1449 | 332 | 95 | 136 | 37 | 17 | 86 |
Identification of binding sites on protein structures at the PDB
Using the three-dimensional structure of overexpressed genes for each disease, we scanned their surfaces for binding sites using the SiteMap computer program. SiteMap identifies binding sites by overlaying a three-dimensional grid around the entire protein to determine the van der Waals energies at each point of the grid (site point). By linking together site points on the protein surface that are protected from the solvent, SiteMap identifies potential binding sites on a protein surface. Each binding site identified by SiteMap is evaluated based on its ability to bind a ligand (SiteScore) and its druggability (DrugScore). Both SiteScore and DrugScore use the weighted sums of the same parameters, namely the (i) number of site points in the binding site; (ii) enclosure score that is a measure of how open the binding site is to solvents; and (iii) hydrophilic character of the binding site (hydrophilic score). Unlike DrugScore, SiteScore limits the impact of hydrophilicity in charged and highly polar sites. A binding site with SiteScore and DrugScore of 0.8 is considered to be able to fit a small molecule ligand. SiteScore and DrugScore values closer to 0.8 are considered ‘difficult’ to drug, while binding sites with SiteScore and DrugScore closer to 1.1 are classified as highly ‘druggable’.28 In this work, we consider a binding site with SiteScore and DrugScore values of 0.8 or greater as able to be probed and a binding site with DrugScore greater than 1.0 as druggable.Among 1624 overexpressed proteins with at least one high-resolution human crystal structure, 1044 (∼64%) had at least one binding site (Table 1). Similarly, among the 1218 highly overexpressed proteins with crystal structures, 405 (∼33%) had at least one druggable binding site. For individual diseases, roughly 30% of proteins with crystal structures corresponding to highly overexpressed genes possessed at least one druggable binding site (Table 2). For example, 51 proteins with a crystal structure from among 211 in TNBC had a druggable binding site, while 114 proteins with a crystal structure in LUAD were found to have a binding site among 363. Generally, we found more binding sites than proteins with crystal structures, suggesting that although many of the proteins harbored more than one binding site, a large portion might only act as probes rather than druggable sites. An average of about 0.38 druggable binding sites were identified per protein with crystal structures. For example, a total of 145 druggable binding sites were identified on the 429 proteins with crystal structures corresponding to differentially-expressed GBM genes. Among the most frequently overexpressed proteins with druggable binding sites are the members of the matrix metalloproteinases (MMPs) and protein kinases related to cell signaling (Fig. S1, ESI†).
Classification of binding sites
To characterize the potential functional impact of each of these binding sites, we classified each binding site by its functional role based on its structural features and location on the protein surface, particularly whether it corresponds to a catalytic site or to a binding site located at a protein–protein interaction interface. Using the proximity of known structural features and the functional annotations of key residues, we characterize each binding site on the protein structure of overexpressed genes from TCGA into three groups: enzyme (ENZ), protein–protein interaction (PPI), and other (OTH). Fig. S2 (ESI†) shows examples of each of the three binding sites. For example, the ATP binding site of a protein kinase is classified as enzyme (ENZ), while a binding site at the interaction interface between two members of the protein families CDKs and cyclins are classified as PPI. All other binding sites are referred to as “other” (OTH). Within the binding sites that we identified, there is a wide distribution of binding site functions for each cancer type (Tables 1 and 2). Overall, there are many more ‘OTH’ binding sites than ENZ and PPI across all tumors. OTH binding sites constitute approximately 70% of the binding sites observed, while ENZ and PPI are observed in about 20 and 10% of structures, respectively. Among those binding sites that we classify as druggable, the distributions are 25, 11, and 66% for the ENZ, PPI, and OTH binding sites, respectively. OTH binding sites may correspond to uncharacterized enzyme active sites or may occur at PPI interfaces that have not been characterized.Cavities at enzyme active sites
Enzyme active site binding sites were identified by first mapping known catalytic residues from Catalytic Site Atlas (CSA)36 and UniProtKB35 onto the identified structures of each protein. CSA identifies catalytic residues as those that are (i) directly involved in a catalytic mechanism; (ii) alter the pKA of another residue or water involved in the catalytic mechanism; (iii) stabilize a transition or intermediary state; and/or (iv) activate a substrate.36 UniProt defines these residues as being directly involved in catalysis.35 If one of the catalytic residues was within the binding site, we classify the binding site as ENZ. In total, we identified 434 unique enzyme active site binding sites and 126 druggable binding sites on proteins that are encoded by overexpressed genes at TCGA (Table 1). The number of druggable ENZ binding sites ranged from 10 for HNSC to 49 for LUSC. For example, there were 34, 21, and 38 druggable enzyme binding sites for GBM, TNBC and LUAD, respectively (Table 2). We further classify enzymes by their catalytic function and distinguish between the druggability of the binding site (Fig. S3, ESI†). We treat kinases separately from the transferases. When kinases and transferases are combined, they, along with the hydrolases, are the largest group among the enzyme active site binding sites. There were 70, 91, 83, and 141 oxidoreductases, transferases, kinases, and hydrolases, respectively. Lyases, isomerases, and ligases, on the other hand, were the least common among proteins with ENZ binding sites (26, 16, and 9, respectively).Cavities at protein–protein interaction interfaces
Despite the fact that protein–protein interactions play a crucial role in a range of diseases including cancer, few successful PPI inhibitors have been developed to date. This is attributed to the fact that PPI interfaces are usually large and devoid of well-defined binding cavities. Druggable binding sites that occur at protein–protein interfaces could be used to develop small molecules to disrupt the protein–protein interaction. PPI binding sites were identified by looking at the crystal structures with protein complexes with respect to the representative structures for a given protein. For each representative structure of a given protein, we went back to our sequence-based clustering approach in CD-HIT and identified the set of protein structures that shared significant sequence identity with the representative structure. We then aligned all the crystal structures from this alternative set of structures back onto the representative structure. This superimposition resulted in the identification of PPI interfaces that might not have appeared in the reference structure and their positions with respect to the previously identified binding sites. In total, we identified 231 unique binding sites located at protein–protein interaction interfaces, of which only 55 were druggable. As expected, there were significantly fewer binding sites that occurred at PPI interfaces than any of the other classes of binding sites. These ranged from 4 for HNSC to 19 for KIRC. For example, there were 13, 10, and 15 druggable PPI binding sites identified for GBM, TNBC, and LUAD proteins, respectively (Table 2).Proteins with binding sites located at both enzyme active sites and protein–protein interaction interfaces
While OTH binding sites were predominant among the different cancer types, the ENZ and PPI binding sites give greater insight into the binding site's function. Interestingly, there are proteins that contain binding sites that are classified as both ENZ and PPI (Table 3). Of these 24 proteins, 10 have binding sites that are druggable and are part of the enzyme active site and a PPI interface. Among these are proteins that are implicated in cancer progression and metastasis, such as CDA37 (Fig. 1A), MMP1438 and DDR1.39 In these cases, the binding site at the catalytic site is also part of a PPI interface. Many of the cases where the ENZ and PPI binding sites overlap correspond to binding sites that occur at the active site of proteases. The binding partner is usually a protease inhibitor, for example, AGT and TIMP1 in ANPEP and MMP14, respectively. Generally, these interactions may not be promising targets since proteolytic activity may contribute to tumor invasion and metastasis. However, the overexpression of protease inhibitors such as TIMPs and serpins suggest that inhibition of proteases may oppose growth and metastasis of a tumor.| Symbol | Name | Interaction partner | ||
|---|---|---|---|---|
| PDB | Symbol | Name | ||
| a The identified binding site is druggable (DS ≥ 1.0) | ||||
| ANPEP | Aminopeptidase N | 4FYSC | AGT | Angiotensinogen |
| CDA | Cytidine deaminase | 1MQ0A | CDA | Cytidine deaminase |
| CTSV | Cathepsin L2 | 3KFQCa | CSTA | Cystatin-A |
| DDR1 | Epithelial discoidin domain-containing receptor 1 | 3ZOSA | DDR1 | Epithelial discoidin domain-containing receptor 1 |
| DNM1 | Dynamin-1 | 2X2ED | DNM1 | Dynamin-1 |
| GAPDH | Glyceraldehyde-3-phosphate dehydrogenase | 1ZNQRa | GAPDH | Glyceraldehyde-3-phosphate dehydrogenase |
| GLA | Alpha-galactosidase A | 3HG3B | GLA | Alpha-galactosidase A |
| GSG2 | Serine/threonine-protein kinase haspin | 4OUCBa | HIST2H3A | Histone H3.2 |
| HDC | Histidine decarboxylase | 4E1OEa | HDC | Histidine decarboxylase |
| HOGA1 | 4-Hydroxy-2-oxoglutarate aldolase, mitochondrial | 3SO5Aa | HOGA1 | 4-Hydroxy-2-oxoglutarate aldolase, mitochondrial |
| KIF3C | Kinesin-like protein KIF3C | 3B6VB | KIF3C | Kinesin-like protein KIF3C |
| MMP14 | Matrix metalloproteinase-14 | 3MA2B | TIMP1 | Metalloproteinase inhibitor 1 |
| PCSK9 | Proprotein convertase subtilisin/kexin type 9 | 3BPSPa | PCSK9 | Proprotein convertase subtilisin/kexin type 9 |
| PGC | Gastricsin | 1AVFQ | PGC | Gastricsin |
| PGD | 6-Phosphogluconate dehydrogenase, decarboxylating | 2KJVC | PGD | 6-Phosphogluconate dehydrogenase, decarboxylating |
| PKLR | Pyruvate kinase PKLR | 4IMAC | PKLR | Pyruvate kinase PKLR |
| PNLIPRP2 | Pancreatic lipase-related protein 2 | 2PVSBa | PNLIPRP2 | Pancreatic lipase-related protein 2 |
| PNP | Purine nucleoside phosphorylase | 4ECEEa | PNP | Purine nucleoside phosphorylase |
| REN | Renin | 3G72Aa | REN | Renin |
| RNASE2 | Non-secretory ribonuclease | 2BEXB | RNH1 | Ribonuclease inhibitor |
| RRM1 | Ribonucleoside-diphosphate reductase large subunit | 2HNCB | RRM1 | Ribonucleoside-diphosphate reductase large subunit |
| SEPT3 | Neuronal-specific septin-3 | 3SOPB | SEPT3 | Neuronal-specific septin-3 |
| TDO2 | Tryptophan 2,3-dioxygenase | 4PW8Ea | TDO2 | Tryptophan 2,3-dioxygenase |
| UCHL1 | Ubiquitin carboxyl-terminal hydrolase isozyme L1 | 3IFWB | UBC | Polyubiquitin-C |
 | ||
| Fig. 1 Examples of proteins with both ENZ and PPI binding sites. Proteins are represented in cartoon format. The monomer structure with identified binding sites is in white. SiteMap binding sites are shown as spheres, bound ligands are shown as ball-and-sticks. (A) The homodimeric structure of CDA (PDB: 1mq0.B) with a bound inhibitor at a binding site classified as both ENZ and PPI. (B) The homodimeric structure of NAMPT (PDB: 4o0z.B) with an ENZ (peach, bound inhibitor) and a PPI (blue) binding site on the same domain. (C and D) The protein kinase (PDB: 2vwy.A) and ligand binding domain (PDB: 2hle.A) of EPHB4 featuring an ENZ and a PPI binding site on separate domains. The binding site on the protein kinase domain is not shown as spheres, but is occupied by the bound inhibitor (green). | ||
Other proteins contain distinct enzyme and PPI binding sites (Table 4). Of these 24 proteins, only ALOX12 and NR1L2 feature both druggable ENZ and PPI binding sites. These proteins can be placed into two categories based whether or not the binding sites are on the same protein domains. Some have ENZ and PPI binding sites on the same domain such as the decarboxylase GAD1, which has a catalytic site as well as a PPI binding site at its homodimer interface. Another example is the phosphoribosyltransferase NAMPT, which is implicated in cancer metabolism,40 and has an ENZ binding site with an inhibitor bound as well as a PPI binding site between the homodimer structure (Fig. 1B). Other proteins have ENZ and PPI binding sites on separate domains. For example, the serine/threonine-protein kinase PLK1 has both an enzyme ATP binding site on its protein kinase domain and a binding site at the PPI interface at its POLO-box domain. Another similar example is the receptor tyrosine kinase EPHB4, which has an enzyme ATP binding site on its protein kinase domain (Fig. 1C) and a binding site at the PPI interface with an ephrin ligand EFNB2 on its ligand binding domain (Fig. 1D). These binding sites may be used to develop allosteric modulators. Small molecules that bind to the PPI binding site may alter substrate binding to the active site. A small molecule inhibitor of enzyme activity may affect the protein–protein interaction of the protein.
| Symbol | Name | Interaction partner | ||
|---|---|---|---|---|
| PDB | Symbol | Name | ||
| a Both ENZ and PPI binding sites are druggable (DS ≥ 1.0). | ||||
| ACMSD | 2-Amino-3-carboxymuconate-6-semialdehyde decarboxylase | 4IH3A | ACMSD | 2-Amino-3-carboxymuconate-6-semialdehyde decarboxylase |
| ADH1C | Alcohol dehydrogenase 1C | 1HSOA | ADH1C | Alcohol dehydrogenase 1C |
| ALOX12 | Arachidonate 12-lipoxygenase, 12S-type | 3D3LBa | ALOX12 | Arachidonate 12-lipoxygenase, 12S-type |
| AOC1 | Amiloride-sensitive amine oxidase [copper-containing] | 3MPHB | AOC1 | Amiloride-sensitive amine oxidase [copper-containing] |
| BHMT | Betaine-homocysteine S-methyltransferase 1 | 1LT7B | BHMT | Betaine-homocysteine S-methyltransferase 1 |
| CTSE | Cathepsin E | 1TZSP | CTSE | Cathepsin E |
| DDC | Aromatic-L-amino-acid decarboxylase | 3RBFB | DDC | Aromatic-L-amino-acid decarboxylase |
| DDX39A | ATP-dependent RNA helicase DDX39A | 1T6NB | DDX39A | ATP-dependent RNA helicase DDX39A |
| EPHB2 | Ephrin type-B receptor 2 | 2QBXD | Antagonist peptide (Ephrin binding site) | |
| EPHB4 | Ephrin type-B receptor 4 | 2HLEB | EFNB2 | Ephrin-B2 |
| GAD1 | Glutamate decarboxylase 1 | 3VP6A | GAD1 | Glutamate decarboxylase 1 |
| GPI | Glucose-6-phosphate isomerase | 1JIQB | GPI | Glucose-6-phosphate isomerase |
| HK2 | Hexokinase-2 | 2NZTA | HK2 | Hexokinase-2 |
| HMGCS2 | Hydroxymethylglutaryl-CoA synthase, mitochondrial | 2WYAD | HMGCS2 | Hydroxymethylglutaryl-CoA synthase, mitochondrial |
| NAMPT | Nicotinamide phosphoribosyltransferase | 4O0ZA | NAMPT | Nicotinamide phosphoribosyltransferase |
| NR1I2 | Nuclear receptor subfamily 1 group I member 2 | 3CTBBa | NR1I2 | Nuclear receptor subfamily 1 group I member 2 |
| NTRK1 | High affinity nerve growth factor receptor | 1WWWV | NGF | Beta-nerve growth factor |
| PLK1 | Serine/threonine-protein kinase PLK1 | 1Q4KE | Phosphopeptide | |
| PYGL | Glycogen phosphorylase, liver form | 2ZB2B | PYGL | Glycogen phosphorylase, liver form |
| RHOC | Rho-related GTP-binding protein RhoC | 3KZ1A | ARHGEF11 | Rho guanine nucleotide exchange factor 11 |
| SULT1C2 | Sulfotransferase 1C2 | 3BFXA | SULT1C2 | Sulfotransferase 1C2 |
| TH | Tyrosine 3-monooxygenase | 2XSNC | TH | Tyrosine 3-monooxygenase |
| TPH2 | Tryptophan 5-hydroxylase 2 | 4VO6B | TPH2 | Tryptophan 5-hydroxylase 2 |
| UPP1 | Uridine phosphorylase 1 | 3EUFB | UPP1 | Uridine phosphorylase 1 |
Unclassified binding sites
Binding sites that were neither enzyme active sites nor located at protein–protein interactions were classified as OTH. In total, more than 1500 of these binding sites were identified on proteins that are encoded by differentially-expressed genes. These binding sites could potentially be either unassigned enzyme active sites, part of structurally unresolved protein–protein interaction sites, or allosteric sites. A binding site is considered allosteric only if it occurs on a protein that has enzyme activity or that engages other ligands at sites that are distant from the allosteric binding site. Among the 782 proteins with OTH binding sites, 323 also have at least one ENZ or PPI binding site. These binding sites offer an opportunity to design allosteric small molecule modulators of enzyme activity or protein–protein interactions. Allosteric regulation of enzyme activity has been successfully achieved with small molecules in several systems.41 For example, small-molecule kinase inhibitors have been developed to bind to allosteric binding sites to inhibit the enzyme activity of the protein kinase.42 More recently, small molecules that bind to an allosteric binding site on the Ral GTPase was shown to modulate the distal interaction with its effector protein.43Many OTH binding sites occur on proteins with existing ENZ and/or PPI binding sites, which may be potential allosteric sites for protein inhibition. When the enzyme active site is well characterized on a protein surface, additional binding sites represent opportunities for allosteric inhibition of the protein's function. For example, the sulfotransferase SULT2B1 has four binding sites on its protein surface (Fig. 2A). The ENZ binding site is not shown on the figure but encompasses the adenosine nucleotide. Three additional OTH binding sites were detected on the surface of the protein and represent potential sites for allosteric sites. Another example of a protein with both ENZ and OTH binding sites is the protein kinase RET (Fig. 2B). In this structure, a known inhibitor occupies the ENZ ATP binding site, while an additional allosteric binding site is formed near the αC helix. Similarly, there are proteins with both PPI and OTH binding sites. One example is the PPI between CHN2 and SLC9A1 (Fig. 2C), where an α-helix from SLC9A1 occupies two PPI binding sites on CHN2. An additional potentially allosteric OTH binding site is formed on the backside of CHN2. Another example is the protein complex formed between PLAUR, PLAU, and VTN (Fig. 2D). In this example, binding sites were found on the monomer structure of the apo protein. After superimposition of additional crystal structures back onto the representative structure, two of the three detected binding sites were classified as PPI. The two separate PPI binding sites occupy the respective interfaces between PLAUR–PLAU and PLAUR–VTN. An additional OTH binding site was also detected on the protein surface and represents an allosteric site.
 | ||
| Fig. 2 Examples of proteins with potentially allosteric OTH binding sites. Proteins are represented in cartoon format. The monomer structure with identified binding sites is in white. SiteMap binding sites are shown as spheres, bound ligands are shown as ball-and-sticks. (A) SULT2B1 (PDB: 1q1q.A) with an ENZ binding site occupied by a nucleotide and three additional OTH binding sites (green, blue, yellow). (B) RET (PDB: 2iiv.A) with an ENZ binding site occupied by the bound inhibitor and an additional OTH binding site (green). (C) CHP2 (PDB: 2bec.A) with two PPI binding sites (green, blue) at the interface with SL9CA1 (PDB: 2bec.B) and an additional OTH binding site (peach). (D) The superimposed structure of PLAUR (PDB: 1ywh.M) with two PPI binding sites at the interfaces with VTN (PDB: 3bt1.B, green) and PLAU (PDB: 3bt1.A, yellow) and an additional OTH binding site (peach). | ||
A search of protein–protein interaction networks to identify OTH binding sites located at PPI interfaces
The majority of OTH binding sites occur on proteins with no discernable ENZ or PPI binding sites. To determine whether these binding sites could potentially be located at protein–protein interaction interfaces, a database of predicted protein–protein complexes known as PrePPI was explored.44 The PrePPI method uses both structural and non-structural evidence to predict whether two proteins form a complex. For complexes predicted based on structural information, PrePPI superimposes monomeric crystal structures onto a reference complex based on the structural similarities of the monomeric structures with the two structures forming the interaction interface. This model is then evaluated based on how well the individual residues of the predicted interaction interface overlap with the structural model. If the likelihood ratio of this structural modeling is above a given cutoff, PrePPI provides the identifiers of both the individual proteins and the reference structure for further evaluation. For the 458 proteins that contained only binding sites classified as OTH, we evaluated the structural models given by PrePPI to determine whether or not OTH binding sites overlapped with potential PPI interfaces. These 458 proteins are represented by 395 unique crystal structures consisting of 806 binding sites of unknown function. Of these 806 OTH binding sites, 48 were on proteins without models of structural complexes in PrePPI. Among the remaining 758 OTH binding sites, we identified 17 OTH binding sites on 13 proteins that are likely binding sites at protein–protein interfaces (Table 5). In each of these 17 cases, a previously classified OTH binding site was predicted by PrePPI to be part of a known protein–protein interaction interface, and perhaps directly contributing to the PPI itself. It is interesting to note that several of these predicted protein–protein interactions are well-established despite the lack of a co-crystal structure: these include the ANK1–ILK45 and CHN1–RAC146 interactions. In each of these cases, there was a high degree of homology between the structure containing the OTH binding site and the PrePPI protein–protein complex to which it was superimposed. In most cases, however, the protein containing the OTH binding site did not show any homology with a protein in a PrePPI complex. In these cases, the similarity between the interaction interfaces of the two proteins and a model protein complex was used. The NCS1–PPP3CA, LCN1–OVCH1, and ZBTB32–BCL6 interactions are examples in which the interaction was uncharacterized in both the literature and existing PPI databases. These three interactions were predicted based on the structural complementarity of both the interaction interface and the crystal structure. Overall, we predict that approximately 2% of OTH binding sites with unknown function to be part of a previously uncharacterized PPI interface.| Symbol | Name | Binding site | Predicted PPI | ||
|---|---|---|---|---|---|
| Model | Symbol | Name | |||
| a The binding site is druggable (DS ≥ 1.0). | |||||
| AK3 | GTP:AMP phosphotransferase AK3, mitochondrial | 1ZD8A2 | 2BWJ | AK5 | Adenylate kinase isoenzyme 5 |
| ANK1 | Ankyrin-1 | 1N11A3 | 2JAB | ILK | Integrin-linked protein kinase |
| CHN1 | N-chimaerin | 3CXLA3 | 1OW3 | RAC1 | Ras-related C3 botulinum toxin substrate 1 |
| HOGA1 | 4-Hydroxy-2-oxoglutarate aldolase, mitochondrial | 3S5OA1a | 3DAQ | HOGA1 | 4-Hydroxy-2-oxoglutarate aldolase, mitochondrial |
| HPD | 4-Hydroxyphenylpyruvate dioxygenase | 3ISQA1a | 1SQI | HPDL | 4-Hydroxyphenylpyruvate dioxygenase-like protein |
| HPD | 4-Hydroxyphenylpyruvate dioxygenase | 3ISQA5 | 1SQI | HPDL | 4-Hydroxyphenylpyruvate dioxygenase-like protein |
| LCN | Lipocalin-1 | 3EYCA1a | 2F91 | OVCH1 | Ovochymase-1 |
| NCS1 | Neuronal calcium sensor 1 | 1G8IB1 | 1AUI | PPP3CA | Serine/threonine-protein phosphatase 2B catalytic subunit alpha isoform |
| NCS1 | Neuronal calcium sensor 1 | 1G8IB2a | 1AUI | PPP3CA | Serine/threonine-protein phosphatase 2B catalytic subunit alpha isoform |
| RAP1GAP | Rap1 GTPase-activating protein 1 | 1SRQA1 | 3BRW | RAP1A | Ras-related protein Rap-1A |
| RHCG | Ammonium transporter Rh type C | 3HD6A1 | 2NUU | RHAG | Ammonium transporter Rh type A |
| RHCG | Ammonium transporter Rh type C | 3HD6A4 | 2NUU | RHAG | Ammonium transporter Rh type A |
| RHCG | Ammonium transporter Rh type C | 3HD6A5 | 2NUU | RHAG | Ammonium transporter Rh type A |
| SHMT2 | Serine hydroxymethyltransferase, mitochondrial | 3OU5A1 | 3GBX | SHMT2 | Serine hydroxymethyltransferase, mitochondrial |
| STXBP2 | Syntaxin-binding protein 2 | 4CCAA2 | 3C98 | STX1A | Syntaxin-1A |
| THEM5 | Acyl-coenzyme A thioesterase THEM5 | 4AE7A1 | 1Q4T | THEM4 | Acyl-coenzyme A thioesterase THEM4 |
| ZBTB32 | Zinc finger and BTB domain-containing protein 32 | 3M5BB1 | 3BIM | BCL6 | B-cell lymphoma 6 protein |
Cancer signaling pathways
Pathways reveal signaling transduction across a cascade of proteins that elicit a variety of cell phenotypes. Individual targets in these pathways are potential sites through which small-molecule inhibition is expected to enhance or alter the subsequent cell phenotype. Alteration of individual genes within these signaling pathways lead to cancer related processes such as cell growth and adhesion. We have identified 27 cancer related signaling pathways in KEGG47 and their respective proteins. Using the members in each of these signaling pathways, we map binding sites onto these individual proteins. We distinguish between binding sites with DrugScore greater than 0.8 on proteins with log2 fold change greater than 1.5 (i.e., able to be probed) (Fig. 3A) and those with DrugScore greater than 1.0 and log2 fold change greater than 2 (i.e., druggable binding sites) (Fig. 3B). While some signaling pathways like the cell cycle contained binding sites of all functional types, no binding sites could be identified for the Hedgehog pathway on differentially-expressed genes. To address cross-talk between signaling pathways, binding sites were also evaluated as being either unique to that signaling pathway or on proteins that occur in multiple signaling pathways. In a majority of cancer signaling pathways, there were more binding sites that occurred in multiple signaling pathways than in a signaling pathway, revealing proteins targets that are involved in multiple signaling processes. Only the Citrate Cycle, HIF-1, and PPAR signaling pathways had many more binding sites that were unique to the signaling pathway itself than in multiple signaling pathways. In signaling pathways such as focal adhesion and cytokine–cytokine receptor interactions, almost all of the druggable binding sites belonged to proteins that were involved in cross-talk across cancer signaling pathways. Finally, signaling pathways such as the cell cycle and Hippo pathways have an even mix of binding sites on unique and overlapping proteins. | ||
| Fig. 3 Binding sites in cancer related signaling pathways. Proteins with binding sites were mapped to 27 cancer related signaling pathways in KEGG. Identified binding sites were divided based on whether the protein was exclusive to one signaling pathway or occurred in multiple signaling pathways. (A) Identified binding sites had DrugScore greater than 0.8 on proteins with log2 fold change greater than 1.5. (B) Identified binding sites had DrugScore greater than 1.0 and log2 fold change greater than 2. | ||
Correlation with patient survival for proteins encoded by differentially-expressed genes
We collected patient survival data from TCGA clinical records for each disease to identify the impact of gene expression on overall survival of cancer patients. To determine the overall survival rate, we first identified the date of death or date of the last checkup for deceased and living patients, respectively. For each differentially-expressed gene among the 10 diseases we considered, the median expression value was used to divide patient tumors into two groups, high and low expression. For a given gene, we then paired a patient's gene expression with their survival outcome to build a Cox proportional hazards regression model for differentially-expressed genes. The ratio of the hazard rates between the high and low expression groups are summarized by a metric known as the hazard ratio. The hazard ratio derived from the regression model defines the probability that an event will occur in the next time interval. In this model, this time interval is made sufficiently small that the hazard rate is considered instantaneous. Therefore, the hazard ratio is used to describe the ratio between the hazard rates of two groups, that is, the survival of patients expressing a gene at high and low levels. In total, we identified 1343 differentially-expressed genes across all 10 diseases with a hazard ratio above 1 and log2 fold change above 1.5. Among them, 202 contained at least one binding site (Fig. 4A). Both KIRC (121 total) and LUAD (57 total) had the most number of proteins that were both overexpressed and correlated with patient outcome. There were 45 druggable genes that were found to be both overexpressed and correlated with patient outcome in more than one cancer type. The most frequently occurring are MELK and RRM2 in 4 separate cancers, while another 9 protein have significant fold changes and hazard ratios in 3 cancers. The binding sites on these 202 proteins show a wide distribution in both their druggability and binding site type (Fig. 4B). Of the 601 unique binding sites on these proteins, 102 are ENZ, 46 are PPI, 444 are OTH, and 9 are classified as both ENZ and PPI. Both the SiteScore and DrugScore of the PPI binding sites have upper limits of about 1.1 for both metrics, while there are many ENZ and OTH binding sites that exceed this cutoff. Similarly, we focused on the subset of the proteins that were highly overexpressed and featured druggable binding sites. In total, we identified 60 proteins with at least one druggable binding site across 10 diseases with a log2 fold change greater than 2.0 and hazard ratio greater than 1.0 (Fig. 4D). Similarly, there are far fewer binding sites among proteins that fit these criteria. Of the 92 binding sites, 20 are ENZ, 6 are PPI, 65 are OTH, and 1 is both ENZ and PPI (Fig. 4E). | ||
| Fig. 4 Proteins with binding sites that are both overexpressed and correlate with patient outcome. (A) Fold change versus hazard ratio across all cancer types on proteins with log2FC ≥ 1.5, HR > 1.0, and DrugScore > 0.8. (B) SiteScore and DrugScore of binding sites by functional annotation for proteins in A. (C) Degree versus betweenness centrality from PPI network for all proteins with log2FC ≥ 1.5 and HR > 1. Proteins are colored coded based on whether there was a high quality crystal structure (blue), a crystal structure but no identifiable binding sites (orange), binding sites with DrugScore between 0.8 and 1.0 (gray), and druggable binding site with DrugScore greater than 1.0 (yellow). (D) Fold change versus hazard ratio across all cancer types on proteins with druggable binding sites with log2FC ≥ 2.0, HR > 1.0, and DrugScore > 1.0. (E) SiteScore versus DrugScore of druggable binding sites with log2 FC ≥ 2.0, HR > 1.0, and DrugScore > 1.0. (F) Degree versus betweenness centrality from PPI network for all proteins with log2FC ≥ 2.0, HR > 1.0, and DrugScore > 1.0. | ||
Protein–protein interaction network
In addition to looking at differentially-expressed genes in the context of their expression, we addressed their impact on the global protein–protein interaction network. Networks have been used to not only model biological relationships, such as the relationship between drugs and diseases48 or genes and diseases,49 to understand their underlying mechanisms, but also to identify new drug targets by identifying the relationships between a drug's side effects50 or gene expression profile.51 Using experimental data, a global protein–protein interaction network was constructed from physical interactions in humans by integrating data from seven major interaction databases. This resulted in 203068 non-redundant protein–protein interactions. To address the robustness of the network, we further filtered the interactions by only keeping those interactions that appeared in at least two of the seven databases. This resulted in a network with 38164 non-redundant protein–protein interactions. We then identified the network properties of each protein within this network to measure the centrality and essentiality of each protein to the overall network. Among the topological properties of a given protein are its degree, which describes the number of interactions that are formed by that protein, and its betweenness centrality, which describes the number of shortest paths that go through the given protein. In a biological context, betweenness centrality is a measure of the available paths that a signal can travel through a given network.52 Thus, proteins with high betweenness are thought to be essential to biological function and are frequently targeted in drug discovery.53 For example, TP53 has a betweenness centrality and degree of 4.1 × 10⁻² and 236, respectively, while EGFR is 2.3 × 10⁻² and 181 for the same properties. We examine the topological properties of all proteins that are overexpressed (log2FC ≥ 1.5) and whose expression correlate with patient outcome (Fig. 4C). Of these 1343 proteins, 1001 (∼75%) did not have a high quality crystal structure and an additional 141 (∼10%) had a structure but no binding sites. Of the remaining proteins, 117 (9%) and 84 (6%) have binding sites and druggable binding sites, respectively. When the differential-expression cutoff is increased to 2 and the minimum DrugScore is increased to 1.0, 60 proteins have at least one druggable binding site (Fig. 4F). Among the proteins with the highest centrality and degree are PLK1, KPNA2, AURKA, and AURKB.
New unexplored targets for the development of small-molecule probes and cancer therapeutics
For each of the previously identified 60 targets, we integrate their structural, genomic, biological, and clinical data to examine their druggability. We divide these targets into those that are already established in cancer (Table 6) and those that are uncommon or novel (Table 7) based on the number of citations found in PubMed. Similarly, we analyzed the 202 proteins that were identified using the lower cutoffs in fold change and binding site DrugScore (Table S2, ESI†). We rank-ordered the top targets for each cancer based on their interconnectivity in the PPI network. Among these potential targets, we see a variety of biological processes represented, including many involved in the immune response, metabolism, homeostasis and cell cycle. Similarly, some are well-studied in cancer but lack small-molecule inhibitors, while others are have no co-crystallized small-molecule inhibitors but inhibitors have been reported in the literature. For example, the well-studied transcription regulator TOP2A is altered in cancer cells resulting in chromosome instability and is among the genes that are overexpressed and correlate with survival, but has many topoisomerase-specific inhibitors available.54 Other genes may act as markers for cancer and indicate late progression into cancer or are vital to the immune response against tumorigenesis. However, there are many targets whose biology and lack of potential inhibitors may prove to be interesting targets for future considerations. We highlight examples of proteins with ENZ binding sites that have seldom been considered in cancer and lack therapeutics (e.g. PYCR1, QPRT, HSPA6), or are well-studied in cancer but lack small-molecule inhibitors (e.g. PKMYT1, STEAP3, NNMT) (Fig. S4, ESI†). Similarly, we highlight examples of proteins with PPI binding sites that have not been previously targeted by small molecule inhibitors and are either seldom considered in cancer (e.g. CASC5, ZBTB32, and CSAD), or are well-studied in cancer but lack small-molecule inhibitors (e.g. HNF4A, MEF2B, and CBX2) (Fig. S5 and Table S3, ESI†). OTH binding sites can provide an avenue to modulate either enzymatic function or protein–protein interactions of the target. Compounds that bind to OTH sites could act either in an orthosteric manner if the binding site happens to be the binding site of a substrate or protein, or allosterically if the binding site is outside an enzyme active site or protein binding site. Among the genes whose overexpression strongly correlated with patient outcome and that possessed an OTH binding site, several had never been studied in cancer before nor do they have small-molecule inhibitors either in the literature or in co-crystallized complexes. We highlight four examples that span a variety of tumors: a protein of unknown function FAM83A, a water channel AQP2, a serine protease SERPIND1, and a protein associated with the immune response TNFAIP8L2 (Fig. S6, ESI†).| Protein | Network | Signaling pathways | Cancer | Binding site | |||||||||
|---|---|---|---|---|---|---|---|---|---|---|---|---|---|
| Symbol | Name | Degree | Betweenness (×106) | Disease | FC | HR (95% CI) | Publications | Structure | All | ENZ | PPI | OTH | |
| a Has a binding site that has a co-crystallized small molecule inhibitor. | |||||||||||||
| PLK1 | Serine/threonine-protein kinase PLK1 | 74 | 5876.7 | Cell cycle | BRCA | 3.7 | 1.8 (1.2–2.7) | 776 | 2OWBA | 1a | 1 | 0 | 0 |
| KIRC | 2.3 | 2.4 (1.7–3.3) | |||||||||||
| LUAD | 3.5 | 1.8 (1.2–2.6) | |||||||||||
| CDC20 | Cell division cycle protein 20 homolog | 37 | 1379.5 | Cell cycle, ubiquitin mediated proteolysis | LUAD | 4.0 | 1.6 (1.1–2.3) | 296 | 4GGDB | 1 | 0 | 0 | 1 |
| CCNB1 | G2/mitotic-specific cyclin-B1 | 34 | 934.3 | Cell cycle, p53 | BRCA | 2.6 | 1.6 (1.1–2.3) | 2214 | 2B9RB | 1 | 0 | 0 | 1 |
| LUAD | 3.0 | 1.8 (1.2–2.6) | |||||||||||
| AURKA | Aurora kinase A | 28 | 1684.1 | BRCA | 3.2 | 1.6 (1.1–2.3) | 686 | 2J4ZB | 1a | 1 | 0 | 0 | |
| LUAD | 2.8 | 1.5 (1.0–2.1) | |||||||||||
| MAD2L1 | Mitotic spindle assembly checkpoint protein MAD2A | 27 | 1194.3 | Cell cycle | LUAD | 2.7 | 1.7 (1.2–2.4) | 221 | 2V64F | 1 | 0 | 1 | 0 |
| AURKB | Aurora kinase B | 25 | 1199.7 | KIRC | 2.9 | 2.7 (1.9–3.8) | 500 | 4AF3A | 2a | 1 | 0 | 1 | |
| LUAD | 3.8 | 1.5 (1.0–2.1) | |||||||||||
| NEK2 | Serine/threonine-protein kinase Nek2 | 21 | 606.0 | LUAD | 3.9 | 1.8 (1.2–2.6) | 115 | 2XK4A | 1 | 0 | 0 | 1 | |
| BUB1 | Mitotic checkpoint serine/threonine-protein kinase BUB1 | 21 | 401.1 | BRCA | 3.6 | 1.6 (1.1–2.4) | 397 | 4R8QA | 3 | 1 | 0 | 2 | |
| KIRC | 2.3 | 2.1 (1.5–2.9) | |||||||||||
| LUAD | 3.0 | 1.8 (1.2–2.6) | |||||||||||
| ZAP70 | Tyrosine-protein kinase ZAP-70 | 19 | 278.3 | Ras | KIRC | 3.2 | 1.6 (1.2–2.3) | 702 | 4K2RA | 2 | 0 | 0 | 2 |
| CHEK1 | Serine/threonine-protein kinase Chk1 | 18 | 580.9 | Cell cycle, p53 | LUAD | 2.2 | 1.5 (1.0–2.1) | 77 | 2R0UA | 1a | 1 | 0 | 0 |
| CCNE1 | G1/S-specific cyclin-E1 | 13 | 111.8 | Cell cycle, p53, PI3K-Akt | BRCA | 3.0 | 2.1 (1.4–3.2) | 280 | 1W98B | 1 | 0 | 1 | 0 |
| LUAD | 3.5 | 1.5 (1.1–2.2) | |||||||||||
| C3 | Complement C3 | 9 | 1191.2 | KIRC | 3.4 | 1.5 (1.1–2.0) | 3468 | 2WIIA; 2WIIB | 6 | 0 | 2 | 4 | |
| F2 | Prothrombin | 9 | 443.3 | KIRC | 3.8 | 2.5 (1.8–3.4) | 3338 | 4NZQA | 1 | 0 | 0 | 1 | |
| TF | Serotransferrin | 9 | 353.3 | HIF-1 | KIRC | 4.4 | 2.0 (1.5–2.8) | 2556 | 3V8XB | 2 | 0 | 0 | 2 |
| CCNA2 | Cyclin-A2 | 9 | 80.6 | Cell cycle | KIRC | 2.1 | 2.2 (1.6–3.0) | 312 | 2BPMD | 1 | 0 | 0 | 1 |
| LUAD | 3.0 | 2.1 (1.4–3.0) | |||||||||||
| HNF4A | Hepatocyte nuclear factor 4-alpha | 9 | 55.7 | HNSC | 2.3 | 1.4 (1.0–1.9) | 173 | 4IQRE | 1 | 0 | 0 | 1 | |
| CTLA4 | Cytotoxic T-lymphocyte protein 4 | 8 | 46.5 | KIRC | 3.0 | 1.7 (1.2–2.4) | 1603 | 2X44D | 1 | 0 | 0 | 1 | |
| TTK | Dual specificity protein kinase TTK | 6 | 11.2 | Cell cycle | BRCA | 3.1 | 1.5 (1.0–2.3) | 155 | 2ZMDA | 1a | 1 | 0 | 0 |
| LUAD | 3.8 | 1.7 (1.2–2.5) | |||||||||||
| ALOX5 | Arachidonate 5-lipoxygenase | 5 | 268.6 | KIRC | 2.1 | 1.7 (1.2–2.3) | 403 | 3O8YA | 5 | 1 | 0 | 4 | |
| KIF11 | Kinesin-like protein KIF11 | 4 | 0.9 | LUAD | 2.9 | 1.6 (1.1–2.3) | 144 | 4AP0A | 1 | 1 | 0 | 0 | |
| ITGAM | Integrin alpha-M | 3 | 1606.8 | KIRC | 2.1 | 1.4 (1.0–1.9) | 1206 | 4M76B | 1 | 0 | 0 | 1 | |
| ADA | Adenosine deaminase | 3 | 50.2 | KIRC | 2.4 | 2.1 (1.5–2.9) | 1838 | 3IARA | 1 | 0 | 0 | 1 | |
| TOP2A | DNA topoisomerase 2-alpha | 3 | 13.2 | KIRC | 2.1 | 1.7 (1.3–2.4) | 367 | 4FM9A | 3 | 0 | 0 | 3 | |
| LUAD | 4.1 | 1.5 (1.0–2.1) | |||||||||||
| NNMT | Nicotinamide N-methyltransferase | 2 | 1.8 | KIRC | 4.0 | 1.7 (1.3–2.4) | 76 | 2IIPA | 1 | 1 | 0 | 0 | |
| MMP9 | Matrix metalloproteinase-9 | 2 | 0.0 | KIRC | 4.3 | 1.8 (1.3–2.5) | 6230 | 1L6JA | 1 | 1 | 0 | 0 | |
| ITGAX | Integrin alpha-X | 1 | 0.0 | KIRC | 3.4 | 1.5 (1.1–2.1) | 733 | 4NENA | 1 | 0 | 0 | 1 | |
| FABP5 | Fatty acid-binding protein, epidermal | 1 | 0.0 | PPAR | KIRC | 2.1 | 1.7 (1.3–2.4) | 88 | 4LKPA | 1 | 0 | 0 | 1 |
| AKR1B10 | Aldo-keto reductase family 1 member B10 | 1 | 0.0 | KIRC | 2.8 | 2.0 (1.4–2.7) | 118 | 4JIIX | 1a | 1 | 0 | 0 | |
| CYP2D6 | Cytochrome P450 2D6 | 0 | 0.0 | KIRC | 2.8 | 1.7 (1.2–2.3) | 915 | 3QM4A | 4a | 0 | 0 | 4 | |
| MMP12 | Macrophage metalloelastase | 0 | 0.0 | KIRC | 2.9 | 1.7 (1.2–2.3) | 113 | 3BA0A | 1 | 0 | 0 | 1 | |
| Protein | Network | Cancer | Binding site | ||||||||||
|---|---|---|---|---|---|---|---|---|---|---|---|---|---|
| Symbol | Name | Degree | Betweenness (×106) | Signaling pathways | Disease | FC | HR (95% CI) | Publications | Structure | All | ENZ | PPI | OTH |
| a Has a binding site that has a co-crystallized small molecule inhibitor. | |||||||||||||
| KPNA2 | Importin subunit alpha-1 | 50 | 3152.3 | BRCA | 2.2 | 1.8 (1.2–2.7) | 55 | 4E4VB | 1 | 0 | 0 | 1 | |
| LUAD | 2.0 | 1.5 (1.0–2.1) | |||||||||||
| FBP1 | Fructose-1,6-bisphosphatase 1 | 16 | 820.8 | GBM | 2.6 | 1.5 (1.0–2.3) | 34 | 2FHYA | 1 | 0 | 0 | 1 | |
| KIF23 | Kinesin-like protein KIF23 | 10 | 61.5 | LUAD | 2.9 | 1.6 (1.1–2.4) | 25 | 3VHXH | 1 | 0 | 0 | 1 | |
| ORM1 | Alpha-1-acid glycoprotein 1 | 7 | 59.0 | KIRC | 6.1 | 1.4 (1.0–1.9) | 25 | 3KQ0A | 1 | 0 | 0 | 1 | |
| PTPN22 | Tyrosine-protein phosphatase non-receptor type 22 | 6 | 12.7 | KIRC | 2.2 | 1.5 (1.1–2.1) | 23 | 4J51B | 1 | 0 | 0 | 1 | |
| EPHA8 | Ephrin type-A receptor 8 | 5 | 99.1 | UCEC | 5.4 | 4.7 (1.0–21.5) | 14 | 3KULB | 1 | 1 | 0 | 0 | |
| ERO1L | ERO1-like protein alpha | 4 | 10.7 | LUAD | 2.2 | 1.7 (1.2–2.4) | 13 | 3AHQA | 2 | 1 | 0 | 1 | |
| PKMYT1 | Membrane-associated tyrosine- and threonine-specific cdc2-inhibitory kinase | 4 | 6.1 | Cell cycle | KIRC | 2.9 | 1.9 (1.4–2.7) | 14 | 3P1AA | 1 | 1 | 0 | 0 |
| TDO2 | Tryptophan 2,3-dioxygenase | 3 | 403.6 | KIRC | 2.7 | 1.5 (1.1–2.1) | 52 | 4PW8F | 1 | 1 | 1 | 0 | |
| GCKR | Glucokinase regulatory protein | 2 | 200.8 | KIRC | 2.9 | 2.5 (1.8–3.5) | 15 | 4OLHA | 3 | 0 | 0 | 3 | |
| SERPINB3 | Serpin B3 | 2 | 4.6 | LUAD | 2.2 | 1.7 (1.2–2.4) | 35 | 2ZV6A | 3 | 0 | 0 | 3 | |
| ADAMTS4 | A disintegrin and metalloproteinase with thrombospondin motifs 4 | 2 | 2.2 | KIRC | 2.0 | 1.6 (1.2–2.2) | 18 | 2RJPC | 1a | 1 | 0 | 0 | |
| SERPINB4 | Serpin B4 | 2 | 1.7 | LUAD | 4.0 | 1.5 (1.0–2.1) | 7 | 2ZV6A | 3 | 0 | 0 | 3 | |
| UCEC | 5.0 | 4.6 (1.2–17.1) | |||||||||||
| MELK | Maternal embryonic leucine zipper kinase | 1 | 0.0 | BRCA | 3.9 | 1.6 (1.0–2.3) | 63 | 4UMUA | 2a | 1 | 0 | 1 | |
| LUAD | 2.7 | 1.7 (1.2–2.3) | |||||||||||
| KIRC | 4.0 | 1.5 (1.0–2.1) | |||||||||||
| UCEC | 3.9 | 3.6 (0.9–3.6) | |||||||||||
| PLCB2 | 1-Phosphatidylinositol 4,5-bisphosphate phosphodiesterase beta-2 | 1 | 0.0 | Calcium, Wnt, Phosphatidylinositol | KIRC | 2.2 | 1.5 (1.1–2.0) | 8 | 2ZKMX | 4 | 0 | 0 | 4 |
| PCK1 | Phosphoenolpyruvate carboxykinase, cytosolic [GTP] | 1 | 0.0 | Citrate, PPAR, PI3K-Akt | LUAD | 3.8 | 1.5 (1.0–2.1) | 15 | 2GMVA | 1 | 0 | 0 | 1 |
| TNFAIP8L2 | Tumor necrosis factor alpha-induced protein 8-like protein 2 | 1 | 0.0 | KIRC | 2.4 | 1.6 (1.1–2.2) | 3 | 3F4MA | 1 | 0 | 0 | 1 | |
| ANXA8L2 | Annexin A8-like protein 2 | 0 | 0.0 | KIRC | 2.1 | 1.7 (1.3–2.4) | 0 | 1W45B | 1 | 0 | 0 | 1 | |
| GSG2 | Serine/threonine-protein kinase haspin | 0 | 0.0 | BRCA | 2.0 | 1.6 (1.1–2.4) | 5 | 3DLZA | 1a | 1 | 1 | 0 | |
| RNASET2 | Ribonuclease T2 | 0 | 0.0 | KIRC | 3.2 | 1.9 (1.3–2.6) | 27 | 3T0OA | 1 | 0 | 0 | 1 | |
| NCF1C | Putative neutrophil cytosol factor 1C | 0 | 0.0 | GBM | 2.5 | 1.8 (1.2–2.7) | 0 | 1NG2A; 1KQ6A | 2 | 0 | 2 | 0 | |
| XDH | Xanthine dehydrogenase/oxidase | 0 | 0.0 | KIRC | 2.2 | 1.5 (1.0–2.1) | 34 | 2E1QD | 9 | 1 | 0 | 8 | |
| LUAD | 4.5 | 1.9 (1.4–2.7) | |||||||||||
| CHI3L2 | Chitinase-3-like protein 2 | 0 | 0.0 | GBM | 4.8 | 1.9 (1.3–2.9) | 5 | 4P8XA | 1 | 0 | 0 | 1 | |
| KIRC | 2.5 | 2.0 (1.5–2.8) | |||||||||||
| ALDH1L1 | Cytosolic 10-formyltetrahydrofolate dehydrogenase | 0 | 0.0 | LUSC | 2.5 | 1.4 (1.0–1.9) | 23 | 2CFIA | 1 | 1 | 0 | 0 | |
| AKR1D1 | 3-Oxo-5-beta-steroid 4-dehydrogenase | 0 | 0.0 | KIRC | 4.5 | 1.6 (1.2–2.2) | 5 | 3UZWB | 1 | 1 | 0 | 0 | |
| SERPIND1 | Heparin cofactor 2 | 0 | 0.0 | KIRC | 3.8 | 1.6 (1.2–2.2) | 5 | 1JMOA | 2 | 0 | 0 | 2 | |
| TCN1 | Transcobalamin-1 | 0 | 0.0 | LUAD | 6.9 | 1.5 (1.0–2.1) | 10 | 4KKJA | 1 | 0 | 0 | 1 | |
| PARP15 | Poly [ADP-ribose] polymerase 15 | 0 | 0.0 | KIRC | 3.1 | 1.5 (1.1–2.1) | 5 | 3GEYA | 1a | 1 | 0 | 0 | |
Among these targets, 26 have been previously probed with small-molecule ligands and X-ray crystallography (Table S4, ESI†). Interestingly, many of these co-crystallized structures occur at binding sites at or below our higher DrugScore cutoff of 1.0, suggesting that a more stringent cutoff may discard otherwise druggable binding sites. Additionally, we mapped these druggable binding sites to conserved protein domains, and find that these binding sites are mainly parts of the protein kinase, serpin, kinesin, and peptidase domains (Table S5, ESI†). When we consider only those without co-crystallized small-molecule inhibitors, protein kinases and trypsin domains are removed. The majority of binding sites across both targeted and untargeted proteins are classified as OTH. In well-studied systems where the active site is known, these OTH sites represent opportunities for allosteric regulation.
We next looked at the secondary structure of residues that compose the individual binding sites of these proteins across their individual binding site annotations. By examining the residues around a binding site, we generalized the type of secondary structures that were used to construct the binding site itself (Fig. S7, ESI†). The majority of binding sites identified were a mixture of secondary structures or random coils among all proteins with or without small molecule inhibitors. Combined, these two secondary structures generally making up the large majority of all binding sites in each binding site type. In each case, the least frequently observed secondary structure among these binding sites were the helix-like (i.e. α-helix, 310 helix, or π-helix) and sheet-like structures (i.e. beta bridges and beta bulges). We then examined the secondary structures of the residues of the binding partner inside PPI binding sites. About 27 and 46% of the residues of the binding partners in the binding site were coil-like and helical (α-helix, 310 helix, or π-helix), respectively. Only 10% of the binding sites were characterized by strand-like structures (β-sheet or β-bridge). The remaining PPI binding sites were a combination of these.
Missense mutations on protein structures
A set of somatic mutations were obtained from a recent study from TCGA's Pan-Cancer initiative.55 We identified missense mutations from this study onto patients in 7 of 10 diseases and mapped these to protein structures. We classified these mutations as being (i) adjacent to a binding site; (ii) elsewhere on the protein surface; or (iii) buried in the interior of the protein (Fig. 5A). We find that the majority of these missense mutations are found on the surface of proteins but not within a predicted binding site. The frequency of mutations occurring in the interior of a protein is higher than the frequency of mutations that occur at binding sites. We explored some of the proteins with mutations occurring most frequently in the binding site (Fig. 5B). They include well-known genes that have been previously reported to be heavily mutated in cancer such as PIK3CA,56SI,57 and PTEN.58 On the most commonly mutated target, PIK3CA, mutation rates are approximately five-fold less at the binding site than the entire protein. Also, among the top targets is BRAF, which features the common V600E mutation, and has been used for the rational design of small-molecule inhibitors of the mutant protein.59–61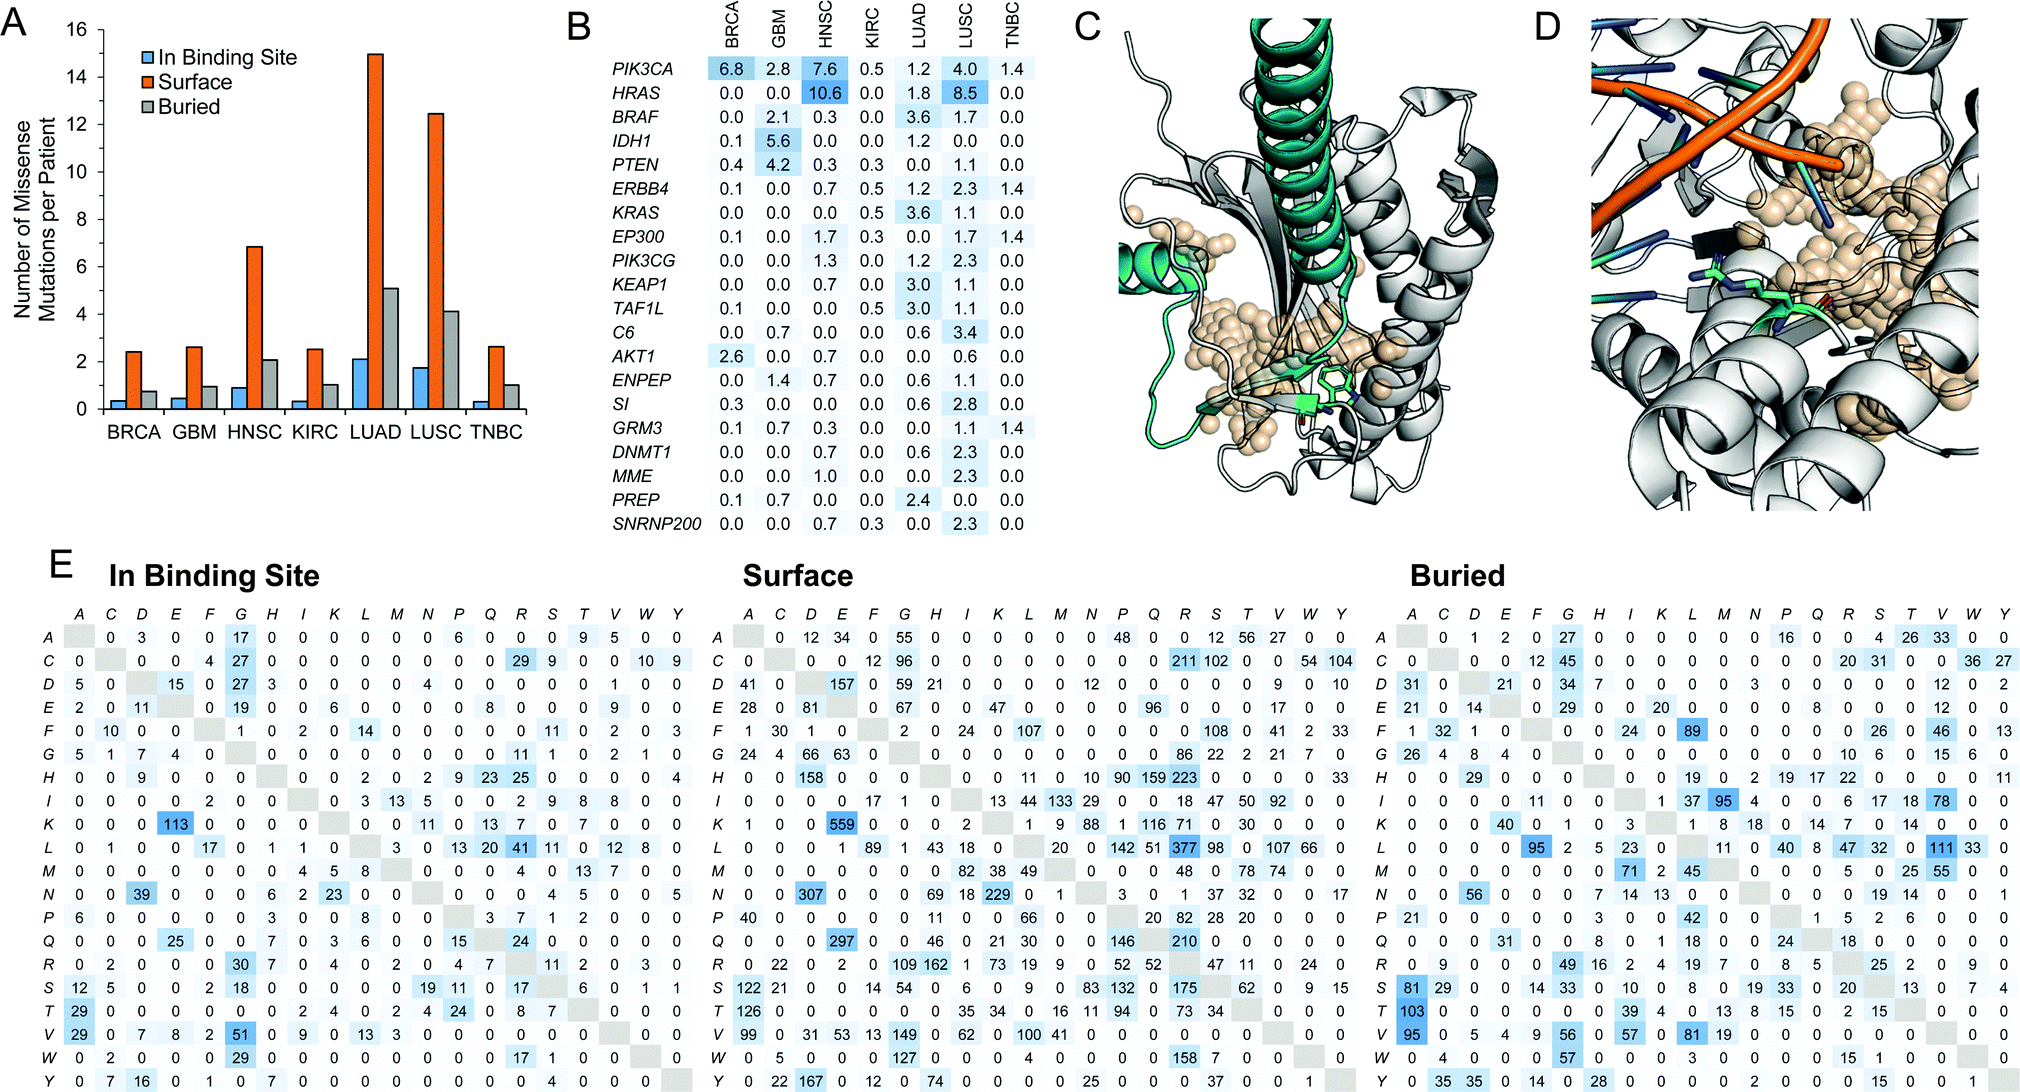 | ||
| Fig. 5 Proteins with missense mutations. (A) Missense mutations were mapped to patients in 7 of 10 diseases (COAD, THCA, and UCEC not included). Individual mutations were mapped to the protein structure and classified as being adjacent to the binding site, elsewhere on the protein surface, or buried in the interior of the protein structure. (B) Percentage of samples with missense mutations adjacent to a binding site in a given disease, showing the top 20 proteins rank-order using the sum of frequencies. (C) The W167L (green stick) mutation on the PPI interface between MAD2L1 (white) and MAD1L1 (cyan) is shown in cartoon (PDB ID: 1GO4). The PPI binding site is shown as transparent spheres. (D) The R121P (green stick) mutation adjacent to the DNA-binding OTH site (tan, transparent spheres) on EXO1 (white cartoon) (PDB ID: 3QEB). DNA in the binding site from the crystal structure is also shown as cartoon. (E) The counts of missense mutations at the amino acid level divided classified as being adjacent to the binding site, elsewhere on the surface of the protein, or buried in the protein interior. The original amino acid is listed row-wise and the subsequent mutation is listed column-wise. | ||
We matched these proteins with missense mutations with their gene expression levels and correlation with patient outcome. We find 29 binding sites on 26 proteins that are (i) overexpressed (log2 fold change ≥2); (ii) correlate with patient outcome (hazard ratio >1); and (iii) have a missense mutation adjacent to a binding site in a given disease (Table 8). These 29 binding sites include 9 ENZ, 3 PPI, and 17 OTH pockets. Among these mutations adjacent to binding sites is the W167L mutation on the PPI interface between MAD2L1 and MAD1L1 in LUAD (Fig. 5C). This interaction is part of the spindle assembly checkpoint in the cell cycle.62 Considering the significant reduction in contact area upon replacing tryptophan with leucine, and the fact that tryptophan residues tend to often occur at protein–protein interaction interfaces, we expect that this mutation may impair the protein–protein interaction. Another mutation is the R121P mutation adjacent to the DNA-binding OTH binding site on EXO1 in LUAD (Fig. 5D). The DNA-binding protein is also involved in DNA repair during cell cycle regulation.63 Unlike the previous mutation, arginine contains a positively charged group while proline is a neutral non-polar amino acid.
| Symbol | Name | Cancer type | Mutation | Type | |
|---|---|---|---|---|---|
| ADH1C | Alcohol dehydrogenase 1C | LUAD | G205C | 1HSZA1 | ENZ |
| ADORA2A | Adenosine receptor A2a | BRCA | R293P | 3VG9A5 | PPI |
| C3 | Complement C3 | KIRC | C873Y | 2WIIB4 | OTH |
| CA6 | Carbonic anhydrase 6 | LUSC | H113Q | 3FE4A1 | ENZ |
| CCNA2 | Cyclin-A2 | LUAD | L341F | 2BPMD1 | OTH |
| CCNE1 | G1/S-specific cyclin-E1 | BRCA | A338T | 1W98B2 | OTH |
| CHEK1 | Serine/threonine-protein kinase Chk1 | LUAD | V46A | 2R0UA1 | ENZ |
| CYP2A6 | Cytochrome P450 2A6 | LUAD | V306I | 2PG6B1 | OTH |
| CYP2D6 | Cytochrome P450 2D6 | KIRC | L213P | 3QM4A1 | OTH |
| EXO1 | Exonuclease 1 | LUAD | R121P | 3QEBZ1 | OTH |
| F2 | Prothrombin | KIRC | R543L | 4NZQA3 | OTH |
| KIF15 | Kinesin-like protein KIF15 | LUSC | G41A | 4BN2C2 | OTH |
| KIFC1 | Kinesin-like protein KIFC1 | LUAD | G568W | 2REPA1 | ENZ |
| MAD2L1 | Mitotic spindle assembly checkpoint protein MAD2A | LUAD | W167L | 2V64F1 | PPI |
| MELK | Maternal embryonic leucine zipper kinase | BRCA | Q115R | 4UMUA2 | OTH |
| LUAD | V271A | 4UMUA2 | OTH | ||
| NEK2 | Serine/threonine-protein kinase Nek2 | LUAD | R140L | 2XK4A1 | ENZ |
| PCK1 | Phosphoenolpyruvate carboxykinase, cytosolic [GTP] | LUAD | R137H | 2GMVA3 | OTH |
| A287S | 2GMVA1 | ENZ | |||
| G289W | |||||
| PSPH | Phosphoserine phosphatase | LUSC | M52T | 1L8OA1 | ENZ |
| RHCG | Ammonium transporter Rh type C | LUAD | Q107H | 3HD6A1 | PPI |
| RRM2 | Ribonucleoside-diphosphate reductase subunit M2 | LUAD | E207Q | 2UW2A2 | OTH |
| SERPINB3 | Serpin B3 | LUAD | A45T | 2ZV6A3 | OTH |
| SERPINB4 | Serpin B4 | LUAD | S33N | 2ZV6A2 | OTH |
| SULT4A1 | Sulfotransferase 4A1 | KIRC | M80R | 1ZD1A1 | ENZ |
| TOP2A | DNA topoisomerase 2-alpha | LUAD | E712V | 4FM9A4 | OTH |
| R736L | 4FM9A7 | OTH | |||
| TTK | Dual specificity protein kinase TTK | LUAD | C604F | 2ZMDA1 | ENZ |
| BRCA | G666E | 2ZMDA1 | ENZ | ||
| XDH | Xanthine dehydrogenase/oxidase | LUAD | C43F | 2E1QD3 | OTH |
| N461T | 2E1QD8 | OTH |
We examined the mutation rates of individual amino acids by looking at the wild-type and mutated amino acids as a result of a mutation at each of the three locations on the protein (Fig. 5E). We find differences in the relative frequencies of specific point mutations between each location. For example, mutations to alanine is less favored in the pocket or on the surface of the protein than it is in the interior, especially at charged or polar groups. Among the most common mutations in the binding site and on the surface is from lysine to glutamic acid, which occurs at a much lower frequency in the interior of the protein.
Discussion
The sequencing of the genome of human tumors has provided access to an unprecedented number of new opportunities for the development of cancer therapeutics. While biological methods such as siRNA or CRIPSR/Cas9 methods are useful tools to explore the role of potential targets, chemical tools provide a complementary approach to interrogate new targets. Small molecules do not affect the expression of the target thereby causing little disruption to the signaling networks. In addition, small molecules have significantly greater precision as they can be designed to binding to a single cavity within a protein and modulate the function of the protein by disruption of protein–protein interactions or enzyme activity. Small molecules can work either in an orthosteric manner if they directly interfere with the binding of a protein or a substrate. They can also work in an allosteric manner by binding to cavities located outside protein–protein and protein–substrate binding interfaces and modulating the conformation and dynamics of the target.For small molecules to engage their targets with high affinity, a well-defined cavity that possesses suitable shape and physicochemical properties. The lack of such cavities is partly responsible for the difficulty in developing small-molecule therapeutic agents that bind directly to highly promising cancer targets such as mutated RAS GTPase or transcription factors such as c-MYC. Conversely, the success of kinases as oncology targets can be attributed to the well-defined ATP-binding site. Using binding sites of kinases and other druggable targets, several algorithms have been developed to predict the druggable nature of a binding site using the three-dimensional structure of the protein that harbors them.64 Among them, SiteScore and DrugScore, which have been developed using data from binding sites occupied by approved drugs.25,28 Druggable sites, the highly conserved nature of the ATP-binding site has been the main impediment in the development of kinase drugs. Developing highly selective kinase inhibitors is notoriously difficult, although some successes have been reported. Identifying novel targets with unique druggable binding sites located on potential cancer targets may lead to cancer therapeutics with greater efficacy and lower toxicity.
Here, in an effort to facilitate the chemical probing of new targets in cancer, we explore RNA-seq data of 10 tumor types at TCGA to identify unique and druggable binding sites on proteins encoded by protein products of overexpressed genes. The large-scale effort of TCGA to sequence the genome of tumors from more than 30 cancers provides an unprecedented opportunity to uncover new targets for the development of cancer therapeutics. We identified genes whose mRNA levels are overexpressed in tumors compared with normal tissue. Patient data provided by TCGA was used to further narrow the list of targets to genes whose overexpression correlates strongly with patient survival. This was accomplished by constructing survival curves and evaluating a hazard ratio for each overexpressed gene. Genes with hazard ratio of 1 or greater where considered to correlate with worse patient survival. For each of the 10 diseases that we have considered in this work, we identified protein products of genes whose mRNA levels are differentially-expressed that strongly correlate with patient survival. Additionally, we explored these targets in the context of cancer related signaling pathways and the protein–protein interaction network.
The exponentially growing list of three-dimensional structures of proteins prompted us to search the PDB to identify structures for protein products of up-regulated genes that we identified. We used a stringent threshold for these scores to ensure that small molecules that bind to the druggable binding sites have the potential to be developed into therapeutic agents. Among all up-regulated genes we found that 23% of their protein products had a structure at the PDB. Among the 1218 proteins with structures, 405 (33%) had druggable binding sites. A similar ratio was found among individual diseases. For example, 51 proteins with a crystal structure from among 211 in TNBC had a druggable binding site, while 114 proteins with a crystal structure in LUAD were found to have a binding site among a total of 363. When overexpressed genes are further filtered by hazard ratio, a total of 54 proteins that possess druggable binding sites and 65 possessed binding sites are identified among 1344 differentially-expressed genes. There were 15 druggable proteins that are present in multiple tumor types. The most frequently-occurring were MELK in 4 tumors.
The presence of a binding site is not sufficient to serve as a suitable target site for chemical probe development and drug discovery. The binding site must possess functional relevance. Its position must be located at a site such that the binding of a small molecule will impair the function of the protein harboring the binding site. For example, small molecules that bind to a binding site located at an enzyme active site or protein–protein interface will disrupt enzyme activity or protein–protein interactions and thereby impair the function of the target protein. Binding sites located outside an enzyme active site or protein–protein interface, may or may not modulate the activity of a protein. We classified all binding sites into enzyme active sites, protein–protein interaction sites, or other sites with yet unknown function that may provide an opportunity to modulate protein function through an allosteric mechanism.
Many of the enzyme active sites occur on well-established oncology targets or have been inhibited by small molecules. However, there were several examples of enzymes whose function was explored in cancer but were never targeted with small molecules; these include PKMYT1, STEAP3, and NNMT. There were also several druggable active site binding sites that occurred on enzymes that have seldom been considered in cancer, such as PYCR1, HSPA6, and QPRT. We identified several proteins whose overexpression correlate with patient outcome that occurred at protein–protein interfaces. This discovery is highly significant as protein–protein interactions have been historically challenging due to the lack of well-defined binding sites at protein–protein interfaces.65,66 Protein–protein interfaces can offer an opportunity to develop highly selective compounds since many of these interfaces are structurally unique. Among all differentially-expressed proteins with binding sites, 18% have binding sites that occurred at protein–protein interfaces. For the proteins encoded by genes that correlate with patient survival, we identified 28 binding sites (7 druggable) on 25 proteins that occurred at protein–protein interfaces. Among these proteins, 13 have been studied in cancer. Examples include MEF2B, HNF4A, and CBX2. The remaining 15 proteins have seldom been studied in cancer, such as CASC5 and ZBTB32. Interestingly, several protein structures possess both PPI and ENZ binding sites either on the same domain (e.g. GAD1, NAMPT, and NR1I2) or on different domains (e.g. EPHB2, PLK1, and NTRK1). Small molecules that bind to a binding site on these proteins may serve as allosteric modulator of PPI interactions.
We found that the majority of binding sites were not located either at an enzyme active site or protein–protein interaction site. We refer to these binding sites as other (OTH). Of the 601 unique binding sites on the 202 proteins encoded by genes whose overexpression correlates with patient survival, 102 are ENZ, 46 are PPI, 444 are OTH, and 9 have been classified as both ENZ and PPI. It is likely that many of these OTH binding sites occur at protein–protein interfaces. To explore this possibility, we searched protein–protein interaction databases such as PrePPI for binding partners. Among 759 OTH binding sites located on overexpressed proteins, we identified 17 candidates that have the potential to be located at PPI interfaces. Examples of these proteins include ANK1, CHN1, and NCS1. While OTH binding sites that occur at enzyme active sites or protein–protein interaction sites can be used to develop probes that directly modulates the function of the target harboring these binding sites, the remaining OTH binding sites can provide an opportunity to modulate receptors through an allosteric mechanism.31,67 Whether a small molecule that binds to a binding site will allosterically modulate enzyme function or a PPI interaction is difficult to predict. Small molecules can serve as positive or negative allosteric regulators.34,68,69 These OTH binding sites can also be used for the development of small molecules that can be attached to probes for proteasome degradation.70
Finally, we mapped mutations that were previously identified at TCGA55 onto the three-dimensional structure of proteins that are encoded by overexpressed genes that correlate with patient outcome. A recent study explored the role of mutations on tumorigenesis71 and more recently using a structural genomics based approach.72,73 Our work complements these studies by identifying druggable binding pockets and classifying pockets into whether they occur at enzyme active sites or protein–protein interaction sites. Mutations that occur within these pockets are expected to have direct consequences to the function of a protein. These pockets could provide promising targets for the development of small-molecule therapeutic agents. Interestingly, several mutations occurred in enzyme active sites. These mutations may either enhance or inhibit enzyme activity. Most of the enzyme mutations appear to involve dramatic changes in physico-chemical properties such as H113Q, G568W, R140L, M80R for CA6, KIFC1, NEK2, and SULT4A1. Others involved subtler mutations such as V46A, A287S, and M52T for CHEK1, PCK1, and PSPH, respectively. Since we have focused on proteins that are expected to be overexpressed, it is likely that these mutations will further enhance the activity of these enzymes. Three mutations were identified to occur at protein–protein interfaces, R293P, W167L, and Q107H, which correspond to ADORA2A, MAD2L1, and RHCG, respectively. The first two may have disruptive effects considering that proline residues tend to disrupt secondary structures and tryptophan residues are generally believed to tighten protein–protein interactions. The overwhelming majority occurred at OTH binding sites. These mutations provide an opportunity to validate the importance of these pockets. It suggests that these pockets may be located at unknown active sites or protein–protein interfaces. Considering that many of these OTH pockets occur on enzymes, it is more likely that they may be located at a protein–protein interface and could be useful targets for the disruption of protein–protein interactions.
Materials and methods
Gene expression
Level 3 gene expression data expressed using RNA-seq (RNASeq Version 2) technology for ten cancer types was retrieved from The Cancer Genome Atlas (TCGA). Triple-negative breast cancer (TNBC) patients were identified from a subset of patients in BRCA by filtering clinical records for breast cancer patients who were negative for estrogen receptor (ER), progesterone receptor (PR), and Her2/neu. The gene expression data was used to build a matrix of read counts for each sample against each mapped gene. Only samples with designations of either the primary solid tumor or the solid tissue normal were kept in this matrix. Differential expression analyses between cancer and normal samples in the RNA-seq expression profiles were conducted using default parameters in the edgeR74 package in R.75 Differentially-expressed (overexpressed) genes were defined as those genes with p < 0.001 and Q < 0.05. Two log2 fold changes of ≥2.0 and ≥1.5 were used to filtered genes for further analysis. Gene symbols provided by TCGA were mapped to their respective UniProt IDs using UniProt's mapping tool (http://www.uniprot.org/mapping/).Protein structures
An annotated set of 20192 reference human protein identifiers was retrieved from UniProtKB/SwissProt.35 The FASTA sequences were retrieved for each of these proteins and used to identify structures in the RCSB Protein Data Bank (PDB).76 Each FASTA sequence was queried against the pdbaa dataset using BLASTP (protein–protein BLAST v2.2.25+).77 To limit the search to protein structures that possess significant sequence identity and coverage to the query sequence, only structures with E-value <10−5, >90% sequence identity, and PDB sequence coverage >80% were kept. We then identified the experimental methodology, taxonomy of the identified protein chain, and the structural resolution if the structure was from X-ray diffraction. Previously identified structures were then filtered for only crystal structures from human proteins with a resolution better than 3 Å. To reduce the number of redundant structures identified by BLASTP and generate a representative set of crystal structures associated with each protein, CD-HIT (v4.6.1)78 was used with default parameters to cluster the FASTA sequences of the PDB structures identified for each of the proteins. Only cluster centers identified by CD-HIT were used to locate binding sites on the structures for the protein. In total, 4124 proteins had at least one crystal structure that met all of these criteria.
Binding site identification
Identification of druggable binding sites on the crystal structures was carried out using the Schrödinger Software Suite. For each cluster identified by CD-HIT, the cluster centers (i.e. the representative structures) were used to identify binding sites. Structures were first retrieved from PDB and binding partners were removed to identify the monomeric representative structures. All other heteroatoms, including solvent molecules and bound ligands, were removed. Selenomethonine residues were converted to methonines. These preprocessed PDB monomeric structures were then processed using the Protein Preparation Wizard workflow. Missing side chains and loops were added with the Prime79 module. Disulfide bonds were added and each crystal structure was protonated using PROPKA at pH 7.0. Binding sites were identified using the SiteMap25 module in Schrödinger on the processed structure. Up to 10 binding sites were kept, while all other parameters were left default. Only binding sites28 with SiteScore and DrugScore above 0.8 were kept. The average coordinates of the SiteMap spheres were used to identify the centroid of the binding site. Druggable binding sites were distinguished as those with a DrugScore above 1.0. In total, we identified 5498 binding sites on 2607 proteins.Binding site annotation
PyMOL80 scripts were generated to create individual sessions for each protein with druggable binding sites. The unprocessed protein structure, including all bound ligands and other non-solvent molecules was overlaid back atop the crystal structure. In addition, all redundant structures from the CD-HIT clustering were added and aligned back to the druggable protein. The location of enzymatic binding residues were retrieved from UniProt35 and Catalytic Site Atlas36 and highlighted on the processed protein structures.Each binding site identified by SiteMap was visually inspected and manually annotated to determine its functional role in the protein. If an enzymatic residue was in contact with the SiteMap spheres, or if an enzymatic molecule or inhibitor occupied the space of the spheres, the binding site was labeled ‘enzymatic’ (ENZ). If the binding site was at a protein–protein interaction (PPI) interface on the original structure or on any of the aligned structures, the binding site was labeled ‘PPI’. Otherwise, if the binding site was neither enzymatic nor part of the interaction interface, it was labeled ‘Other’ (OTH). Binding sites of the recognition site of human leukocyte antigens (HLAs) and heme cofactor binding site of Cytochrome P450s were labeled ‘Other’.
Secondary structures for each of the binding sites and their interaction partners were retrieved from DSSP.81 The secondary structure of each residue of a crystal structure are classified into helix, sheet, or coil in DSSP. The number of residues falling into each category was retrieved for the residues within 5 Å of the binding site. If there is at least a 60% consensus in the secondary structures for these residues, it was assigned into that category. Otherwise, the binding site was considered mixed.
Survival analysis
Kaplan–Meier curves were built using the survival82 package in R.75 For each disease, each patient's time to last follow-up or time to death was collected from the clinical data depending on whether or not the patient was deceased. A patient's overall survival was paired with their respective log2CPM and for diseases using RNA-seq. Expression levels for each gene was separated into ‘high expression’ and ‘low expression’ groups using the median expression of the gene across all patients for a given disease. A Cox proportional hazards regression model was fitted to the survival profile to determine the hazard ratio (HR) of each gene. Genes were filtered using p < 0.05 and HR > 1.0.
Signaling pathway
27 cancer related signaling pathways were collected from KEGG.47 Individual proteins within each of these pathways were collected and mapped to their respective UniProt IDs using the REST API in KEGG. Any protein that could not be mapped to a UniProt entry from the reference protein identifiers was filtered out.Protein–protein interaction network
A protein–protein interaction network was constructed using the NetworkX83 module in Python by retrieving human PPI data with experimental evidence from seven major interaction databases: Biomolecular Interaction Network Database (BIND),84 BioGRID,85 Database of Interacting Proteins (DIP),86 Human Protein Reference Database (HPRD),87 IntAct,88 Molecular INTeraction database (MINT),89 and Reactome.90 Only those interactions with at least two occurrences among the seven databases were kept. The resulting network featured 9665 nodes and 38164 edges.
Missense mutations
Mutations were obtained from a recent study by Kandoth and coworkers.55 The work identified somatic variants from 12 cancers as part of TCGA's Pan-Cancer initiative. We only use missense mutation data as other mutations result in the insertion or deletion of amino acids from the protein sequence, which would be very difficult to model onto the three-dimensional structure of the protein. Mutations were mapped using the sample ID barcode provided by TCGA to match patients with both mutation and gene expression data. The data for three diseases were not used since THCA was not included in the original study, while COAD and UCEC had low numbers of patient samples with matched gene expression data. Genes were mapped from Ensembl Transcript IDs to UniProt IDs using UniProt's mapping tool. For each protein, the subsequent amino acid position on the protein sequence was mapped to the protein structure using the pairwise function in BLASTP. Each mutation was then classified by minimizing the Euclidean distance from the corresponding alpha carbon of the mutated residue to the site points (grid spheres) of each binding site on the protein structure. In addition, the solvent-accessible surface area (SASA) of the mutated residue was calculated using NACCESS.91 We used the SASA and distance to the closest binding site to classify each mutation as being (i) adjacent to a binding site; (ii) elsewhere on the protein surface; or (iii) buried in the interior of the protein. If the distance between the mutation and the closest binding site was less than 4 Å, the mutation was classified as being adjacent to the binding pocket. Otherwise, if the SASA of the mutated residue was greater than 10 Å2, the mutation was classified as being on the surface of the protein. If the mutation did not fit into either of these criteria, it was classified as located in the interior of the protein.Acknowledgements
The research was supported by the National Institutes of Health (CA135380) (SOM), the American Cancer Society Research Scholar Grant RSG-12-092-01-CDD (SOM), by the 100 Voices of Hope (SOM), and by the Komen Foundation (GWS).References
- D. Hanahan and R. A. Weinberg, The hallmarks of cancer, Cell, 2000, 100, 57–70 CrossRef CAS PubMed.
- J. N. Weinstein, E. A. Collisson, G. B. Mills, K. R. M. Shaw, B. A. Ozenberger, K. Ellrott, I. Shmulevich, C. Sander and J. M. Stuart, The Cancer Genome Atlas Research Network, The cancer genome atlas pan-cancer analysis project, Nat. Genet., 2013, 45, 1113–1120 CrossRef PubMed.
- The Cancer Genome Atlas Research Network, Integrated genomic analyses of ovarian carcinoma, Nature, 2011, 474, 609–615 CrossRef PubMed.
- The Cancer Genome Atlas Research Network, Comprehensive molecular characterization of human colon and rectal cancer, Nature, 2012, 487, 330–337 CrossRef PubMed.
- The Cancer Genome Atlas Research Network, Comprehensive molecular portraits of human breast tumours, Nature, 2012, 490, 61–70 CrossRef PubMed.
- The Cancer Genome Atlas Research Network, Comprehensive molecular characterization of clear cell renal cell carcinoma, Nature, 2013, 499, 43–49 CrossRef PubMed.
- The Cancer Genome Atlas Research Network, Comprehensive molecular profiling of lung adenocarcinoma, Nature, 2014, 511, 543–550 CrossRef PubMed.
- The Cancer Genome Atlas Research Network, Comprehensive genomic characterization of squamous cell lung cancers, Nature, 2012, 489, 519–525 CrossRef PubMed.
- The Cancer Genome Atlas Research Network, Comprehensive genomic characterization of squamous cell lung cancers, Nature, 2012, 489, 519–525 CrossRef PubMed.
- B. A. Weir, M. S. Woo, G. Getz, S. Perner, L. Ding, R. Beroukhim, W. M. Lin, M. A. Province, A. Kraja, L. A. Johnson, K. Shah, M. Sato, R. K. Thomas, J. A. Barletta, I. B. Borecki, S. Broderick, A. C. Chang, D. Y. Chiang, L. R. Chirieac, J. Cho, Y. Fujii, A. F. Gazdar, T. Giordano, H. Greulich, M. Hanna, B. E. Johnson, M. G. Kris, A. Lash, L. Lin, N. Lindeman, E. R. Mardis, J. D. McPherson, J. D. Minna, M. B. Morgan, M. Nadel, M. B. Orringer, J. R. Osborne, B. Ozenberger, A. H. Ramos, J. Robinson, J. A. Roth, V. Rusch, H. Sasaki, F. Shepherd, C. Sougnez, M. R. Spitz, M. S. Tsao, D. Twomey, R. G. Verhaak, G. M. Weinstock, D. A. Wheeler, W. Winckler, A. Yoshizawa, S. Yu, M. F. Zakowski, Q. Zhang, D. G. Beer, Wistuba, II, M. A. Watson, L. A. Garraway, M. Ladanyi, W. D. Travis, W. Pao, M. A. Rubin, S. B. Gabriel, R. A. Gibbs, H. E. Varmus, R. K. Wilson, E. S. Lander and M. Meyerson, Characterizing the cancer genome in lung adenocarcinoma, Nature, 2007, 450, 893–898 CrossRef CAS PubMed.
- S. Zhao, W. P. Fung-Leung, A. Bittner, K. Ngo and X. Liu, Comparison of RNA-Seq and microarray in transcriptome profiling of activated T cells, PLoS One, 2014, 9, e78644 Search PubMed.
- S. L. Spruance, J. E. Reid, M. Grace and M. Samore, Hazard ratio in clinical trials, Antimicrob. Agents Chemother., 2004, 48, 2787–2792 CrossRef CAS PubMed.
- C. Vogel and E. M. Marcotte, Insights into the regulation of protein abundance from proteomic and transcriptomic analyses, Nat. Rev. Genet., 2012, 13, 227–232 CAS.
- R. de Sousa Abreu, L. O. Penalva, E. M. Marcotte and C. Vogel, Global signatures of protein and mRNA expression levels, Mol. BioSyst., 2009, 5, 1512–1526 Search PubMed.
- T. Maier, M. Guell and L. Serrano, Correlation of mRNA and protein in complex biological samples, FEBS Lett., 2009, 583, 3966–3973 CrossRef CAS PubMed.
- J. Moffat and D. M. Sabatini, Building mammalian signalling pathways with RNAi screens, Nat. Rev. Mol. Cell Biol., 2006, 7, 177–187 CrossRef CAS PubMed.
- P. D. Hsu, E. S. Lander and F. Zhang, Development and Applications of CRISPR-Cas9 for Genome Engineering, Cell, 2014, 157, 1262–1278 CrossRef CAS PubMed.
- N. A. Khazanov and H. A. Carlson, Exploring the composition of protein-ligand binding sites on a large scale, PLoS Comput. Biol., 2013, 9, e1003321 Search PubMed.
- D. Kuhn, N. Weskamp, E. Hullermeier and G. Klebe, Functional classification of protein kinase binding sites using cavbase, ChemMedChem, 2007, 2, 1432–1447 CrossRef CAS PubMed.
- V. Le Guilloux, P. Schmidtke and P. Tuffery, Fpocket: an open source platform for ligand pocket detection, BMC Bioinf., 2009, 10, 168 CrossRef PubMed.
- B. Huang and M. Schroeder, LIGSITEcsc: predicting ligand binding sites using the Connolly surface and degree of conservation, BMC Struct. Biol., 2006, 6, 19 CrossRef PubMed.
- A. T. Laurie and R. M. Jackson, Q-SiteFinder: an energy-based method for the prediction of protein-ligand binding sites, Bioinformatics, 2005, 21, 1908–1916 CrossRef CAS PubMed.
- J. An, M. Totrov and R. Abagyan, Pocketome via comprehensive identification and classification of ligand binding envelopes, Mol. Cell. Proteomics, 2005, 4, 752–761 CAS.
- D. Ghersi and R. Sanchez, Improving accuracy and efficiency of blind protein-ligand docking by focusing on predicted binding sites, Proteins, 2009, 74, 417–424 CrossRef CAS PubMed.
- T. Halgren, New method for fast and accurate binding-site identification and analysis, Chem. Biol. Drug Des., 2007, 69, 146–148 CAS.
- Z. Zhang, Y. Li, B. Lin, M. Schroeder and B. Huang, Identification of cavities on protein surface using multiple computational approaches for drug binding site prediction, Bioinformatics, 2011, 27, 2083–2088 CrossRef CAS PubMed.
- J. Zhang, P. L. Yang and N. S. Gray, Targeting cancer with small molecule kinase inhibitors, Nat. Rev. Cancer, 2009, 9, 28–39 CrossRef CAS PubMed.
- T. A. Halgren, Identifying and characterizing binding sites and assessing druggability, J. Chem. Inf. Model., 2009, 49, 377–389 CrossRef CAS PubMed.
- A. I. Papadakis, C. Sun, T. A. Knijnenburg, Y. Xue, W. Grernrum, M. Holzel, W. Nijkamp, L. F. Wessels, R. L. Beijersbergen, R. Bernards and S. Huang, SMARCE1 suppresses EGFR expression and controls responses to MET and ALK inhibitors in lung cancer, Cell Res., 2015, 25, 445–458 CrossRef CAS PubMed.
- L. Li, V. N. Uversky, A. K. Dunker and S. O. Meroueh, A computational investigation of allostery in the catabolite activator protein, J. Am. Chem. Soc., 2007, 129, 15668–15676 CrossRef CAS PubMed.
- R. Nussinov and C.-J. Tsai, Allostery in disease and in drug discovery, Cell, 2013, 153, 293–305 CrossRef CAS PubMed.
- B. DeLaBarre, S. Gross, C. Fang, Y. Gao, A. Jha, F. Jiang, J. J. Song, W. Wei and J. B. Hurov, Full-length human glutaminase in complex with an allosteric inhibitor, Biochemistry, 2011, 50, 10764–10770 CrossRef CAS PubMed.
- W. I. Wu, W. C. Voegtli, H. L. Sturgis, F. P. Dizon, G. P. Vigers and B. J. Brandhuber, Crystal structure of human AKT1 with an allosteric inhibitor reveals a new mode of kinase inhibition, PLoS One, 2010, 5, e12913 Search PubMed.
- D. Liu, D. Zhou, B. Wang, W. E. Knabe and S. O. Meroueh, A New Class of Orthosteric uPAR.uPA Small-Molecule Antagonists Are Allosteric Inhibitors of the uPAR.Vitronectin Interaction, ACS Chem. Biol., 2015, 10, 1521–1534 CrossRef CAS PubMed.
- UniProt Consortium, Reorganizing the protein space at the Universal Protein Resource (UniProt), Nucleic Acids Res., 2012, 40, D71–D75 CrossRef PubMed.
- C. T. Porter, G. J. Bartlett and J. M. Thornton, The Catalytic Site Atlas: a resource of catalytic sites and residues identified in enzymes using structural data, Nucleic Acids Res., 2004, 32, D129–D133 CrossRef CAS PubMed.
- S. A. Roberts, M. S. Lawrence, L. J. Klimczak, S. A. Grimm, D. Fargo, P. Stojanov, A. Kiezun, G. V. Kryukov, S. L. Carter, G. Saksena, S. Harris, R. R. Shah, M. A. Resnick, G. Getz and D. A. Gordenin, An APOBEC cytidine deaminase mutagenesis pattern is widespread in human cancers, Nat. Genet., 2013, 45, 970–976 CrossRef CAS PubMed.
- K. Zarrabi, A. Dufour, J. Li, C. Kuscu, A. Pulkoski-Gross, J. Zhi, Y. Hu, N. S. Sampson, S. Zucker and J. Cao, Inhibition of matrix metalloproteinase 14 (MMP-14)-mediated cancer cell migration, J. Biol. Chem., 2011, 286, 33167–33177 CrossRef CAS PubMed.
- K. Valencia, C. Ormazabal, C. Zandueta, D. Luis-Ravelo, I. Anton, M. J. Pajares, J. Agorreta, L. M. Montuenga, S. Martinez-Canarias, B. Leitinger and F. Lecanda, Inhibition of collagen receptor discoidin domain receptor-1 (DDR1) reduces cell survival, homing, and colonization in lung cancer bone metastasis, Clin. Cancer Res., 2012, 18, 969–980 CrossRef CAS PubMed.
- A. Garten, S. Petzold, A. Korner, S. Imai and W. Kiess, Nampt: linking NAD biology, metabolism and cancer, Trends Endocrinol. Metab., 2009, 20, 130–138 CrossRef CAS PubMed.
- N. M. Goodey and S. J. Benkovic, Allosteric regulation and catalysis emerge via a common route, Nat. Chem. Biol., 2008, 4, 474–482 CrossRef CAS PubMed.
- Y. Choi, M. A. Seeliger, S. B. Panjarian, H. Kim, X. Deng, T. Sim, B. Couch, A. J. Koleske, T. E. Smithgall and N. S. Gray, N-myristoylated c-Abl tyrosine kinase localizes to the endoplasmic reticulum upon binding to an allosteric inhibitor, J. Biol. Chem., 2009, 284, 29005–29014 CrossRef CAS PubMed.
- J. M. Ostrem, U. Peters, M. L. Sos, J. A. Wells and K. M. Shokat, K-Ras(G12C) inhibitors allosterically control GTP affinity and effector interactions, Nature, 2013, 503, 548–551 CrossRef CAS PubMed.
- Q. C. Zhang, D. Petrey, J. I. Garzon, L. Deng and B. Honig, PrePPI: a structure-informed database of protein-protein interactions, Nucleic Acids Res., 2013, 41, D828–833 CrossRef CAS PubMed.
- F. Li, Y. Zhang and C. Wu, Integrin-linked kinase is localized to cell-matrix focal adhesions but not cell-cell adhesion sites and the focal adhesion localization of integrin-linked kinase is regulated by the PINCH-binding ANK repeats, J. Cell Sci., 1999, 112(Pt 24), 4589–4599 CAS.
- S. Ahmed, J. Lee, R. Kozma, A. Best, C. Monfries and L. Lim, A novel functional target for tumor-promoting phorbol esters and lysophosphatidic acid. The p21rac-GTPase activating protein n-chimaerin, J. Biol. Chem., 1993, 268, 10709–10712 CAS.
- M. Kanehisa, S. Goto, Y. Sato, M. Furumichi and M. Tanabe, KEGG for integration and interpretation of large-scale molecular data sets, Nucleic Acids Res., 2012, 40, D109–D114 CrossRef CAS PubMed.
- M. A. Yildirim, K. I. Goh, M. E. Cusick, A. L. Barabasi and M. Vidal, Drug-target network, Nat. Biotechnol., 2007, 25, 1119–1126 CrossRef CAS PubMed.
- K. I. Goh, M. E. Cusick, D. Valle, B. Childs, M. Vidal and A. L. Barabasi, The human disease network, Proc. Natl. Acad. Sci. U. S. A., 2007, 104, 8685–8690 CrossRef CAS PubMed.
- M. Campillos, M. Kuhn, A. C. Gavin, L. J. Jensen and P. Bork, Drug target identification using side-effect similarity, Science, 2008, 321, 263–266 CrossRef CAS PubMed.
- J. Lamb, E. D. Crawford, D. Peck, J. W. Modell, I. C. Blat, M. J. Wrobel, J. Lerner, J. P. Brunet, A. Subramanian, K. N. Ross, M. Reich, H. Hieronymus, G. Wei, S. A. Armstrong, S. J. Haggarty, P. A. Clemons, R. Wei, S. A. Carr, E. S. Lander and T. R. Golub, The connectivity map: using gene-expression signatures to connect small molecules, genes, and disease, Science, 2006, 313, 1929–1935 CrossRef CAS PubMed.
- I. W. Taylor, R. Linding, D. Warde-Farley, Y. Liu, C. Pesquita, D. Faria, S. Bull, T. Pawson, Q. Morris and J. L. Wrana, Dynamic modularity in protein interaction networks predicts breast cancer outcome, Nat. Biotechnol., 2009, 27, 199–204 CrossRef CAS PubMed.
- A. L. Barabasi, N. Gulbahce and J. Loscalzo, Network medicine: a network-based approach to human disease, Nat. Rev. Genet., 2011, 12, 56–68 CrossRef CAS PubMed.
- T. Chen, Y. Sun, P. Ji, S. Kopetz and W. Zhang, Topoisomerase IIalpha in chromosome instability and personalized cancer therapy, Oncogene, 2014, 34, 4019–4031 CrossRef PubMed.
- C. Kandoth, M. D. McLellan, F. Vandin, K. Ye, B. Niu, C. Lu, M. Xie, Q. Zhang, J. F. McMichael, M. A. Wyczalkowski, M. D. Leiserson, C. A. Miller, J. S. Welch, M. J. Walter, M. C. Wendl, T. J. Ley, R. K. Wilson, B. J. Raphael and L. Ding, Mutational landscape and significance across 12 major cancer types, Nature, 2013, 502, 333–339 CrossRef CAS PubMed.
- B. Karakas, K. E. Bachman and B. H. Park, Mutation of the PIK3CA oncogene in human cancers, Br. J. Cancer, 2006, 94, 455–459 CrossRef CAS PubMed.
- D. Rodriguez, A. J. Ramsay, V. Quesada, C. Garabaya, E. Campo, J. M. Freije and C. Lopez-Otin, Functional analysis of sucrase-isomaltase mutations from chronic lymphocytic leukemia patients, Hum. Mol. Genet., 2013, 22, 2273–2282 CrossRef CAS PubMed.
- I. Rodriguez-Escudero, M. D. Oliver, A. Andres-Pons, M. Molina, V. J. Cid and R. Pulido, A comprehensive functional analysis of PTEN mutations: implications in tumor- and autism-related syndromes, Hum. Mol. Genet., 2011, 20, 4132–4142 CrossRef CAS PubMed.
- C. Sun, L. Wang, S. Huang, G. J. Heynen, A. Prahallad, C. Robert, J. Haanen, C. Blank, J. Wesseling, S. M. Willems, D. Zecchin, S. Hobor, P. K. Bajpe, C. Lieftink, C. Mateus, S. Vagner, W. Grernrum, I. Hofland, A. Schlicker, L. F. Wessels, R. L. Beijersbergen, A. Bardelli, F. Di Nicolantonio, A. M. Eggermont and R. Bernards, Reversible and adaptive resistance to BRAF(V600E) inhibition in melanoma, Nature, 2014, 508, 118–122 CrossRef CAS PubMed.
- P. A. Ascierto, J. M. Kirkwood, J. J. Grob, E. Simeone, A. M. Grimaldi, M. Maio, G. Palmieri, A. Testori, F. M. Marincola and N. Mozzillo, The role of BRAF V600 mutation in melanoma, J. Transl. Med., 2012, 10, 85 CrossRef CAS PubMed.
- E. R. Cantwell-Dorris, J. J. O'Leary and O. M. Sheils, BRAFV600E: implications for carcinogenesis and molecular therapy, Mol. Cancer Ther., 2011, 10, 385–394 CrossRef CAS PubMed.
- Y. Guo, X. Zhang, M. Yang, X. Miao, Y. Shi, J. Yao, W. Tan, T. Sun, D. Zhao, D. Yu, J. Liu and D. Lin, Functional evaluation of missense variations in the human MAD1L1 and MAD2L1 genes and their impact on susceptibility to lung cancer, J. Med. Genet., 2010, 47, 616–622 CrossRef CAS PubMed.
- N. Tomimatsu, B. Mukherjee, M. Catherine Hardebeck, M. Ilcheva, C. Vanessa Camacho, J. Louise Harris, M. Porteus, B. Llorente, K. K. Khanna and S. Burma, Phosphorylation of EXO1 by CDKs 1 and 2 regulates DNA end resection and repair pathway choice, Nat. Commun., 2014, 5, 3561 Search PubMed.
- P. Schmidtke, C. Souaille, F. Estienne, N. Baurin and R. T. Kroemer, Large-scale comparison of four binding site detection algorithms, J. Chem. Inf. Model., 2010, 50, 2191–2200 CrossRef CAS PubMed.
- H. Jubb, T. L. Blundell and D. B. Ascher, Flexibility and small pockets at protein-protein interfaces: new insights into druggability, Prog. Biophys. Mol. Biol., 2015, 119, 2–9 CrossRef CAS PubMed.
- J. A. Wells and C. L. McClendon, Reaching for high-hanging fruit in drug discovery at protein-protein interfaces, Nature, 2007, 450, 1001–1009 CrossRef CAS PubMed.
- R. Nussinov and C.-J. Tsai, The different ways through which specificity works in orthosteric and allosteric drugs, Curr. Pharm. Des., 2012, 18, 1311–1316 CrossRef CAS PubMed.
- C. E. Heise, J. Murray, K. E. Augustyn, B. Bravo, P. Chugha, F. Cohen, A. M. Giannetti, P. Gibbons, R. N. Hannoush and B. R. Hearn, Mechanistic and Structural Understanding of Uncompetitive Inhibitors of Caspase-6, PLoS One, 2012, 7, e50864 CAS.
- S. Orlicky, X. J. Tang, V. Neduva, N. Elowe, E. D. Brown, F. Sicheri and M. Tyers, An allosteric inhibitor of substrate recognition by the SCF(Cdc4) ubiquitin ligase, Nat. Biotechnol., 2010, 28, 733–737 CrossRef CAS PubMed.
- T. K. Neklesa, H. S. Tae, A. R. Schneekloth, M. J. Stulberg, T. W. Corson, T. B. Sundberg, K. Raina, S. A. Holley and C. M. Crews, Small-molecule hydrophobic tagging-induced degradation of HaloTag fusion proteins, Nat. Chem. Biol., 2011, 7, 538–543 CrossRef CAS PubMed.
- F. Cheng, P. Jia, Q. Wang, C. C. Lin, W. H. Li and Z. Zhao, Studying tumorigenesis through network evolution and somatic mutational perturbations in the cancer interactome, Mol. Biol. Evol., 2014, 31, 2156–2169 CrossRef CAS PubMed.
- J. Zhao, F. Cheng, Y. Wang, C. L. Arteaga and Z. Zhao, Systematic Prioritization of Druggable Mutations in Approximately 5000 Genomes Across 16 Cancer Types Using a Structural Genomics-based Approach, Mol. Cell. Proteomics, 2016, 15, 642–656 CAS.
- H. Vuong, F. Cheng, C. C. Lin and Z. Zhao, Functional consequences of somatic mutations in cancer using protein pocket-based prioritization approach, Genome Med., 2014, 6, 81 CrossRef PubMed.
- M. D. Robinson, D. J. McCarthy and G. K. Smyth, edgeR: a bioconductor package for differential expression analysis of digital gene expression data, Bioinformatics, 2010, 26, 139–140 CrossRef CAS PubMed.
- R Core Team, R: A Language and Environment for Statistical Computing, R Foundation for Statistical Computing, 2013 Search PubMed.
- P. W. Rose, B. Beran, C. Bi, W. F. Bluhm, D. Dimitropoulos, D. S. Goodsell, A. Prlic, M. Quesada, G. B. Quinn, J. D. Westbrook, J. Young, B. Yukich, C. Zardecki, H. M. Berman and P. E. Bourne, The RCSB protein data bank: redesigned web site and web services, Nucleic Acids Res., 2011, 39, D392–D401 CrossRef CAS PubMed.
- S. F. Altschul, W. Gish, W. Miller, E. W. Myers and D. J. Lipman, Basic local alignment search tool, J. Mol. Biol., 1990, 215, 403–410 CrossRef CAS PubMed.
- L. Fu, B. Niu, Z. Zhu, S. Wu and W. Li, CD-HIT: accelerated for clustering the next-generation sequencing data, Bioinformatics, 2012, 28, 3150–3152 CrossRef CAS PubMed.
- M. P. Jacobson, R. A. Friesner, Z. Xiang and B. Honig, On the Role of the Crystal Environment in Determining Protein Side-chain Conformations, J. Mol. Biol., 2002, 320, 597–608 CrossRef CAS PubMed.
- Schrodinger LLC, The PyMOL Molecular Graphics System, Version 1.3r1, 2010 Search PubMed.
- W. Kabsch and C. Sander, Dictionary of protein secondary structure: pattern recognition of hydrogen-bonded and geometrical features, Biopolymers, 1983, 22, 2577–2637 CrossRef CAS PubMed.
- T. M. Therneau, A Package for Survival Analysis in S, 2014 Search PubMed.
- A. A. Hagberg, D. A. Schult and P. J. Swart, Exploring network structure, dynamics, and function using NetworkX, in Proceedings of the 7th Python in Science Conference (SciPy2008), ed. G. Varoquaux, T. Vaught, and J. Millman, Pasadena, CA, 2008.
- G. D. Bader, D. Betel and C. W. Hogue, BIND: the Biomolecular Interaction Network Database, Nucleic Acids Res., 2003, 31, 248–250 CrossRef CAS PubMed.
- C. Stark, B. J. Breitkreutz, T. Reguly, L. Boucher, A. Breitkreutz and M. Tyers, BioGRID: a general repository for interaction datasets, Nucleic Acids Res., 2006, 34, D535–D539 CrossRef CAS PubMed.
- I. Xenarios, L. Salwinski, X. J. Duan, P. Higney, S. M. Kim and D. Eisenberg, DIP, the Database of interacting proteins: a research tool for studying cellular networks of protein interactions, Nucleic Acids Res., 2002, 30, 303–305 CrossRef CAS PubMed.
- T. S. Keshava Prasad, R. Goel, K. Kandasamy, S. Keerthikumar, S. Kumar, S. Mathivanan, D. Telikicherla, R. Raju, B. Shafreen, A. Venugopal, L. Balakrishnan, A. Marimuthu, S. Banerjee, D. S. Somanathan, A. Sebastian, S. Rani, S. Ray, C. J. Harrys Kishore, S. Kanth, M. Ahmed, M. K. Kashyap, R. Mohmood, Y. L. Ramachandra, V. Krishna, B. A. Rahiman, S. Mohan, P. Ranganathan, S. Ramabadran, R. Chaerkady and A. Pandey, Human Protein Reference Database-2009 update, Nucleic Acids Res., 2009, 37, D767–D772 CrossRef CAS PubMed.
- S. Kerrien, B. Aranda, L. Breuza, A. Bridge, F. Broackes-Carter, C. Chen, M. Duesbury, M. Dumousseau, M. Feuermann, U. Hinz, C. Jandrasits, R. C. Jimenez, J. Khadake, U. Mahadevan, P. Masson, I. Pedruzzi, E. Pfeiffenberger, P. Porras, A. Raghunath, B. Roechert, S. Orchard and H. Hermjakob, The IntAct molecular interaction database in 2012, Nucleic Acids Res., 2012, 40, D841–D846 CrossRef CAS PubMed.
- L. Licata, L. Briganti, D. Peluso, L. Perfetto, M. Iannuccelli, E. Galeota, F. Sacco, A. Palma, A. P. Nardozza, E. Santonico, L. Castagnoli and G. Cesareni, MINT, the molecular interaction database: 2012 update, Nucleic Acids Res., 2012, 40, D857–D861 CrossRef CAS PubMed.
- L. Matthews, G. Gopinath, M. Gillespie, M. Caudy, D. Croft, B. de Bono, P. Garapati, J. Hemish, H. Hermjakob, B. Jassal, A. Kanapin, S. Lewis, S. Mahajan, B. May, E. Schmidt, I. Vastrik, G. Wu, E. Birney, L. Stein and P. D'Eustachio, Reactome knowledgebase of human biological pathways and processes, Nucleic Acids Res., 2009, 37, D619–D622 CrossRef CAS PubMed.
- S. J. Hubbard and J. M. Thornton, NACCESS, Department of Biochemistry and Molecular Biology, University College, London, 1993 Search PubMed.
Footnote |
| † Electronic supplementary information (ESI) available. See DOI: 10.1039/c6mb00231e |
| This journal is © The Royal Society of Chemistry 2016 |