Plasma nanotextured polymeric lab-on-a-chip for highly efficient bacteria capture and lysis†
K.
Tsougeni
a,
G.
Papadakis
b,
M.
Gianneli
b,
A.
Grammoustianou
b,
V.
Constantoudis
a,
B.
Dupuy
d,
P. S.
Petrou
e,
S. E.
Kakabakos
e,
A.
Tserepi
a,
E.
Gizeli
bc and
E.
Gogolides
*a
aInstitute of Nanoscience and Nanotechnology, NCSR Demokritos, Patriarhou Gregoriou and Neapoleos 27 St, 15310 Aghia Paraskevi, Attiki, Greece. E-mail: e.gogolides@inn.demokritos.gr
bInstitute of Molecular Biology & Biotechnology, FO.R.T.H, 100 N. Plastira str, 70013 Heraklion, Greece
cDept. of Biology, Univ. of Crete, Vassilika Vouton, Heraklion, Greece
dLaboratoire Pathogenèse des Bactéries Anaérobies, Institut Pasteur, Paris, France
eInstitute of Nuclear & Radiological Sciences & Technology, Energy & Safety, NCSR Demokritos, Patriarhou Gregoriou and Neapoleos 27 St, 15310, Aghia Paraskevi, Attiki, Greece
First published on 29th October 2015
Abstract
We describe the design, fabrication, and successful demonstration of a sample preparation module comprising bacteria cell capture and thermal lysis on-chip with potential applications in food sample pathogen analysis. Plasma nanotexturing of the polymeric substrate allows increase of the surface area of the chip and the antibody binding capacity. Three different anti-Salmonella antibodies were directly and covalently linked to plasma treated chips without any additional linker chemistry or other treatment. Then, the Ab-modified chips were tested for their capacity to bind bacteria in the concentration range of 102–108 cells per mL; the module exhibited 100% efficiency in Salmonella enterica serovar Typhimurium bacteria capture for cell suspensions below 105 cells per mL (104 cells injected with a 100 μL sample volume) and efficiency higher than 50% for 107 cells per mL. Moreover, thermal lysis achieved on-chip from as low as 10 captured cells was demonstrated and shown to compare well with off-chip lysis. Excellent selectivity (over 1![[thin space (1/6-em)]](https://www.rsc.org/images/entities/char_2009.gif) :
:![[thin space (1/6-em)]](https://www.rsc.org/images/entities/char_2009.gif) 300) was obtained in a sample containing, in addition to S. Typhimurium and E. coli bacteria.
300) was obtained in a sample containing, in addition to S. Typhimurium and E. coli bacteria.
Introduction
Diseases instigated by food-borne pathogens establish a worldwide cumulative public health problem.1 According to the Centers for Disease Control and Prevention (CDC), the number of food-borne diseases has increased by more than five-fold since 1942, while during the last decades their occurrence has continued to increase in many parts of the world.2 As a result, improving the means for the detection of bacterial contamination in food samples is currently of importance for public health safety.3–6Salmonella enterica serovar Typhimurium (S. Typhimurium), a pathogen frequently found in the colonic area of animals such as birds, cows, and rodents, causes diarrhea, illness, and stomach discomfort to humans when consumed through food, with the effects lasting between 2 and 5 days. Due to the high frequency of Salmonella contamination of food samples and its subsequent harmful effects on humans, there is an ongoing need for improved Salmonella-detection methods so that safer food products reach the consumers.7 To comply with current EU regulations, which impose the total absence of Salmonella bacteria in 25 g of a food sample (CE 1441/2007), it is necessary to develop highly sensitive platforms of improved performance to the currently available tools.8 The latter include cell culture and colony counting techniques and molecular diagnostic methods based on the polymerase chain reaction (PCR), fluorescence labeled antibody assay and enzyme-linked immunosorbent assay (ELISA).9,10 Common problems related to the above techniques are that they are laborious and extremely time-consuming, depend on complex and expensive instruments and require 3–4 days for convincing results and 5–7 days for validation.11 It is now generally accepted that sensitive, fast, cost-effective and automated systems are required for pathogen detection in food samples.
During the past years, continuous efforts have been exerted for the development of fully automated systems that can perform DNA extraction, amplification and identification. To our knowledge, there are a few commercially available systems such as Cepheid (http://www.genexpert.com), Idylla™ Biocartis (https://www.biocartis.com/idylla-product-features), and Cobas 6800/8800 System from Roche (http://www.roche.com/media/store/releases/med-cor-2014-09-02.htm); however, they are primarily used in clinical diagnostics and have not reached the food sector yet. In addition, the above technologies are lab-based and require skilled personnel.
Microfluidic lab-on-a-chip (LOC) devices12 offer many advantages for pathogen detection such as small sample volume, portability and shortened assay time.13,14 Specifically, microanalytical devices using micron-sized fluidic channels can achieve rapid and sensitive bacteria detection; this is due to their inherent properties of short diffusion path and high surface-to-volume ratio that can increase antibody-binding capacity and antigen/antibody binding efficiency. A concern in employing microfluidics for food pathogen detection is their difficulty to handle the large volumes obtained following the pre-enrichment step (typically 250 mL); this step is necessary in order to comply with EC regulations and be able to detect the presence of a single bacterium. Typically, this problem is handled by collecting a few hundred microliters of the pre-cultured medium, assuming that there are enough bacteria in the solution for on-chip capture.
Generally, microfluidic chips have been applied to bacteria capture in several formats; these include antibody functionalized magnetic, metallic, and polymeric bead-based chip methods;14–25 dielectrophoresis (pDEP) or insulator-based (iDEP)26 dielectrophoresis chips,27–29 in some cases combined with highly sensitive detection;30 Raman-compatible or surface-enhanced Raman scattering-based chips;31,32 centrifugal microfluidic platforms;33 and immunolabeling with quantum dots in microfluidic chips34 in combination with antibody or other chemistry functionalized microfluidic chips.35–39 In all of the above, a bacteria capture efficiency between 30% and 90% was observed. In addition, after cell capture, either on- or off-chip, cell lysis is needed to achieve DNA extraction and proceed with DNA amplification. Cell lysis, i.e., rupture of the cell membranes and release of the genomic material and other cellular contents, has been demonstrated in microfluidic devices by using a variety of lysis methods, including chemical lysis,40–42 thermal lysis21 and lysis by mechanical forces43,44 or electrical pulses.45–47 Thermal lysis, which involves disrupting the cell membranes by heating cells to near boiling temperatures, is a method that can be incorporated into a microfluidic device as long as the microfluidic material can withstand the temperature required to lyse the cells. The advantage of thermal lysis is that no reagents are required that may interfere with downstream reactions.48,49 However, thermal methods are not applicable for spores of Gram-positive bacteria and can only be performed with vegetative cells (the cell form after spore germination) of Gram-positive bacteria.
In our previous works, we confirmed the ability of plasma nanotextured polymeric surfaces to immobilize significantly higher amounts of proteins compared to flat (untreated) surfaces for the fabrication of highly sensitive microarrays50 and demonstrated direct, stable and significantly increased antibody immobilization on plasma micro-nanotextured PMMA areas compared to untreated ones.51–53 Building on previous works in the field of plasma nanotexturing of open surfaces and microfluidics54,55 as recently reviewed by our team,53 here we present a micro-fabricated, plasma nanotextured cell capture module, precoated directly with anti-Salmonella antibodies without the use of any linker chemistry, for trapping S. Typhimurium cells with excellent efficiency. Based on previous studies (Z. Suo et al.),10 antibodies raised against the O-antigen polysaccharides present on the bacterium cell membrane were selected for bacteria capture due to their high efficiency. Our work has the following unique advantages: a) we use a single step (plasma treatment) to achieve both functionalization and roughness. b) The high surface area exhibits a very high immobilization capacity for antibodies and as a result 100% cell capturing efficiency is achieved. c) The module can be used either for on-chip cell counting using GFP bacteria or for off-chip effluent plating. For green fluorescent bacteria captured on-chip, we propose a new protocol for cell counting at low concentrations for good statistics. d) Thermal lysis is performed on-chip. We demonstrate, using off-chip PCR, a detection limit down to 10 cells. e) In addition, experiments for specificity of S. Typhimurium versus Escherichia coli show excellent selectivity. Finally, total capture and lysis times are less than 30 min and can be further decreased by optimizing the channel geometry and pumping configuration. The proposed bacteria capture and lysis module has all the required performance criteria for application in an integrated lab-on-a-chip and holds promise for its wide applicability to bacterial identification in food, clinical and water samples.
Experimental
Materials and chemicals
PMMA plates with 2 mm thickness were purchased from IRPEN (Spain). Monoclonal antibody, clone No. M9011222, IgG2a, specificity anti-Salmonella core LPS was purchased from MyBioSource. Polyclonal anti LPS antibody-purified rabbit anti-Salmonella group antigen was purchased from AbD Serotec. BacTrace® goat anti-Salmonella CSA-1 antibody was bought from KPL Inc. S. Typhimurium as the aim bacteria strain and Escherichia coli (E. coli) as the interfering bacteria strain have been provided by Institut Pasteur (Paris, France) (see Table S1 in the ESI† regarding the bacterial strains and plasmids used in this study).Apparatus
Plasma processes were performed in a Micromachining Etching Tool (MET) by Alcatel, equipped with a helicon source (at 13.56 MHz) providing RF power up to 2000 W, as described in detail elsewhere.55 A Mega Photopolymer Laminator was used to seal the microfluidic chips. Device characterization was performed by means of a JEOL JSM-7401F FEG SEM or a JEOL JSM-6390LV scanning electron microscope (sample at a tilt). All fluorescence images described herein were acquired with an Axioskop 2 microscope (Zeiss, Germany) and captured using a ProgRes® camera (Jenoptik Optical Systems Inc.) with the ProgRes Capture Pro software (Version 2.8.8). PCR reactions were prepared using the KAPA 2G Fast Hot Start ReadyMix (KapaBiosystems) according to the manufacturer's instructions. Electrophoresis was performed using a Biorad power supply system.Chip fabrication and stabilization process
The process for fabricating the bacteria capture module with standard MEMS technology, namely, lithography directly on the polymer and plasma etching, was described in detail in previous publications.55,56 The chip fabrication process takes approximately 35 min of which 25 min are the etching process at a rate of approximately 1 μm min−1. The chips were etched in a high density helicon-type (ICP) plasma reactor with an alumina dome and electrode (conditions: O2, 1900 W, −100 V, 0.75 Pa, 100 sccm, −20 °C). To avoid ageing of the etched surfaces, chemical stabilization was obtained using a patented fast annealing process, which rapidly ages and stabilizes the plasma treated surfaces without destroying the desired –COOH and C![[double bond, length as m-dash]](https://www.rsc.org/images/entities/char_e001.gif) O functional groups that formed during plasma treatment, as revealed with XPS.51,52,54 Following stabilization, bacteria-capturing anti-LPS antibodies are immobilized on the chip bottom and walls, without using any linking molecules.51 The chip is then sealed with lamination (pressure sensitive lamination films, 3M Advanced Polyolefin Microplate Sealing Tape 9795 from 3M Co.
O functional groups that formed during plasma treatment, as revealed with XPS.51,52,54 Following stabilization, bacteria-capturing anti-LPS antibodies are immobilized on the chip bottom and walls, without using any linking molecules.51 The chip is then sealed with lamination (pressure sensitive lamination films, 3M Advanced Polyolefin Microplate Sealing Tape 9795 from 3M Co.
Scanning electron microscopy preparation for surfaces with cells
For scanning electron microscopy, the samples were fixed in 2% Glutaraldehyde (GDA), 2% Paraformaldehyde (PFA) in 0.08 M sodium cacodylate buffer, pH 7.4, for 45 min at 4 °C, washed in the above-mentioned buffer and dehydrated through a graded series of ethanol (30%–50%–70%–90%–100%) at 4 °C and 100% dry ethanol twice at room temperature. Dehydrated samples were critical point dried (Baltec CPD 030) and mounted on copper stubs prior to sputter coating with 20 nm thickness gold/palladium (Baltec SCD 050).Bacterial cultures
Bacterial strains (S. Typhimurium and E. coli) were grown on lysogeny broth (LB) medium57 for 16 hours at 37 °C. 1 mL of the bacteria cultures was centrifuged in a microfuge at 4000 rpm for 4 min and the pellet was resuspended in 1 mL of PBS solution (10 mM, pH 7.4). This procedure was repeated twice. The optical density at 600 nm (OD600) was estimated using a Novaspec II spectrophotometer (Pharmacia Biotech, UK) in order to get a density of bacteria suspension OD600 = 0.2 corresponding to 3.2 × 10⁸ CFU mL−1. Serial dilutions in PBS (10 mM, pH 7.4) followed to reach the desired bacterial concentrations (down to 102 CFU mL−1). Viable cell number was determined by conventional plate counting on LB agar Petri dishes (measurements carried out in triplicate). A schematic showing the bacterial sample preparation is presented in the ESI† (see Fig. S1).PCR and gel electrophoresis procedures
For the amplification of S. Typhimurium and E. coli gene targets, we used lysed bacteria or genomic DNA corresponding to a particular number of cells. We have applied an amplification protocol consisting of the following steps: a) initial denaturation at 95 °C for 3 min, b) 40 cycles of 95 °C for 10 s, 62.5 °C for 10 s and 72 °C for 10 s and c) final elongation at 72 °C for 1 min. The protocol was followed for the amplification of the purE gene target from S. Typhimurium. For the ttrR gene target from S. Typhimurium and the ompG from E. coli, the annealing temperature was set to 55 °C. The primer pairs used and the corresponding fragment sizes produced by PCR are summarized in Table S2.† Each reaction was supplemented with MgCl2 to a final concentration of 2.5 mM. PCR products were analyzed on a 2% agarose gel stained with GelRed nucleic acid stain (BIOTIUM, USA) and visualized with a UV transilluminator.Bacteria capture module and anti-LPS binding process
The simple experimental set-up used consisted of a syringe pump in order to inject the S. Typhimurium solution inside the chips. A chip holder was fabricated for holding in the bacteria chip module. PEEK capillary tubes (internal diameter 150 μm, external diameter 360 μm) and related connectors to the chip holder were used for inlet and outlet. Fig. 1 illustrates the microchip connected to the syringe pump.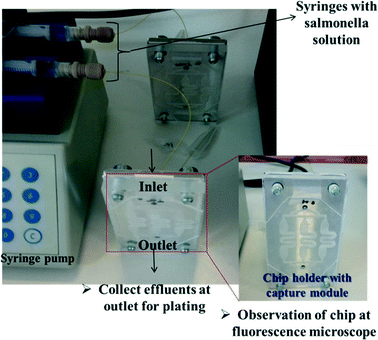 | ||
| Fig. 1 The microchip connected to a syringe pump. The device holder with the capture module is shown in the enlargement. | ||
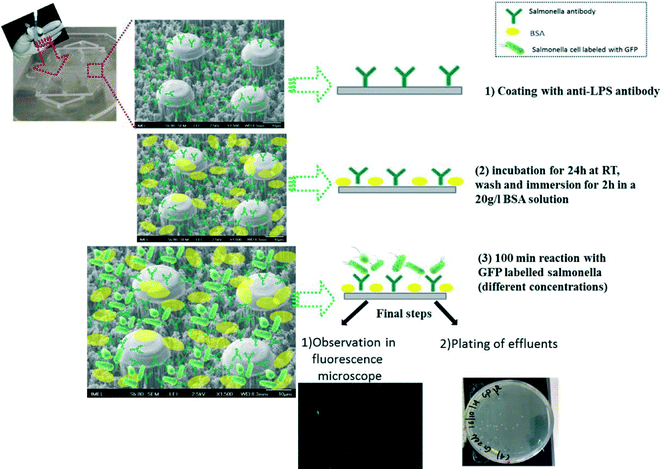
We employed two polyclonal antibodies and one monoclonal antibody (from KPL, AbD Serotec and MyBioSource companies, respectively) targeting at the LPS core of the bacteria, prior to the addition of bacteria. The anti-LPS antibody binding process for direct capturing and detection of GFP-S. Typhimurium or RFP-E. coli on a PMMA chip bottom and walls is shown in Fig. 2 and summarized as follows: (1) coating with anti-LPS antibody by incubation overnight at RT with a concentration of 100 μg mL−1, (2) washing and immersion for 2 h in a 2% BSA solution, (3) flowing of 100 μL of bacteria solution (S. Typhimurium or E. coli, 102–108 cells per mL) through the chip with flow rates ranging from 1 to 8 μL min−1 and successive washing with 10 mM PBS, pH 7.4, in order to remove unbound cells (with flow rate of 5 μL min−1, volume 75 μL). In order to confirm the attachment or not of the bacteria, SEM and fluorescence images after the completion of experiments were obtained. In addition, effluents were collected for conventional plate counting.
Results and discussion
Design and fabrication of bacteria capture module
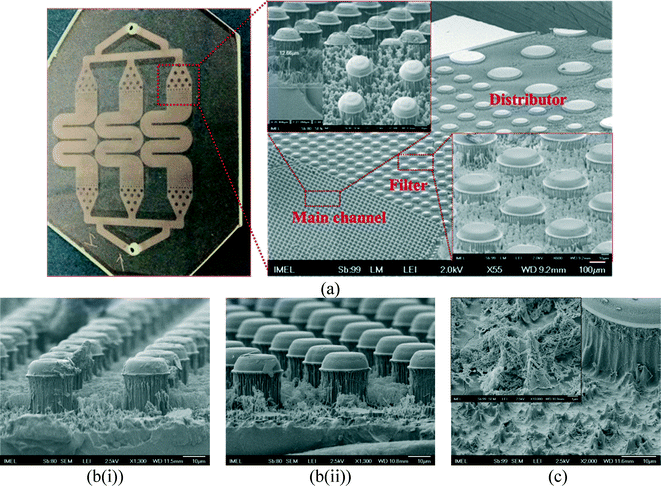
The chip design uses classic concepts of on-chip affinity chromatography and applies oxygen plasma nanotexturing of organic polymers, a technology previously developed by the NCSR Demokritos group,54,58–61 allowing increase of the surface area of the chip and the antibody binding capacity.51,52 The cell capture microfluidic system is composed of 3 parallel microchannels with common input and output ports wherein bacteria solutions and buffers are supplied and flow out, a distributor which uniformly transfers solution from the inlet port flow into the main channel, a filter containing 50 μm posts, and a main channel containing 20 μm posts (distances larger than the bacteria dimensions), which were fabricated by direct lithography and plasma etching on the PMMA substrate, stabilized, and sealed with lamination film (as described above in materials and methods). The microchannels have embedded microposts in order to further increase the surface area, enhance the probability of interaction between the bacteria solution and the nanotextured surface, and promote mixing. The height of the microchannels is 25 μm, the height of roughness is approximately 12 μm before wetting and becomes 5 μm after wetting and drying, and the chip volume is ~20 μL. Table S3 in the ESI† shows the total capture area and the volume of the chip. Briefly, the projected cell capture area (assuming there were no posts or post sidewalls) is 668.6 mm2.The intentionally created roughness by the oxygen plasma etching process resulted in a network of micro/nanotextured, high-surface-area microchannels, as the deterministic analogue of a porous monolith exhibiting a very high surface-to-volume ratio, and created the necessary chemistry for antibody binding.
Fig. 3(a) shows the layout of the chip design with 3 parallel microchannels, an optical image of the chip, and zoom in of the PMMA cell capture module after lithography and O2 plasma etching. SEM photos after lithography are shown in the ESI† (Fig. S2). The use of three parallel channels allows use of higher flow rates by parallelization of the assay and is a compromise between higher flow rates and smaller footprint. SEM images of the PMMA cell capture module are also shown before (Fig. 3(b(i)) and after stabilization (Fig. 3(b(ii)), indicating that no deformation is observed after the thermal stabilization process. Furthermore, notice that the columns of an average height of 12 μm (shown before washing in Fig. 3(a)) are shown again in Fig. 3(c) after consecutive washing and drying steps during the protocol of bacteria capture. These columns appear now as bundled and collapsed due to surface tension, leading to shorter (5 μm) but more robust structures with an interesting surface topography consisting of nanoscale structures on top of robust micrometer-size pyramid-like structures.62
Direct detection of S. Typhimurium-GFP on PMMA cell enrichment microchip: effect of bacterial concentration
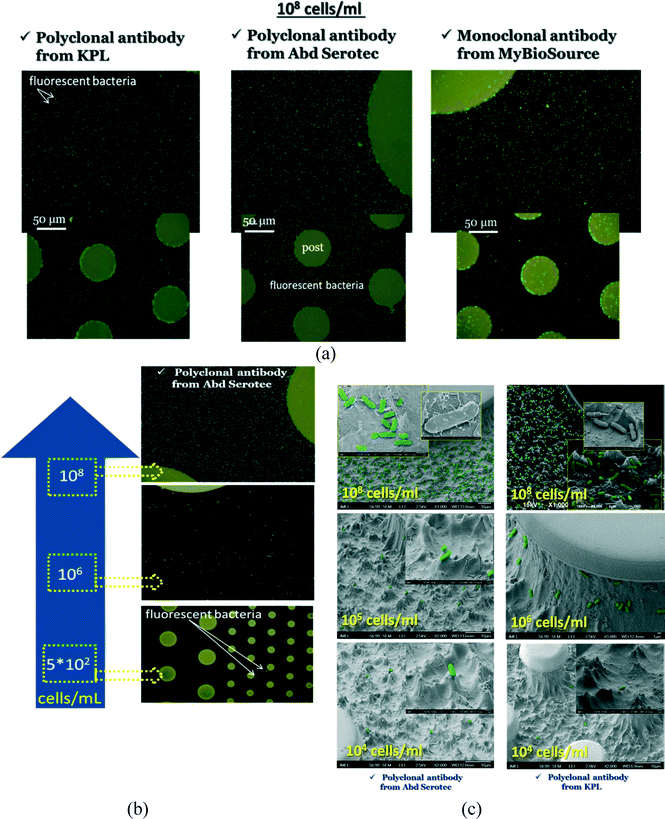
We present here results regarding S. Typhimurium cell capture, employing optimized protocols and three different types of antibodies (two polyclonal antibodies and one monoclonal).In Fig. 4(a), representative fluorescence images of capturing and detection of S. Typhimurium-GFP are shown after immobilization of 3 different anti-LPS antibodies at a concentration of 108 cells per mL. Also in Fig. 4(b) fluorescence images after immobilization of polyclonal antibody from AbD Serotec are shown for different concentrations of bacteria varying from 102 to 108 cells per mL. In addition, in Fig. 4(c) representative tilted SEM images of captured S. Typhimurium-GFP are shown using for examples three bacterial concentrations of 108, 105 and 104 cells per mL (107, 104 and 103 injected cells, or 15![[thin space (1/6-em)]](https://www.rsc.org/images/entities/char_2009.gif) 000, 15, and 1.5 cells per mm2 of open chip, respectively) and for two polyclonal antibodies, the polyclonal antibody from AbD Serotec and KPL. To guide the eye, the bacteria were stained using the Photoshop software. The SEM images verified that bacteria attached to the chip bottom and walls.
000, 15, and 1.5 cells per mm2 of open chip, respectively) and for two polyclonal antibodies, the polyclonal antibody from AbD Serotec and KPL. To guide the eye, the bacteria were stained using the Photoshop software. The SEM images verified that bacteria attached to the chip bottom and walls.
Protocol and statistics for fluorescent cell counting and efficiency determination
Because of the vastly varying concentrations used in these experiments, cell counting statistics are very different in the range from high to low cell concentrations. Therefore, accurate determination of bacteria depends strongly on the number of photographs taken and analyzed. The statistical problem is posed as follows: how many photographs should one take from a chip in order to determine the captured cell number with a certain (desirably small) relative error? Obviously the number of photographs will depend on the concentration used. Assuming that the positions of bacteria on-chip are uncorrelated, and thus using Poisson spatial statistics (complete spatial randomness), we propose eqn (1) for the number of images to be taken: | (1) |
In Fig. 5 the number of images is shown versus the initial bacterial concentration for two relative errors, 10% and 90%. For a relative error of 10%, the number of images increases dramatically as the concentration decreases. It is obvious that for concentrations >106 cells per mL, one image is enough for correct statistics. On the other hand, for concentrations of 103 cells per mL and below, more than 100 images should be collected to reduce the relative error down to 10%, which is difficult when using conventional non-automated fluorescence microscopes without a motorized XY scanning stage. Therefore, fluorescence microscopy is not recommended for small concentrations, e.g. below 103 cells per mL. Instead, plating of cell effluents is recommended for such low concentrations.
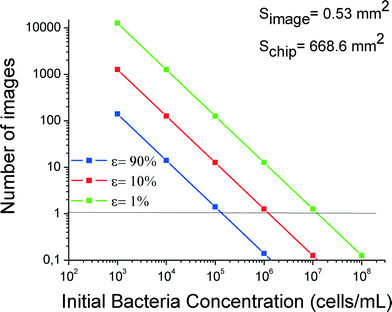 | ||
| Fig. 5 Required number of photographs for cell counting to reduce the relative error to values of 1%, 10% or 90% (three curves) versus cell concentration. | ||
In our case after this study for practical reasons we took 69 photos for the whole 3-branched module for each concentration.
Direct counting of fluorescence images and plating of effluents
Counting of captured cells was performed using the open source software ImageJ (http://imagej.nih.gov/ij/). The image area was measured and converted according to the scale bar in mm2. (We made sure that the projected area of the posts was subtracted from the area of the photograph.) Therefore, cell capture density is determined as the number of cells per square millimeter (cells per mm2) of available projected plasma treated area. By multiplying this with the total area of the module which includes the sidewall area of the posts (AreaALL CHIP = 998 mm2; see the ESI,† Table S3), the total number of cells in the chip was estimated. The accuracy for small concentrations (<104 mL−1) is poor. In Table S4 the results are presented for all three antibodies (shown in the ESI†), and are plotted in Fig. 6(a) where the capture efficiency calculated from fluorescence images is shown versus the initial (injected) bacterial concentration. The capture was quantified per area of the chip using the following eqn (2). | (2) |
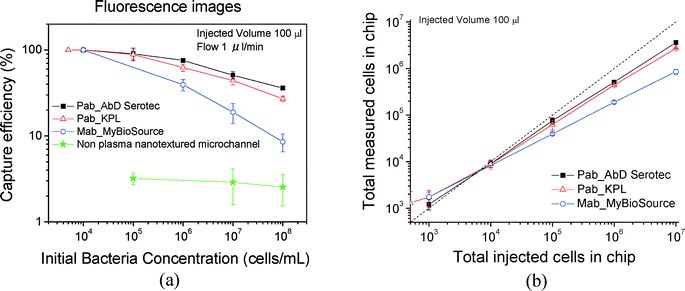 | ||
| Fig. 6 (a) Capture efficiency calculated from fluorescent cell counting for three antibodies for plasma nanotextured capture modules. A non-plasma treated microchannel (green line) is also shown for comparison purposes. (b) Total measured cells in chip versus total injected cells in chip. We note that below 1000 cells per mL, we estimate more cells on-chip compared to those injected. This is due to the poor statistics in this region. Although we collected 69 images, one would need 2–10 times more images for better statistics; see Fig. 5. The errors correspond to standard errors based on three repetitions. | ||
Based on the data, the efficiency increases by decreasing the concentration and is 90% for 105 cells per mL and approximately 100% for concentrations of 104 cells per mL and below (i.e. total 1000 injected cells) although the error bar here is higher based on only 69 analyzed images. We note, however, that the capture efficiencies calculated from fluorescence images are slightly underestimated due to an underestimation of the cell number, which we think is due to two reasons related to the posts: a) bacteria captured on the post sidewall are not fully distinguishable by the software, since bacteria at the bottom of the sidewall may be shadowed by those on the upper part of the sidewall; b) in addition the autofluorescence of the photoresist on top of the posts makes cell counting in the post periphery more difficult. The high efficiencies are confirmed by cell plating; see below. Furthermore in Fig. 6(a), the capture efficiency is shown for non-plasma nanotextured microchannels for three concentrations: 108, 107, and 105 cells per mL. Based on the data, the capture efficiency for the non-plasma nanotextured chips was ~3% at the concentration of 105 cells per mL and was maintained at a similar level irrespective of the applied initial cell concentration ranging from 108 to 105 cells per mL. In Fig. 6(b) the numbers of the total measured cells on-chip are presented versus the total injected cells in chip. As can be observed, a deviation from the diagonal line occurred with increasing bacterial concentration. The polyclonal antibody from AbD Serotec gave the best results and was selected for subsequent experiments. In addition, in order to determine the nonspecific binding we immobilized mouse gamma globulin (100 μg mL−1) which does not possess any antibody functionality, instead of using the specific antibodies that target at the LPS core of the bacteria. The capture efficiency was calculated to be equal to 1.3% for a concentration of 107 cells per mL, nearly 50× smaller than the respective capture efficiency obtained with AbD Serotec antibody.
To verify the results obtained after the observation on the fluorescence microscope, we performed plating of the chip effluents on a medium that supports the growth of the bacteria and counted the bacteria that were not captured inside the microchip. Plating is the ideal method for enumerating microorganisms in a given population because it only identifies the living organisms in that population. The upper limit of accuracy for counting colonies is 300 colonies per plate (determined experimentally and statistically). The method is obviously more accurate at low concentrations of cells compared to the fluorescence measurements and confirms the results above.
Bacteria solutions or bacteria chip effluents were used after serial dilutions (1/10 or 1/100 depending on the initial concentration) for plating and counting of live bacteria in order to determine the number of colony forming units (CFUs). The number of CFUs was divided by the product of the dilution factor and the volume of the plated diluted suspension to determine the number of bacteria per mL that were present in the original solution, according to eqn (3):
| Colony count × dilution factor = CFU/ml of original culture | (3) |
In Fig. 7 the capture efficiency calculated after plating of effluents is shown versus the initial bacterial concentration. The capture efficiency was quantified per unit volume of the microfluidic device. If we assume the inlet and outlet concentration of bacteria as Cin and Cout (in CFU mL−1), respectively, the capture efficiency is derived as
 | (4) |
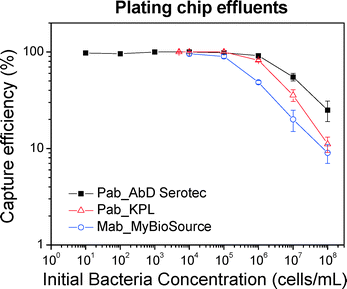 | ||
| Fig. 7 Capture efficiency calculated from plating off-chip effluents for three antibodies. Note that the agreement of plating results from those of on-chip fluorescent cell counting shown in Fig. 6. The errors correspond to standard errors based on three repetitions. | ||
Based on the data, the efficiency increases by decreasing the concentration and is approximately 100% for a concentration of 105 cells per mL and below (i.e. 104 injected cells or 15 captured cells per mm2 of chip empty area), thus confirming the fluorescent cell counting results shown above. In addition, we note that the chip can capture with an efficiency higher than 80% for concentrations of 106 cells per mL, while the efficiency is at 50% for concentrations of 107 cells per mL (i.e. 106 injected cells, or 1500 cells per mm2 of chip empty area).
Thermal lysis on-chip followed by conventional off-chip PCR and agarose gel electrophoresis of PCR products: effect of bacterial concentration
Thermal lysis was performed with the chip on a hotplate. In the future, microheaters will be attached to the chip to allow in situ cell lysis and integration with other modules downstream. A thermocouple and a thermometer were used to control the temperature inside the microchannel. The experimental setup that was used for bacteria thermal lysis on-chip is shown in the ESI† (Fig. S3(a)), together with snapshots during heating of the chip (Fig. S3(b)†), showing that the chip was leak-proof after flushing it. Lysis was performed at ~93–95 °C for 10 min and effluents were collected for PCR and gel electrophoresis after washing with PBS solution.To analyze the effluents after on-chip thermal lysis, we implemented conventional off-chip PCR and agarose gel electrophoresis of PCR products. 120–190 μL were collected from the chip, and 1 μL of the collected effluent was used for off-chip PCR (see the ESI,† Fig. S4)
As a control experiment, we performed off-chip lysis of different initial cell numbers, as shown in Fig. 8(a). Lanes 1–4 correspond to different cell numbers, i.e. 1000, 500, 100, and 50, respectively. The real experiment for on-chip lysis with different cell numbers down to 10 cells is presented in Fig. 8(b and c). It is evident that the thermal lysis on-chip was successful and compares well with the off-chip control experiment.
Finally, experiments with a null chip containing mouse gamma globulin rather than AbD Serotec anti-LPS antibody (see the ESI,† Fig. S5) confirmed that cell capture was antibody specific.
Effect of injection flow rate on module efficiency
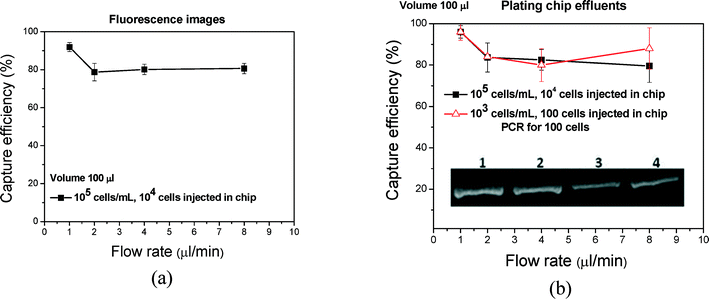
Analysis time can be reduced by increasing the flow rate through the chip. Indeed, we can increase the flow rate from 1 to 8 μL min−1 or higher in order to reduce the flow-through time from 100 min to 12.5 min or less. One must, however, demonstrate that such an increase in flow rate does not result in a significant efficiency drop. In Fig. 9(a and b), the capture efficiency that was calculated from fluorescence images and after plating is shown versus the flow rate. Based on the plating data (fluorescence data are similar but slightly underestimated), the efficiency is approximately 100% for a flow rate of 1 μl min−1 and concentration of 105 cells per mL and does not decrease significantly (~80%, 105 cells per mL) by increasing the flow rate up to 8 μl min−1. To confirm the results regarding the effect of flow rate, we performed cell capture for 100 cells at different flow rates through on-chip lysis and off-chip PCR. The photograph of the gel is shown as an inset in Fig. 9(b). The capture and lysis was successful and efficient even at increased flow rates without remarkable changes in the PCR signal, allowing completion of capturing and lysis in less than 30 min.Specificity of S. Typhimurium versus E. coli on PMMA cell capture microchip
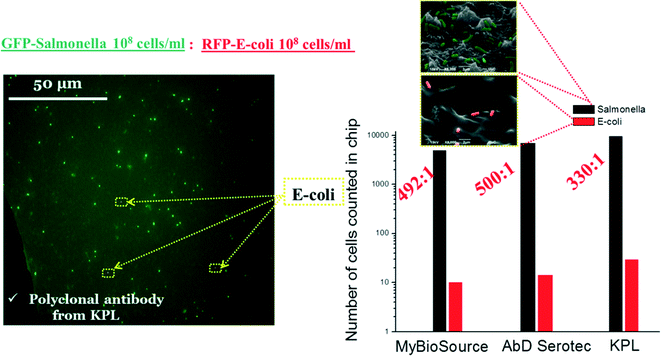
Furthermore, we performed experiments in order to determine the specificity of S. Typhimurium versus E. coli on PMMA cell capture microchips precoated with 2 polyclonal antibodies and 1 monoclonal antibody (from KPL, AbD Serotec and MyBioSource companies, one at a time) (see Table S5 in the ESI†). We used a 1![[thin space (1/6-em)]](https://www.rsc.org/images/entities/char_2009.gif) :
:![[thin space (1/6-em)]](https://www.rsc.org/images/entities/char_2009.gif) 1 mixture of bacteria with a concentration 108 cells per mL (S. Typhimurium-GFP (green) and E. coli-RFP (red)). As shown in Fig. 10, using the cell capture module, we have been able to capture specifically S. Typhimurium in a sample containing interfering bacteria with excellent selectivity (over 300
1 mixture of bacteria with a concentration 108 cells per mL (S. Typhimurium-GFP (green) and E. coli-RFP (red)). As shown in Fig. 10, using the cell capture module, we have been able to capture specifically S. Typhimurium in a sample containing interfering bacteria with excellent selectivity (over 300![[thin space (1/6-em)]](https://www.rsc.org/images/entities/char_2009.gif) :
:![[thin space (1/6-em)]](https://www.rsc.org/images/entities/char_2009.gif) 1 in all antibodies used) of S. Typhimurium versus E. coli for a 1
1 in all antibodies used) of S. Typhimurium versus E. coli for a 1![[thin space (1/6-em)]](https://www.rsc.org/images/entities/char_2009.gif) :
:![[thin space (1/6-em)]](https://www.rsc.org/images/entities/char_2009.gif) 1 mixture (108 cells per mL).
1 mixture (108 cells per mL).
Moreover, to test the selectivity by means of a more complex mixture of interfering bacteria, we selected a mixture of bacteria with a 1![[thin space (1/6-em)]](https://www.rsc.org/images/entities/char_2009.gif) :
:![[thin space (1/6-em)]](https://www.rsc.org/images/entities/char_2009.gif) 1000 ratio by decreasing the concentration of S. Typhimurium down to 103 cells per mL while keeping the concentration of E. coli at ~106 cells per mL. For this purpose, we implemented on-chip thermal lysis and off-chip PCR of the effluent using specific S. Typhimurium primers and compared it with a control off-chip experiment (Fig. 11(a and b)).
1000 ratio by decreasing the concentration of S. Typhimurium down to 103 cells per mL while keeping the concentration of E. coli at ~106 cells per mL. For this purpose, we implemented on-chip thermal lysis and off-chip PCR of the effluent using specific S. Typhimurium primers and compared it with a control off-chip experiment (Fig. 11(a and b)).
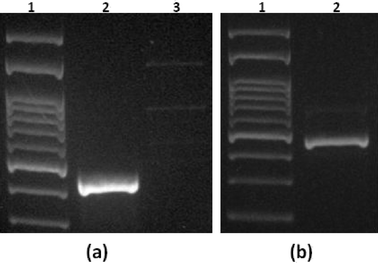
In the control experiment (shown in Fig. 11(a)), off-chip PCR of E. coli solution with a concentration of 107 cells per mL and different primers was accomplished: 1) primers specific for E. coli and 2) primers specific for S. Typhimurium. As can be seen from Fig. 11(a), the reaction does not occur by using primers nonspecific for E. coli. The real experiment is shown in Fig. 11(b), which indicates that a clear band witnesses the capture of S. Typhimurium on-chip and the amplification only of the captured Salmonella DNA with off-chip PCR using S. Typhimurium specific primers. These experiments confirm the excellent selectivity that was obtained after on-chip lysis in the presence of E. coli bacteria at a high concentration.
Conclusions and outlook
A microfluidic chip for cell capture and lysis was designed and fabricated on PMMA. The plasma nanotextured PMMA chip was used for the direct binding of both monoclonal and polyclonal anti-LPS core Salmonella antibodies followed by the capturing of various bacterial concentrations ranging from 102 to 108 cells per mL and injected volumes of 100 μL (this corresponds to 10–107 total number of cells). A standard protocol for taking fluorescence images from the entire chip for captured cell counting was developed and used for obtaining a statistically significant number of photographs. Plating of the effluents of the chip was also performed for a complete characterization of the capture efficiency. The capture efficiency and selectivity of S. Typhimurium versus E. coli were also tested and shown to be in the order of 80–100% for concentrations of <106 cells per mL or 105 injected cells; this was observed even at flow rates as high as 8 μL min−1. The high efficiency corresponds to the capturing of 150 cells per mm2 of the chip with a probability of >80%, or capturing 1500 cells per mm2 of the chip with a probability larger than 50%. On-chip thermal lysis was successfully performed followed by successful off-chip DNA amplification down to 10 cells. Total capture and lysis was completed in less than 30 min. In addition, excellent selectivity (over 300![[thin space (1/6-em)]](https://www.rsc.org/images/entities/char_2009.gif) :
:![[thin space (1/6-em)]](https://www.rsc.org/images/entities/char_2009.gif) 1 in all antibodies used) of S. Typhimurium versus E. coli for a 1
1 in all antibodies used) of S. Typhimurium versus E. coli for a 1![[thin space (1/6-em)]](https://www.rsc.org/images/entities/char_2009.gif) :
:![[thin space (1/6-em)]](https://www.rsc.org/images/entities/char_2009.gif) 1 mixture (108 cells per mL) as well as for a 1
1 mixture (108 cells per mL) as well as for a 1![[thin space (1/6-em)]](https://www.rsc.org/images/entities/char_2009.gif) :
:![[thin space (1/6-em)]](https://www.rsc.org/images/entities/char_2009.gif) 1000 mixture of interfering bacteria was accomplished.
1000 mixture of interfering bacteria was accomplished.
The successful demonstration of the current chip for bacteria capture and lysis opens the potential for developing an integrated platform for food-borne pathogen detection in combination with a DNA amplification and detection module. The development of such a system is anticipated to result in a portable and reliable platform for performing bacteria on-chip analysis in less than a few hours.
Acknowledgements
The “Love Wave Fully Integrated Lab-on-chip Platform for Food Pathogen Detection” – LOVE FOOD programme (Contract No. 317742) is acknowledged for partial funding. We thank Dr. Alexandra Siakouli (Dept. of Biology, University of Crete) for preparing the SEM images.References
- B. Report of the World Health Organization (WHO) consultation of emerging foodborne deseases, 20–24 March 1995 Search PubMed.
- D. G. Newell, M. Koopmans, L. Verhoef, E. Duizer, A. Aidara-Kane, H. Sprong, M. Opsteegh, M. Langelaar, J. Threfall, F. Scheutz, J. van der Giessen and H. Kruse, Int. J. Food Microbiol., 2010, 139, S3–S15 CrossRef PubMed.
- S. T. Pathirana, J. Barbaree, B. A. Chin, M. G. Hartell, W. C. Neely and V. Vodyanoy, Biosens. Bioelectron., 2000, 15, 135–141 CrossRef CAS PubMed.
- Y. Y. Wong, S. P. Ng, M. H. Ng, S. H. Si, S. Z. Yao and Y. S. Fung, Biosens. Bioelectron., 2002, 17, 676–684 CrossRef CAS PubMed.
- M. Magliulo, P. Simoni, M. Guardigli, E. Michelini, M. Luciani, R. Lelli and A. Roda, J. Agric. Food Chem., 2007, 55, 4933–4939 CrossRef CAS PubMed.
- M. Zourob, S. Mohr, B. J. T. Brown, P. R. Fielden, M. B. McDonnell and N. J. Goddard, Lab Chip, 2005, 5, 1360–1365 RSC.
- S. H. Park, M. Aydin, A. Khatiwara, M. C. Dolan, D. F. Gilmore, J. L. Bouldin, S. Ahn and S. C. Ricke, Food Microbiol., 2014, 38, 250–262 CrossRef CAS PubMed.
- P. Yager, T. Edwards, E. Fu, K. Helton, K. Nelson, M. R. Tam and B. H. Weigl, Nature, 2006, 442, 412 CrossRef CAS PubMed.
- Z. Y. Suo, R. Avci, X. H. Yang and D. W. Pascual, Langmuir, 2008, 24, 4161–4167 CrossRef CAS PubMed.
- Z. Y. Suo, X. H. Yang, R. Avci, M. Deliorman, P. Rugheimer, D. W. Pascual and Y. Idzerda, Anal. Chem., 2009, 81, 7571–7578 CrossRef CAS PubMed.
- D. J. Squirrell, R. L. Price and M. J. Murphy, Anal. Chim. Acta, 2002, 457, 109 CrossRef CAS.
- M. L. Kovarik, D. M. Ornoff, A. T. Melvin, N. C. Dobes, Y. L. Wang, A. J. Dickinson, P. C. Gach, P. K. Shah and N. L. Allbritton, Anal. Chem., 2013, 85, 451–472 CrossRef CAS PubMed.
- B. Weigl, G. Domingo, P. LaBarre and J. Gerlach, Lab Chip, 2008, 8, 1999–2014 RSC.
- A. M. Foudeh, T. F. Didar, T. Veresa and M. Tabrizian, Lab Chip, 2012, 12, 3249–3266 RSC.
- N. Y. Lee, Y. Yang, Y. S. Kim and S. Park, Bull. Korean Chem. Soc., 2006, 27, 479–483 CrossRef CAS.
- R. H. Liu, J. N. Yang, R. Lenigk, J. Bonanno and P. Grodzinski, Anal. Chem., 2004, 76, 1824–1831 CrossRef CAS PubMed.
- E. T. Lagally, J. R. Scherer, R. G. Blazej, N. M. Toriello, B. A. Diep, M. Ramchandani, G. F. Sensabaugh, L. W. Riley and R. A. Mathies, Anal. Chem., 2004, 76, 3162–3170 CrossRef CAS PubMed.
- E. T. Lagally, S. H. Lee and H. T. Soh, Lab Chip, 2005, 5, 1053–1058 RSC.
- B. H. Lapizco-Encinas, B. A. Simmons, E. B. Cummings and Y. Fintschenko, Electrophoresis, 2004, 25, 1695–1704 CrossRef CAS PubMed.
- C. G. Koh, W. Tan, M. Q. Zhao, A. J. Ricco and Z. H. Fan, Anal. Chem., 2003, 75, 6379–6379 CrossRef CAS.
- L. C. Waters, S. C. Jacobson, N. Kroutchinina, J. Khandurina, R. S. Foote and J. M. Ramsey, Anal. Chem., 1998, 70, 158–162 CrossRef CAS PubMed.
- Z. Chen, M. G. Mauk, J. Wang, W. R. Abrams, P. L. A. M. Corstjens, R. S. Niedbala, D. Malamud and H. H. Bau, Ann. N. Y. Acad. Sci., 2007, 1098, 429–436 CrossRef CAS PubMed.
- Z. Shan, Q. Wu, X. Wang, Z. Zhou, K. D. Oakes, X. Zhang, Q. Huang and W. Yang, Anal. Biochem., 2010, 398, 120–122 CrossRef CAS PubMed.
- J. Qiu, Y. Zhou, H. Chen and J.-M. Lin, Talanta, 2009, 79, 787–795 CrossRef CAS PubMed.
- J. D. Brewster, J. Microbiol. Methods, 2003, 55, 287–293 CrossRef CAS PubMed.
- P. Zellner, T. Shake, A. Sahari, B. Behkam and M. Agah, Anal. Bioanal. Chem., 2013, 405, 6657–6666 CrossRef CAS PubMed.
- X. He, C. Hu, Q. Guo, K. Wang, Y. Li and J. Shangguan, Biosens. Bioelectron., 2013, 42, 460–466 CrossRef CAS PubMed.
- A. K. Balasubramanian, K. A. Soni, A. Beskok and S. D. Pillai, Lab Chip, 2007, 7, 1315–1321 RSC.
- A. K. Balasubramanian, A. Beskok and S. D. Pillai, J. Micromech. Microeng., 2007, 17, 1467–1478 CrossRef CAS.
- F. R. Madiyar, S. Bhana, L. Z. Swisher, C. T. Culbertson, X. Huang and J. Li, Nanoscale, 2015, 7, 3726–3736 RSC.
- S. Pahlow, S. Kloß, V. Blättel, K. Kirsch, U. Hübner, D. Cialla, P. Rösch, K. Weber and J. Popp, ChemPhysChem, 2013, 14, 3600–3605 CrossRef CAS PubMed.
- H. Wang, Y. Zhou, X. Jiang, B. Sun, Y. Zhu, H. Wang, Y. Su and Y. He, Angew. Chem., Int. Ed., 2015, 54, 5132–5136 CrossRef CAS PubMed.
- U.-C. Schröder, F. Bokeloh, M. O'Sullivan, U. Glaser, K. Wolf, W. Pfister, J. Popp, J. Ducrée and U. Neugebauer, Biomicrofluidics, 2015, 9, 044118 CrossRef PubMed.
- R. Wang, Y. Ni, Y. Xu, Y. Jiang, C. Dong and N. Chuan, Anal. Chim. Acta, 2015, 853, 710–717 CrossRef CAS PubMed.
- Kyu-Youn Hwang, Sung-Young Jeong, Young-Rok Kim, Kak Namkoong, H.-K. Lima, W.-S. Chung, J.-H. Kim and N. Huh, Sens. Actuators, B, 2011, 154, 46–51 CrossRef CAS.
- S. Q. Wang, F. Inci, T. L. Chaunzwa, A. Ramanujam, A. Vasudevan, S. Subramanian, A. C. F. Ip, B. Sridharan, U. A. Gurkan and U. Demirci, Int. J. Nanomed., 2012, 7, 2591–2600 CAS.
- Udara Dharmasiri, Małgorzata A. Witek, Andre A. Adams, John K. Osiri, M. L. Hupert, T. S. Bianchi, D. L. Roelke and S. A. Soper, Anal. Chem., 2010, 82, 2844–2849 CrossRef CAS PubMed.
- U. Dharmasiri, S. Balamurugan, A. A. Adams, P. I. Okagbare, A. Obubuafo and S. A. Soper, Electrophoresis, 2009, 30, 3289–3300 CrossRef CAS PubMed.
- Y. Li, X. Yan, X. Feng, J. Wang, W. Du, Y. Wang, P. Chen, L. Xiong and B.-F. Liu, Anal. Chem., 2014, 86, 10653–10659 CrossRef CAS PubMed.
- D. Di Carlo, C. Ionescu-Zanetti, Y. Zhang, P. Hung and L. P. Lee, Lab Chip, 2005, 5, 171–178 RSC.
- D. Irimia, R. G. Tompkins and M. Toner, Anal. Chem., 2004, 76, 6137–6143 CrossRef CAS PubMed.
- M. Mahalanabis, H. Al-Muayad, M. D. Kulinski, D. Altman and C. M. Klapperich, Lab Chip, 2009, 9, 2811–2817 RSC.
- P. Belgrader, D. Hansford, G. T. A. Kovacs, K. Venkateswaran, R. Mariella, F. Milanovich, S. Nasarabadi, M. Okuzumi, F. Pourahmadi and M. A. Northrup, Anal. Chem., 1999, 71, 4232–4236 CrossRef CAS PubMed.
- M. T. Taylor, P. Belgrader, B. J. Furman, F. Pourahmadi, G. T. A. Kovacs and M. A. Northrup, Anal. Chem., 2001, 73, 492–496 CrossRef CAS PubMed.
- S.-W. Lee and Y.-C. Tai, Sens. Actuators, A, 1999, 73, 74–79 CrossRef CAS.
- J. T. Nevill, R. Cooper, M. Dueck, D. N. Breslauer and L. P. Lee, Lab Chip, 2007, 7, 1689–1695 RSC.
- H.-Y. Wang, A. K. Bhunia and C. Lu, Biosens. Bioelectron., 2006, 22, 582–588 CrossRef CAS PubMed.
- A. Abolmaaty, M. G. El-Shemy, M. F. Khallaf and R. E. Levin, J. Microbiol. Methods, 1998, 34, 133–141 CrossRef CAS.
- P. Belgrader, W. Benett, D. Hadley, J. Richards, P. Stratton, R. Mariella and F. Milanovich, Science, 1999, 284, 449–450 CrossRef CAS PubMed.
- K. Tsougeni, P. S. Petrou, A. Tserepi, S. E. Kakabakos and E. Gogolides, Langmuir, 2010, 26, 13883–13891 CrossRef CAS PubMed.
- K. Tsougeni, P. S. Petrou, K. Awsiuk, M. M. Marzec, N. Ioannidis, V. Petrouleas, A. Tserepi, S. E. Kakabakos and E. Gogolides, ACS Applied materials and interfaces (accepted for publication), 2015 Search PubMed.
- K. Tsougeni, P. S. Petrou, A. Tserepi, S. E. Kakabakos and E. Gogolides, Method to fabricate chemically-stable plasma-etched substrates for direct covalent biomolecule immobilization, Greek patent application number: 20140100319 (June 2014), European patent EPO number: 15386014-3 (May 2015).
- E. Gogolides, K. Ellinas and A. Tserepi, Microelectron. Eng., 2015, 132, 135–155 CrossRef CAS.
- K. Tsougeni, N. Vourdas, Ch. Cardinaud, A. Tserepi and E. Gogolides, Langmuir, 2009, 25, 11748–11759 CrossRef CAS PubMed.
- K. Tsougeni, D. Papageorgiou, A. Tserepi and E. Gogolides, Lab Chip, 2010, 10, 462–469 RSC.
- K. Tsougeni, A. Tserepi and E. Gogolides, Microelectron. Eng., 2007, 84, 1104–1108 CrossRef CAS.
- G. Bertani, J. Bacteriol., 2004, 186, 595–600 CrossRef CAS PubMed.
- N. Vourdas, M. E. Vlachopoulou, A. Tserepi and E. Gogolides, Internet J. Nanotechnol., 2009, 6, 1/2 Search PubMed.
- N. Vourdas, A. Tserepi and E. Gogolides, Nanotechnology, 2007, 18, 125304 CrossRef.
- A. Tserepi, E. Gogolides, K. Misiakos, M. E. Vlachopoulou and N. Vourdas, Method for the fabrication of high surface area ratio and high aspect ratio surfaces on substrates, Greek patent application number: 20050100473, PCT application number: PCT/GR2006/000011, Publication number: WO2007031799.
- K. Tsougeni, A. Bourkoula, P. Petrou, A. Tserepi, S. E. Kakabakos and E. Gogolides, Microelectron. Eng., 2014, 124, 47–52 CrossRef CAS.
- D. P. Papageorgiou, K. Tsougeni, A. Tserepi and E. Gogolides, Microfluid. Nanofluid., 2013, 14, 247–255 CrossRef CAS.
Footnote |
| † Electronic supplementary information (ESI) available. See DOI: 10.1039/c5lc01217a |
| This journal is © The Royal Society of Chemistry 2016 |

