
3-D individual cell based computational modeling of tumor cell–macrophage paracrine signaling mediated by EGF and CSF-1 gradients†
Hildur
Knutsdottir
ab,
John S.
Condeelis
c and
Eirikur
Palsson
*b
aMathematics Department/Institute of Applied Mathematics, University of British Columbia, Vancouver, BC V6 T 1Z2, Canada
bDepartment of Biology, Simon Fraser University, 8888 University Dr, Burnaby, BC V5A 1S6, Canada. E-mail: epalsson@sfu.ca; Fax: +1-778-782-3496; Tel: +1-778-782-4808
cDepartment of Anatomy and Structural Biology, Albert Einstein College of Medicine, Bronx, NY, USA
First published on 7th December 2015
Abstract
High density of macrophages in mammary tumors has been associated with a higher risk of metastasis and thus increased mortality in women. The EGF/CSF-1 paracrine signaling increases the number of invasive tumor cells by both recruiting tumor cells further away and manipulating the macrophages' innate ability to open up a passage into blood vessels thus promoting intravasation and finally metastasis. A 3-D individual-cell-based model is introduced, to better understand the tumor cell–macrophage interactions, and to explore how changing parameters of the paracrine signaling system affects the number of invasive tumor cells. The simulation data and videos of the cell movements correlated well with findings from both in vitro and in vivo experimental results. The model demonstrated how paracrine signaling is necessary to achieve co-migration of tumor cells and macrophages towards a specific signaling source. We showed how the paracrine signaling enhances the number of both invasive tumor cells and macrophages. The simulations revealed that for the in vitro experiments the imposed no-flux boundary condition might be affecting the results, and that changing the setup might lead to different experimental findings. In our simulations, the 3![[thin space (1/6-em)]](https://www.rsc.org/images/entities/char_2009.gif) :1 tumor cell/macrophage ratio, observed in vivo, was robust for many parameters but sensitive to EGF signal strength and fraction of macrophages in the tumor. The model can be used to identify new agents for targeted therapy and we suggest that a successful strategy to prevent or limit invasion of tumor cells would be to block the tumor cell–macrophage paracrine signaling. This can be achieved by either blocking the EGF or CSF-1 receptors or supressing the EGF or CSF-1 signal.
:1 tumor cell/macrophage ratio, observed in vivo, was robust for many parameters but sensitive to EGF signal strength and fraction of macrophages in the tumor. The model can be used to identify new agents for targeted therapy and we suggest that a successful strategy to prevent or limit invasion of tumor cells would be to block the tumor cell–macrophage paracrine signaling. This can be achieved by either blocking the EGF or CSF-1 receptors or supressing the EGF or CSF-1 signal.
Insight, innovation, integrationA key factor in mammary tumor cell invasion is the EGF/CSF-1 paracrine signaling system between tumor cells and macrophages. We present a novel cell-based 3D model to simulate how parameters of the paracrine system influence the movements and invasion of tumor cells and macrophages. This approach is well suited to better understand how paracrine signaling enhances tumor cell invasion and discover molecular targets that disrupt this signaling. We discovered how several key components of the signaling system affected cell migrations. We showed that the presence of macrophages enhances the tumor cell migration towards the blood vessels and explained the observed 3:1 tumor cells to macrophage ratio. Finally we suggest new experiments and how to best suppress cancer cell invasion.
|
Introduction
The primary cause of death in breast cancer patients is attributed to metastatic disease. Before cancer cells can spread to distant organs they must first migrate into a blood vessel. Imaging in mouse tumors has revealed that tumor cells migrate alongside macrophages in an alternating pattern towards the blood vessels.1–6 Once tumor cells get into the blood stream they can extravasate at distant sites in other organs or tissues and form secondary tumors. Hence, limiting or ideally preventing tumor cell motility is a crucial part of cancer treatments. In this paper, we introduce a computational model to explore how mammary tumor cells recruit macrophages to the tumor site and take advantage of their ability to increase cell motility. We also explore how the presence of macrophages enhances overall cell migration towards blood vessels.Macrophages comprise about 5% of all white blood cells and they are involved in many different stages of tumor development: inflammation, matrix remodeling, angiogenesis, metastasis, intravasation (crossing of cells into blood vessels) and invasion.2,3,7–10 Macrophages can constitute up to 50% of the cell mass in breast tumors.7 The highest concentration of macrophages is at the tumor margin and the concentration decreases with increasing distance from the margin.2 Macrophages are usually divided into two different categories: (1) perivascular macrophages (PMs) are located around the blood vessels and play a key role in intravasation, and (2) tumor associated macrophages (TAMs) that are distributed throughout the tumor and aid the tumor cells in migrating towards blood vessels.11 A subpopulation of perivascular TAMs in contact with both a tumor cell and an endothelial cell form a structure called TMEM (Tumor MicroEnvironment of Metastasis). Tumor cells and macrophages migrate towards signals emanating from the TMEM and the TMEM then creates a passage for the newly arriving tumor cells and they undergo a transendothelial migration into the blood vessels.11
Tumor cells manipulate the innate mechanisms of the macrophages via signaling molecules in order to migrate. The tumor cells secrete CSF-1 (Colony Stimulating Factor-1), which binds to and activates the macrophage's CSF-1 receptors. Activation of the CSF-1 receptors initiates an internal cascade of events that, among other things, enables the cells to detect a CSF-1 gradient and protrude towards it. Activated macrophages can chemotact in the direction of the CSF-1 gradient and begin secreting EGF (Epidermal Growth Factor), which diffuses and binds to tumor cell's EGF receptors.1,12 Activated tumor cells respond by secreting more CSF-1 and chemotact in the direction of the EGF gradient. Both EGF and CSF-1 receptors are tyrosine kinases receptors.13 This process results in a local chemotactic signaling loop that is also called a paracrine signaling loop (Fig. 1).
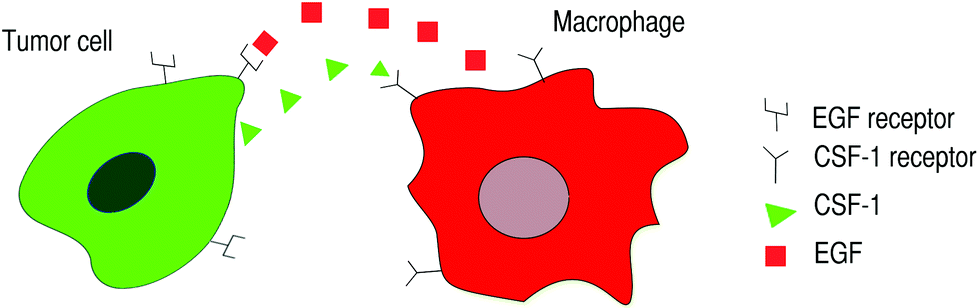 | ||
| Fig. 1 Macrophages and tumor cells can interact via a paracrine signaling loop. Tumor cells secrete CSF-1 and have EGF receptors. Macrophages secrete EGF and have CSF-1 receptors. When CSF-1 receptors on macrophages are activated, the macrophages respond by secreting EGF and chemotact in the direction of the CSF-1 gradient. When EGF receptors on tumor cells are activated, the tumor cells respond by secreting CSF-1 and chemotact up the EGF gradient. This paracrine signaling loop enables tumor cells to migrate alongside macrophages away from the primary tumor and towards blood vessels or surrounding tissues. | ||
The present research focuses on the chemotaxis of tumor cells and macrophages towards a signaling source, but not all tumor cells become motile in response to EGF. Research by Philippar et al.14 has shown that motile tumor cells express different mammalian enabled isoforms called Mena isoforms. Mena, an actin regulatory protein, is involved in the regulation of cell motility. The tumor environment can induce expression of two isoforms, increased Mena invasive (MenaINV) and at the same time decreased expression of Mena11a. Tumor cells with this MenaINV expression pattern participate with macrophages in migration and intravasation in mouse mammary tumors in vivo while those with the Mena11a do not.15,16 MenaINV cells also respond to much lower EGF concentrations and secrete more CSF-1 than cells with Mena11a expression.15
The objective of this paper is to improve the current understanding of the EGF/CSF-1 paracrine signaling loop by simulating the two cell types involved and their reactions to gradients of either EGF (tumor cells) or CSF-1 (macrophages). We set out to answer the following questions:
• Is the paracrine loop sufficient for migration of both cell types in vitro and in vivo?
• How does the paracrine signaling loop enhance migration of tumor cells and macrophages?
• How do changes in various parameters of the signaling system affect the migration of both cell types?
• How important is the removal of the signaling molecules to the migration of cells?
• Under what conditions is the 3:1 ratio of collected tumor cells to macrophages, observed in the in vivo experiments, robust?
• Which aspects of the signaling pathway would be the most efficient to target for treatments?
Experimental background
In vitro experiments by Goswami et al. in 20054 were among the first experiments to show that the EGF/CSF-1 paracrine loop between macrophages and tumor cells is both necessary and sufficient for tumor cells to migrate into collagen. To study the invasion of tumor cells into collagen, the authors plated 80000 MTLn3-GFP tumor cells, both in the absence and presence of 200000 BAC1.2F51.2F5 macrophages, on a 35 mm MatTek Dish. The cells were overlaid with a 750–1000 μm thick layer of 5–6 mg ml−1 collagen I. The collagen layer was added to mimic the environment of breast tumor cells where they can move along collagen fibres towards blood vessels and intravasate. Media that included CSF-1 was placed on top of the collagen. The tumor cells were considered to be invasive if they migrated >20 μm into the collagen. In the absence of macrophages, only a few tumor cells migrated into the collagen. However, when the two cell types were plated together ∼25% of the tumor cells migrated >20 μm into the collagen, (see Goswami et al.4Fig. 2c,d). These invasive tumor cells were found in the vicinity of macrophages, suggesting that the proximity of the two cell types was necessary for invasion. When experiments were repeated with MDA-MB-231 human breast tumor cells, ∼70% of the cells migrated >20 μm into the collagen in the presence of macrophages, but in the absence of macrophages very few tumor cells became invasive. This demonstrated that both MDA-MB-231 and MTLn3 tumor cells have increased invasion in the presence of macrophages.
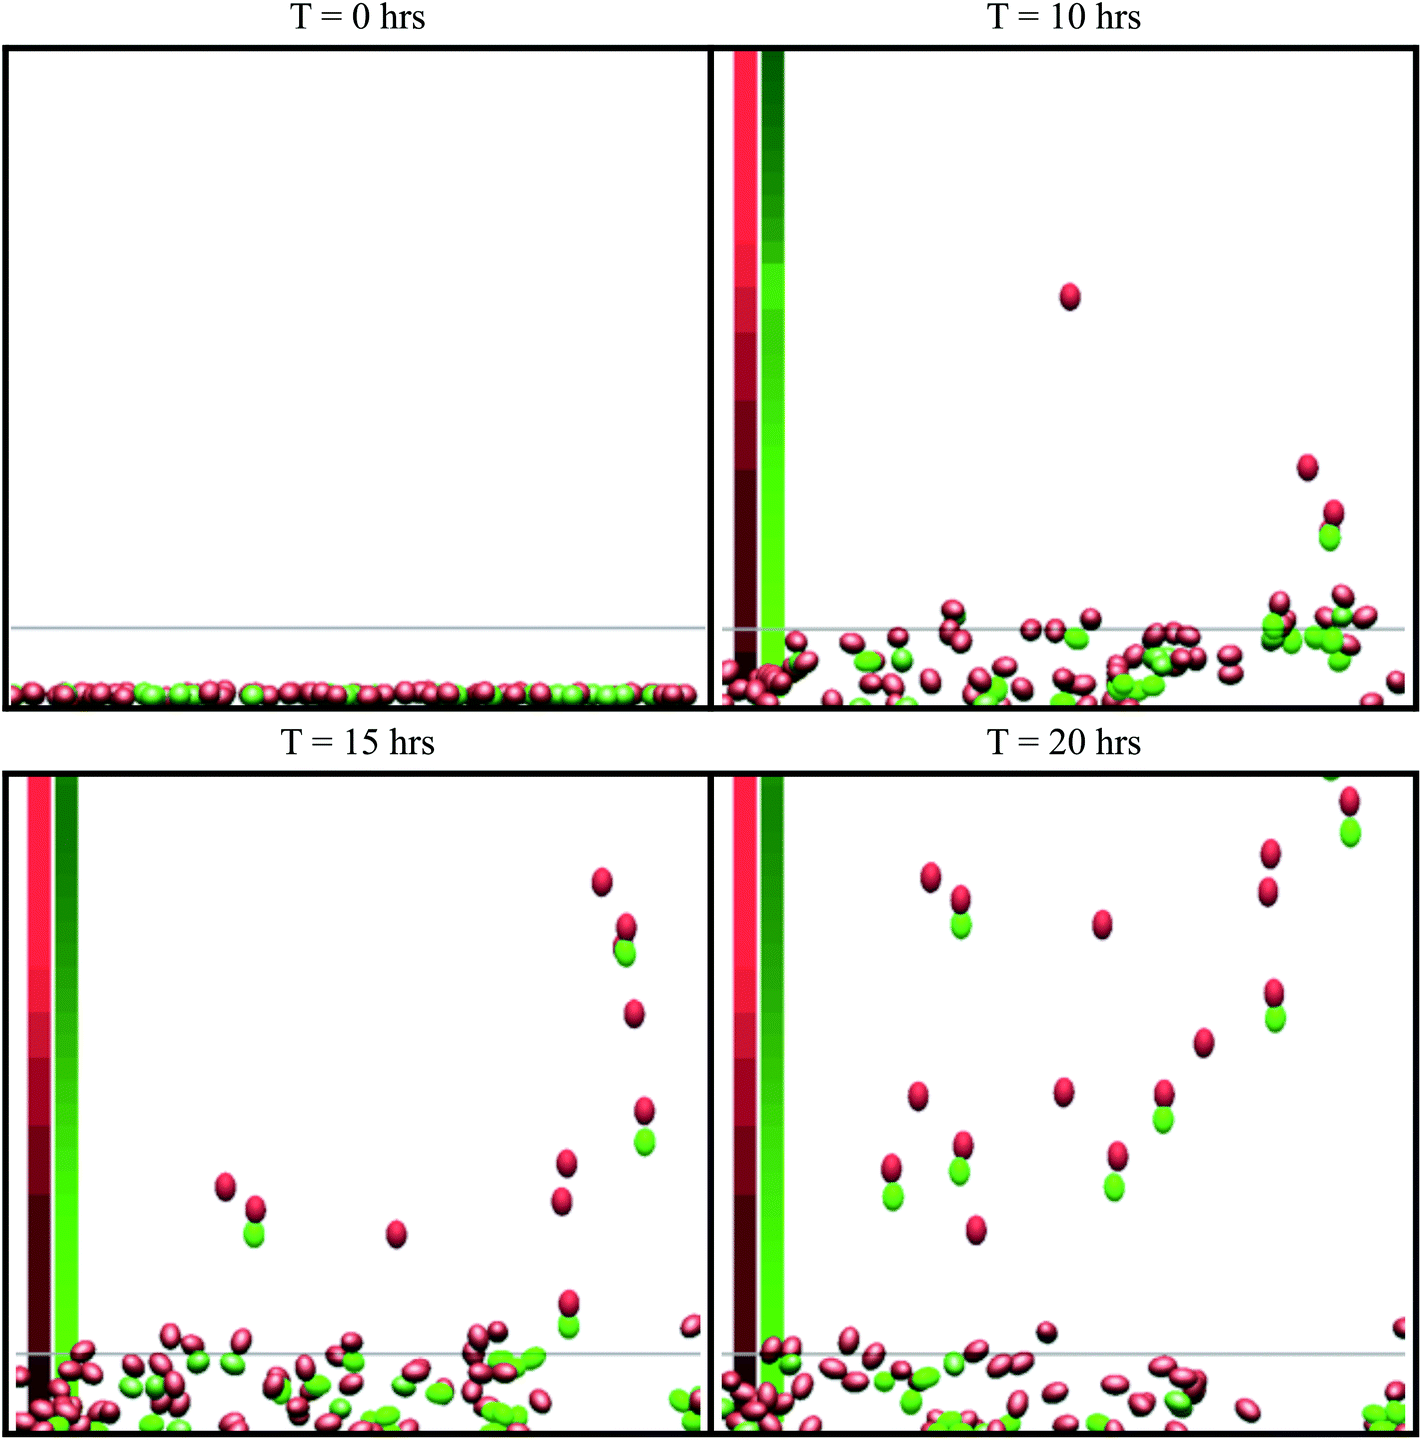 | ||
| Fig. 2 Snapshots from simulations of the in vitro simulation setup. This is a side view (x–z plane) of the simulation. The green cells are tumor cells and the red cells are macrophages. The cell colour becomes brighter when cells undergo chemotaxis. Cells above the grey line (z = 25 μm) are marked as invasive. The average concentration in the centre of the domain is shown on the left, where the red column represents the CSF-1 concentration and the green column represents the EGF concentration. Brighter colours indicate a stronger signal. See S1-Movie† for video. | ||
Goswami et al.4 found that when exposed to 12.5 nM [EGF], CSF-1 mRNA levels in tumor cells tripled and when exposed to 36 ng ml−1 [CSF-1], EGF mRNA levels doubled in macrophages.4 These results implied that when tumor cells and macrophages are co-cultured in the presence of each other, production increases for both EGF in macrophages, and CSF-1, in tumor cells.
Elaborating on these results, Goswami et al.4 explored how blocking either EGF receptors or CSF-1 receptors affected the invasion of cells. Blocking either of the receptors resulted in a drastic decrease in the number of both cell types invading the collagen (50–80% decrease). These results suggested that it is not just the presence of macrophages that is necessary for tumor cell invasion, but specifically the EGF molecules that they produce in response to the CSF-1. In summary, the EGF/CSF-1 paracrine signaling loop and the chemotaxis of tumor cells and macrophages towards respectively EGF and CSF-1 is necessary for tumor cell invasion, and blocking the paracrine signaling loop decreases the number of invasive cells.
In 2004, Wyckoff et al.1 conducted in vivo experiments in mice to study motility and intravasation of mammary tumor cells and macrophages. The authors used PyMT-induced mammary tumors and a multi-photon microscope to view the process. Tumors were grown for 16 to 18 weeks after which the anaesthetized mice were viewed under a microscope. Collection needles containing 25 nM EGF were placed inside the tumor. The EGF concentration at the opening of the needle inside the tumor was estimated to be around 1.25 nM. In 4 h, approximately 1000 cells were collected, with 73% tumor cells and 26% macrophages (see Wyckoff et al.1Fig. 3a,b). This ratio of approximately 3:1 tumor cells to macrophages was also observed when MTLn3 cells were grown in rats. The researchers repeated the experiments using different receptor blockers. The number of collected cells decreased by 50% when using an EGF receptor inhibitor in the needles with 25 nM EGF. Experiments with a CSF-1 receptor blocker, in needles containing 25 nM EGF, reduced the number of collected tumor cells by 50% and the number of collected macrophages was decreased to <3% of the total cells. The authors also tested the paracrine signaling loop by conducting experiments with tumor cells that did not produce CSF-1. The absence of CSF-1 leads to a lower macrophage density in the tumors of these mice. In these experiments the total number of cells collected decreased to 300 and the percentage of macrophages was only 5–7%. This paper demonstrated the first in vivo evidence that macrophages are playing a role in metastasis.
 | ||
| Fig. 3 Growth factor secretion in vitro significantly changed the number of invasive cells. (A) Secretion of CSF-1 by tumor cells was increased. When the secretion was too large, the macrophages do not migrate towards the CSF-1 gradient from the top but rather towards the tumor cells at the bottom. (B) Secretion of EGF by macrophages, was increased. The macrophages need the tumor cells to start migrating towards the gradient of CSF-1 from the top because otherwise they found themselves in an environment where the CSF-1 concentration was saturated and the cells did not detect a gradient. See S2-Movie† for video with CSF-1 secretion = 0.3 nM min−1. | ||
Methods
Computational model
The computational framework is based on a discrete model developed by E. Palsson to study cell–cell signaling and cell motility in multicellular systems.17 Here the model has been extended to include characteristics of tumor cells and macrophages, a paracrine signaling system and two signaling molecules, CSF-1 and EGF. The model is written in the C programming language and 3-D images and movies are generated using the graphic program openGL.Below is a brief description of the 3-D model (see Appendix S1† for more details). The tumor cells and macrophages are modeled as individual deformable ellipsoids that can exert and respond to forces and interact via chemical signaling. The forces are (i) the active forces, Factive, when the cell attempts to move either randomly or chemotacticly, and (ii) the exclusion force, Fexclusive, when a cell comes into contact with another cell or obstacle:
 | (1) |
The exclusive force between cells depends on d, a measure of the distance between the surface of the two cells and is:
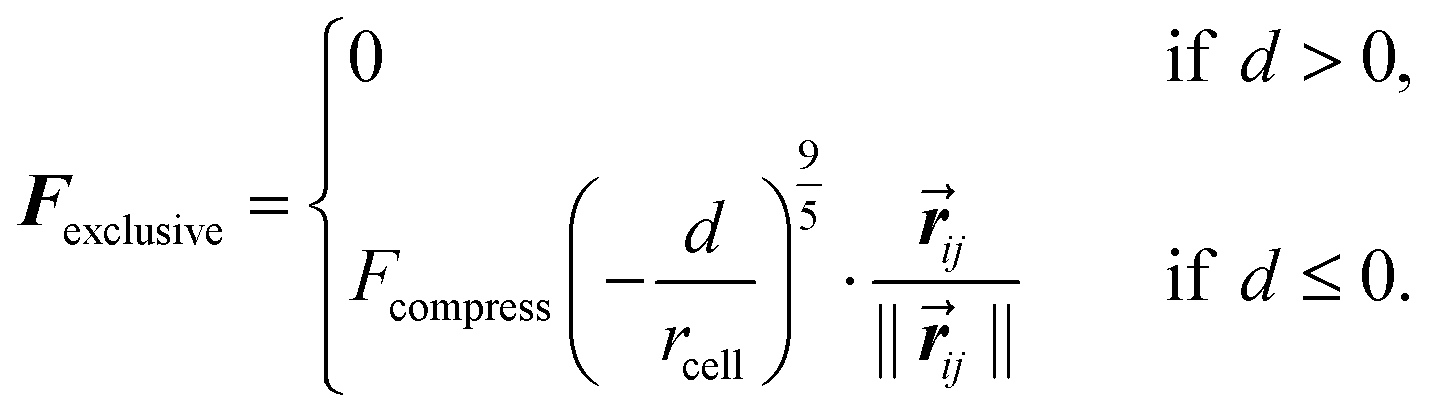 | (2) |
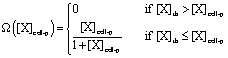
The cells also respond to and secrete chemical signals. The local CSF-1 concentration around a cell is found by averaging the concentrations around the grid cubes where the cell is located (eqn (S14) and (S15) in Appendix S1†). The tumor cells or macrophages migrate towards a gradient of EGF or CSF-1 respectively if the local concentration and the relative gradient across the cell diameter are above some set detection thresholds in the model. These two thresholds capture the cell's sensitivity to the signaling molecules and capability to respond to gradients of certain magnitude.
If the cell's local concentration of the signal is above a set level, the tumor cell or macrophage will respond by secreting CSF-1 or EGF respectively.
 | (3) |
The cells are moving in a low Reynolds number and therefore all the active and exclusive forces are balanced by the drag force, resulting in the following equation of motion:
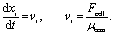 | (4) |
The concentration of signaling molecules is recorded on a 3-D lattice grid and evolves via a system of differential equations solved for each cell and coupled to the lattice grid cubes where diffusion occurs. The signaling ligands are known to be depleted both through endocytosis (internalization of the receptors and the ligand) and degradation, mostly by matrix metalloproteases (MMPs) or other proteases, which can be either membrane bound or soluble. Thus, the depletion of the ligands is split into two: local ligand depletion (LLD), which occurs on the cell membrane, and global ligand depletion (GLD), which is uniform and accounts for depletion by soluble MMPs as well as perfusion.
The secretion of either EGF/CSF-1 from each cell is distributed into all the lattice cubes that the cell is located in:
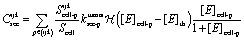 | (5) |
 is the Heaviside function. A similar equation is used for the EGF secretion. The diffusion of X = EGF, CSF-1 is given by:
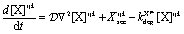 | (6) |
 is the diffusion coefficient for EGF and CSF-1 and kXijkdeg is the depletion coefficient for EGF or CSF-1.
In the simulations, the tumor cells and macrophages are randomly distributed at a given initial density and ratio. The forces and chemical environment that the cells experience is then calculated and the cells are moved accordingly, on a grid-free 3-D domain. The cells move in either a random direction or, if the EGF (or CSF-1) gradient across the cell's diameter is above detection threshold, in the direction of a gradient.
Below is the outline and order of the actions that were performed at each time step in the simulations after the initial setup. The time step is 0.01 min and each grid cube is 103 μm3.
1. The local concentration of the signaling molecules (EGF and CSF-1) around each cell was calculated (eqn (S14) and (S15)).†
2. The cell secretion was distributed into the lattice cubes (according to eqn (5)) and the diffusion and depletion of EGF and CSF-1 was calculated (using eqn (6)).
3. Cells were oriented towards the EGF or CSF-1 gradient if it was above a set threshold. Otherwise cells were oriented in a random direction, biased towards the direction it was moving in the previous time step.
4. All the active and exclusive forces acting on each cell were calculated.
5. Cells were moved according to the equation of motion (eqn (4)). This process was repeated for every timestep.
Parameter estimates
Where applicable, we used parameters found in the literature. Other parameters were estimated or adjusted to match observations from experiments. The parameters that were used in the model are listed in Tables 1–3. Table 1 shows the parameters that remained unchanged throughout all the simulations. Tables 2 and 3 show, respectively, the default parameters for the in vitro and in vivo simulations.| Parameter | Symbol | Value | Ref. |
|---|---|---|---|
| Cell radius | r cell | 5 μm | 2 |
| Spring constant 1 | k 1 | 4 × 10² nN μm−1 | |
| Spring constant 2 | k 2 | 2 nN μm−1 | |
| Cell viscosity | μ | 6 × 10⁻⁶ dyne s per μm | |
| Chemotaxis force | F chemotax | 0.2 nN | 4 |
| Random force | F random | 0.15 nN | 4 |
| Compression force | F compress | 30 nN | |
| ECM viscosity | μ ecm | 8 × 10⁻³ dyne s per μm | 25 |
| Parameter | Symbol | Value | Ref. |
|---|---|---|---|
| Diffusion | D | 1 × 10⁻⁷ cm2 s−1 | 18 |
| CSF-1 LLD by macrophages | k macroloc-csf | 0.04 min−1 | 10 |
| EGF LLD by tumor cells | k tumorloc-egf | 0.02 min−1 | 20 |
| CSF-1 and EGF GLD | k ext | 0.02 min−1 | 21 |
| CSF-1 secretion in response to EGF | k tumorsec | 0.1 nM min−1 | 23 |
| EGF secretion in response to CSF-1 | k macrosec | 0.1 nM min−1 | 22 |
| CSF-1 gradient threshold | k macrothr | 3% | |
| EGF gradient threshold | k tumorthr | 1% | |
| EGF concentration threshold | [E]th | 0.001 nM | |
| CSF-1 concentration threshold | [C]th | 0.001 nM |
| Parameter | Symbol | Value | Ref. |
|---|---|---|---|
| Diffusion | D | 1.7 × 10⁻⁸ cm2 s−1 | 18 |
| CSF-1 LLD by macrophages | k macroloc-csf | 0.04 min−1 | 10 |
| EGF LLD by tumor cells | k tumorloc-egf | 0.02 min−1 | 20 |
| CSF-1 and EGF GLD | k ext | 0.05 min−1 | 21 |
| CSF-1 secretion | k tumorsec | 0.1 nM min−1 | 23 |
| EGF secretion | k macrosec | 0.01 nM min−1 | 22 |
| CSF-1 gradient threshold | k macrothr | 3% | |
| EGF gradient threshold | k tumorthr | 1% | |
| EGF concentration threshold | [E]th | 0.001 nM | |
| CSF-1 concentration threshold | [C]th | 0.001 nM | |
| Concentration at needle opening | 1.25 nM | 1 | |
| Percentage of macrophages | 15% | 4 |
The EGF diffusion coefficient was obtained from ref. 18. The molecular weights of CSF-1 and EGF are M1 = 60.1 and M2 = 6.6 kDa.18,19 The diffusion rates of the two signaling molecules scale roughly by a factor of (M1/M2)1/3 = (60.1/6.6)1/3 ≈ 2, so they are the same order of magnitude and for simplicity we assume they are equal in our model.
As mentioned earlier, the local ligand depletion arises from endocytosis, MMP degradation and pinocytosis. According to ref. 9, the pinocytic rate is small compared to the endocytosis10,20 and MMP rates.21 We estimated the secretion rates based on the average concentration of EGF (Ẽ = 0.23 nM (ref. 1, 22)) and CSF-1 (![[C with combining tilde]](https://www.rsc.org/images/entities/i_char_0043_0303.gif) = 0.16 nM (ref. 23)) in breast tumors, using a steady state approximation with fixed degradation.24 The random and chemotactic forces, Fchemotax and Frandom were adjusted so that the average cell velocity (about 1 μm min−1) matched experimental observations4 using our estimate of the ECM viscosity, μecm.
= 0.16 nM (ref. 23)) in breast tumors, using a steady state approximation with fixed degradation.24 The random and chemotactic forces, Fchemotax and Frandom were adjusted so that the average cell velocity (about 1 μm min−1) matched experimental observations4 using our estimate of the ECM viscosity, μecm.
Results
We developed a model to explore the paracrine signaling between macrophages and mammary tumor cells to understand how the signaling enhances invasiveness of the tumor cells. The model simulations and predictions are compared to two specific experimental setups: (1) An in vitro setup, where macrophages and tumor cells are plated on a petri dish and respond to a CSF-1 signal from a plane source4 and (2) in vivo setup, where cells inside a tumor respond to an EGF point source.1 Using the computational model, with a common set of rules, we successfully simulated both experimental setups and compared our results with the experimental data. Many of the simulation results cannot be directly compared between these two experimental setups, because the cells' external environment and boundaries are quite different for the in vitro and the in vivo setups. Also, the number of invasive macrophages were not counted4 in the in vitro experiment, thus we did not explore the tumor cell macrophage ratio in the in vitro simulations. These two experimental setups do have some commonalities, such as the paracrine signaling system, that translate from one setup to the other. Our first step was to compare the simulaltion results to the in vitro experiments.4 The in vitro system provided a great starting point to model because it was a more precisely controlled environment that was relatively easy to manipulate. It had fewer uncertainties about the factors that contribute to the cells' responses and this helped estimating some of the parameters that we could not find in the literature. Once we gained confidence in our model setup, we used the model to better understand the paracrine signaling and explore the effect that changes in different parameters had on the invasion of cells.In vitro simulation setup
The simulation setup for the in vitro experimental framework consists of randomly distributing 900 cells on the bottom of a 900 μm × 900 μm surface in the x–y plane. 70% of the cells were macrophages and 30% were tumor cells, matching the tumor cell/macrophage ratio and density in the experiments.4 Extracellular matrix, ECM, of thickness 750 μm in the z-direction was placed above the cells. The cells can exert motive forces and migrate through the ECM. At the top, above the ECM, we placed a constant 20 nM source of CSF-1, emulating the experimental media CSF-1 concentration.4 The simulations were repeated 10 times and the average of the results is reported in the figures (error bars represent one standard deviation). Only cells that had migrated >25 μm in the positive z-direction, at the end of the simulations, are considered to be invasive cells. Using the parameters in Tables 1 and 2, on average 21% of the tumor cells and 40% of the macrophages invaded into the collagen. Snapshots from a typical simulation with only 100 cells (for illustration purposes) are shown in Fig. 2. Although the invasive macrophages were not counted in the in vitro experiments, macrophages were often observed in close proximity to invasive tumor cells similar to Fig. 2. Fig. 3–Fig. 7 show how changing certain model parameters altered the fraction of invasive cells.Changing EGF and CSF-1 secretion in vitro
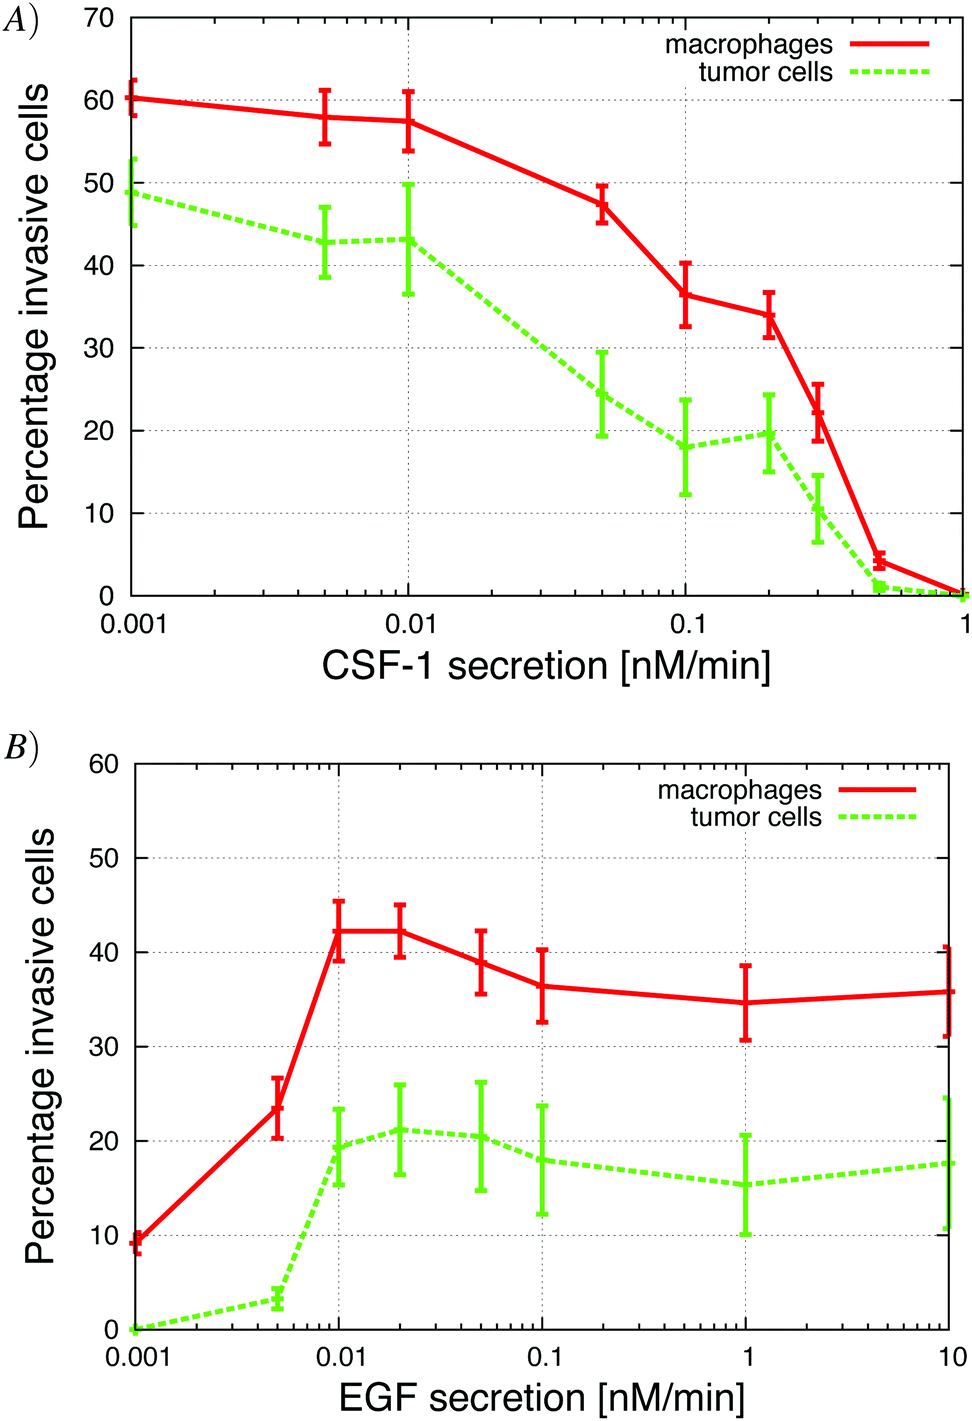
The in vitro experiments demonstrated the importance of the EGF/CSF-1 paracrine signaling, so we performed a large number of simulations of the in vitro system, where we modified various parameters and explored the effect on the behavior and number of invasive cells. In Fig. 3, we show how changes in either EGF or CSF-1 secretion by the macrophages and tumor cells affected their ability to co-migrate and become invasive. Increasing CSF-1 secretion by tumor cells resulted in a decrease in the percentage of invasive tumor cells and macrophages (Fig. 3A). When the tumor cells secreted more CSF-1, the concentration of CSF-1 at the bottom increased and this interfered with the CSF-1 gradient from the top. Thus, fewer macrophages could polarize towards the CSF-1 gradient from the top, thus suggesting that the CSF-1 signaling was not helping the tumor cells invade. However, this is likely only true in this particular in vitro experimental setup, for high CSF-1 secretion, when the signal from above is CSF-1.Increasing macrophage EGF secretion, leads to an increase in the percentage of both invasive tumor cells and macrophages (Fig. 3B). Maximum invasion was reached at 0.01 nM min−1 EGF secretion, after which the percentage of invasive cells decreased slightly. This decrease in tumor cell invasion when EGF secretion is high, may be because now it takes CSF-1 secreting tumor cells less time to get close to the macrophages, and this may interfere with the CSF-1 gradient from the top. Interestingly, at EGF secretion below 0.007 nM min−1, the number of invasive cells dropped dramatically to almost zero. The decrease in invasive tumor cells at low EGF secretion was to be expected, but the drop in macrophage invasion was somewhat surprising as they should chemotact freely towards the CSF-1 gradient from the top. In these simulations, the cells at the bottom of the plate seemed to have difficulty detecting the CSF-1 gradient from the top and we speculated that this was a side affect of the no flux boundary condition imposed at the bottom. In the in vitro experiments,4 the cells were placed on the bottom of a petri dish through which there was no flux.
Exploring diffusive boundary effects in vitro
To test the effect of the boundary condition, we added 1% flux at the bottom. Fig. 5 shows the respective CSF-1 concentration profiles for 1% flux and no-flux boundary conditions. When there was no flux, CSF-1 built up at the bottom, and close to the plate the CSF-1 gradient from above flattened and even reversed in some simulations. This prevented the macrophages from invading because they do not detect an upwards gradient, unless they manage to get above the flat part of the CSF-1 gradient. Fig. 5A shows that the CSF-1 gradient at the bottom does not become flat when some flux at the boundary was included. With 1% flux at the bottom, most of the macrophages detected the CSF-1 gradient and migrated towards the top (Fig. 4). In these simulations, the majority of the macrophages became invasive regardless of EGF secretion. For low EGF secretion levels, no tumor cells became invasive, but all of the tumor cells became invasive as the secretion parameter was increased. In the simulations with no-flux boundary conditions and EGF secretion above 0.007 nM min−1, the tumor cells chemotacted towards the macrophages and this motion often nudged the macrophages above the flat part of the CSF-1 gradient and thus they became invasive (solid lines Fig. 4). The macrophage invasion at low EGF secretion could also be rescued by increasing the random macrophage movement (results not shown). Fig. 5B shows that with flux at the bottom, the global gradient of the EGF signal was towards the peak in EGF concentration. This peak moved upwards with the upwards movement of the macrophages, and the tumor cells followed this gradient.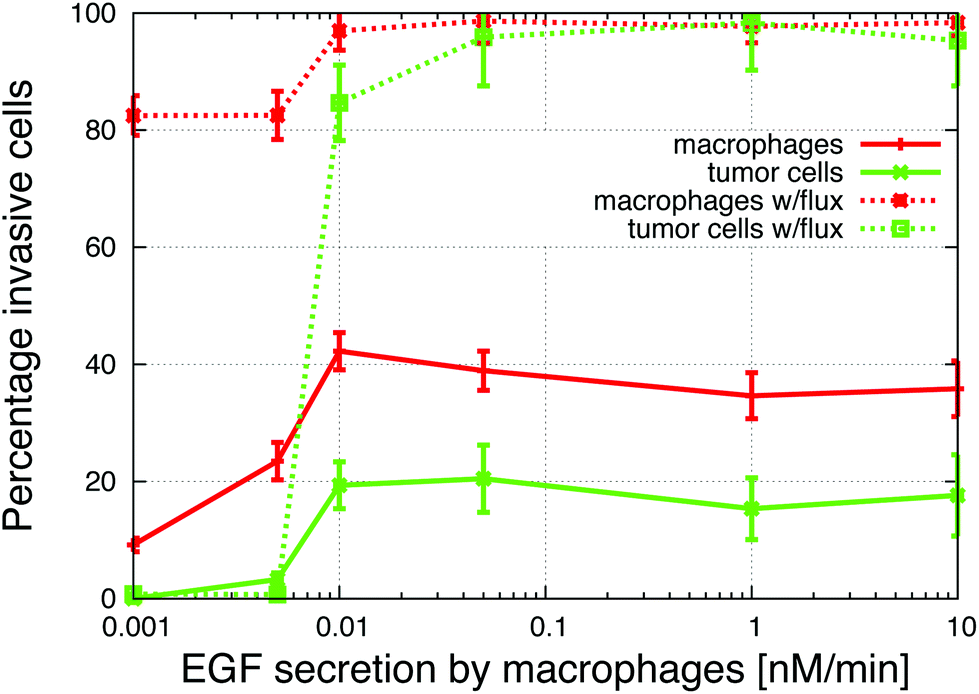 | ||
| Fig. 4 Increasing the secretion of EGF by macrophages in two different in vitro simulations; with and without flux at the bottom of the simulation space. The addition of a flux boundary condition enables macrophages to invade more easily. Parameters are from Table 2. | ||
 | ||
| Fig. 5 Typical CSF-1 and EGF concentration profiles with and without flux boundary conditions. The bottom of the plate is at z = 0. (A) CSF-1 concentration profile and (B) EGF concentration at the end of 24 hours. The EGF secretion in the graphs was 0.05 nM min−1. | ||
Changing the initial macrophage fraction in vitro
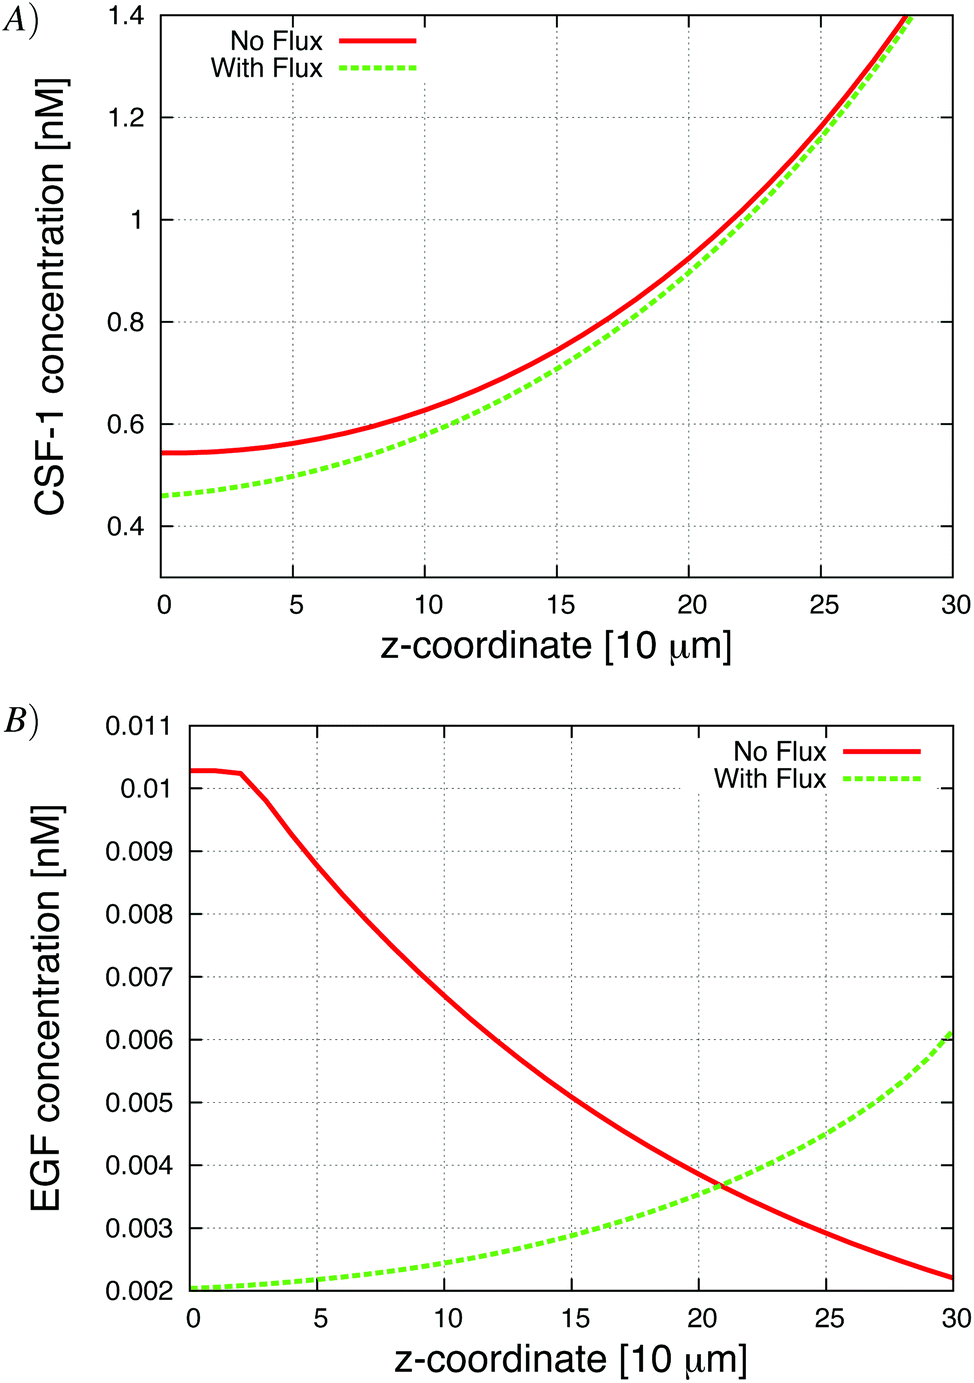
The Goswami et al.4 experiments were conducted with 70% macrophages and 30% tumor cells. We explored how the initial tumor cell–macrophage ratio changes the results. In Fig. 6, the percentage of macrophages was increased while keeping the number of cells constant. | ||
| Fig. 6 The percentage of macrophages (out of 900 cells), in each in vitro simulation, was systematically increased in these graphs. (A) Number of invasive tumor cells (green dashed line), macrophages (red solid line) and the total number of invasive cells (blue dotted line). The maximum number of invasive cells was at 40% macrophages. (B) The fraction of tumor cells and macrophages that invaded. At the maximum, almost 90% of cells invaded. See S3-Movie† for video with 20% macrophages. | ||
At low initial macrophage percentage, the total number of invasive tumor cells was low, but a large fraction of the macrophages invaded. The number of invasive tumor cells was higher than the number of invasive macrophages, because each invading macrophage was surrounded by many tumor cells that followed it upwards. When about 40% of the cells were macrophages, both the total number of invasive cells and percentage of each invading cell type was at a maximum (Fig. 6A). As the initial macrophage percentage was increased further, the total number of invasive cells decreased until it eventually reached zero.
Fig. 6B shows that as the initial percentage of tumor cells increases from zero, the fraction and number of invasive macrophages also increases. Given that macrophages chemotact towards CSF-1 gradients, one might assume that they would invade regardless of the number of tumor cells. However, at 0% of tumor cells only 10% of the macrophages invaded. This agrees with the in vitro experiments when macrophages are plated alone and very few cells invade (Goswami et al.Fig. 2B4). The authors postulated that the macrophages needed to be activated by the tumor cells before they would respond to the CSF-1 signal. However, our simulation results suggest that this reduction in percentage of invasive macrophages could be caused by the no-flux boundary condition and the CSF-1 build up at the plate. This phenomena was explained for Fig. 5. This is also an example of how the paracrine signaling enhances the invasion of tumor cells and macrophages.
Changes in depletion of EGF and CSF-1 in vitro
Increasing the global depletion of EGF and CSF-1 resulted as expected in a biphasic response in the number of invasive cells (Appendix S2,† Fig. S-2). At too low depletion the signal profile becomes flat, macrophages are unable to detect gradients and no cells invade. For too high depletion, the CSF-1 signal from the top was attenuated and the macrophages could not detect the gradient.Increasing the rate of CSF-1 local ligand depletion (LLD) initially increased the percentage of both invasive tumor cells and macrophages (Fig. 7A). Even at very low local CSF-1 depletion rates, there was still global depletion of CSF-1 so the signaling system partially worked. As the CSF-1 LLD was increased, the CSF-1 gradient sharpened and the build up of the CSF-1 at the bottom was reduced. This resulted in more macrophages invading and the tumor cells followed along because the EGF signaling was not affected. The invasion was maximized when the CSF-1 LLD was 10 min−1, at which point all the tumor cells and macrophages were invasive. At higher CSF-1 LLD, the depletion of the signal was too fast so the macrophages no longer detected the CSF-1 gradient and the number of invasive cells decreased. However, even with very high local depletion of CSF-1, invasive macrophages and tumor cells were detected. High CSF-1 LLD increased CSF-1 signal depletion locally around the macrophages, so they did not detect a CSF-1 gradient from the top. However, if some macrophages move out of that local region, they detect the CSF-1 gradient from above and migrate towards the source from the top. The EGF signal was not affected by the CSF-1 LLD so the tumor cells still chemotacted towards the macrophages and they could nudge them. This in effect increased the macrophage's random movement enough so that some moved out of the local region and invaded. The tumor cells then followed the macrophages. These results differ from the results for high global depletion when no cells invaded (Fig. S-2†), because in this case the EGF signal was also depleted.
 | ||
| Fig. 7 The response to increase in local ligand depletion, in vitro, was not the same for EGF and CSF-1. (A) Increasing the local ligand depletion of CSF-1 by macrophages resulted in an initial increase in the percentage of invasive cells to a maximum where all the cells were invasive. Increasing the local ligand depletion beyond this maximum value resulted in a decrease in the percentage of invasive cells. (B) Increasing the local ligand depletion of EGF by macrophages decreased the percentage of invasive tumor cells and macrophages until no cells became invasive. | ||
In Fig. 7B, the local depletion of EGF by tumor cells was increased. Initially, there was a slight increase in the number of invasive cells followed by a sharp decrease when the local depletion exceeded 1 min−1. At higher local EGF depletion rates almost no cells were invasive. At such high EGF LLD the signal was depleted rapidly so tumor cells did not chemotact towards macrophages, nor did they produce much CSF-1. Hence, they remained close to the bottom. At the same time, CSF-1 concentration at the bottom increased because of the no-flux boundary conditions. This increase in CSF-1 concentration at the bottom reversed the CSF-1 gradient from above and attracted the macrophages back. As the tumor cells no longer detected EGF, they did not nudge the macrophages out of the boundary region and therefore, just as when there were no tumor cells, very few macrophages migrated into the collagen. This differs from high CSF-1 LLD (Fig. 7A), where the cells managed to move out of the boundary region because the tumor cells chemotacted towards the macrophages, combined with less buildup of CSF-1 at the bottom.
In vivo simulation setup
After gaining confidence in our model from the simulations and predictions of the in vitro system, we next simulated and explored the in vivo experiments from Wyckoff et al.1 These results should give us a better understanding of the real life situation and how to best disrupt the paracrine signaling pathway from a treatment perspective. In the experimental, in vivo system, a needle (with an estimated 1.25 nM EGF concentration at the needle opening) was inserted into a mouse mammary tumor. Tumor cells and macrophages that migrated into the needle were counted and sorted.1In a mammary tumor, only a subpopulation of the tumor cells, MenaINV, have the potential to become invasive. These active cells are scattered around a much higher number of unresponsive Mena11a tumor cells that do not contribute to the cell–cell interactions. This system was simulated on a 700 × 700 × 700 μm3 size tumor where there was a total of 5832 responsive cells, 85% tumor cells (4957 cells) and 15% macrophages (875 cells), distributed among a much higher number of non responsive cells.
In the tumor mass, cells are relatively tightly packed and the signaling molecules must diffuse around the cells because they cannot diffuse through them. This, in effect, increases the length that a molecule must travel and can be approximated by reducing the diffusion rate relative to the less constrained diffusion in the collagen gel.26 Therefore, we set the EGF and CSF-1 diffusion rate to be smaller for the in vivo simulations than in the in vitro simulations. The parameters that were used for the in vivo simulations are listed in Table 3.
Fig. 8 shows snapshots from a typical in vivo simulation. Both the tumor cells (green) and macrophages (red) migrated towards the needle opening (the grey sphere). The cells first appeared to chemotact towards each other and two or more cells migrated together towards the needle. When the cells reached the needle opening, they disappeared from the simulation window. The density of active cells decreased with time. For simulations conducted with the parameters from Table 3, approximately 1000 cells were collected in a time period of 4 h. This was the basic setup for the in vivo simulations. In Fig. 9–12, the sensitivity to various parameters was explored. The data points in all these graphs represent the average of 50 simulations and the error bars show one standard deviation.
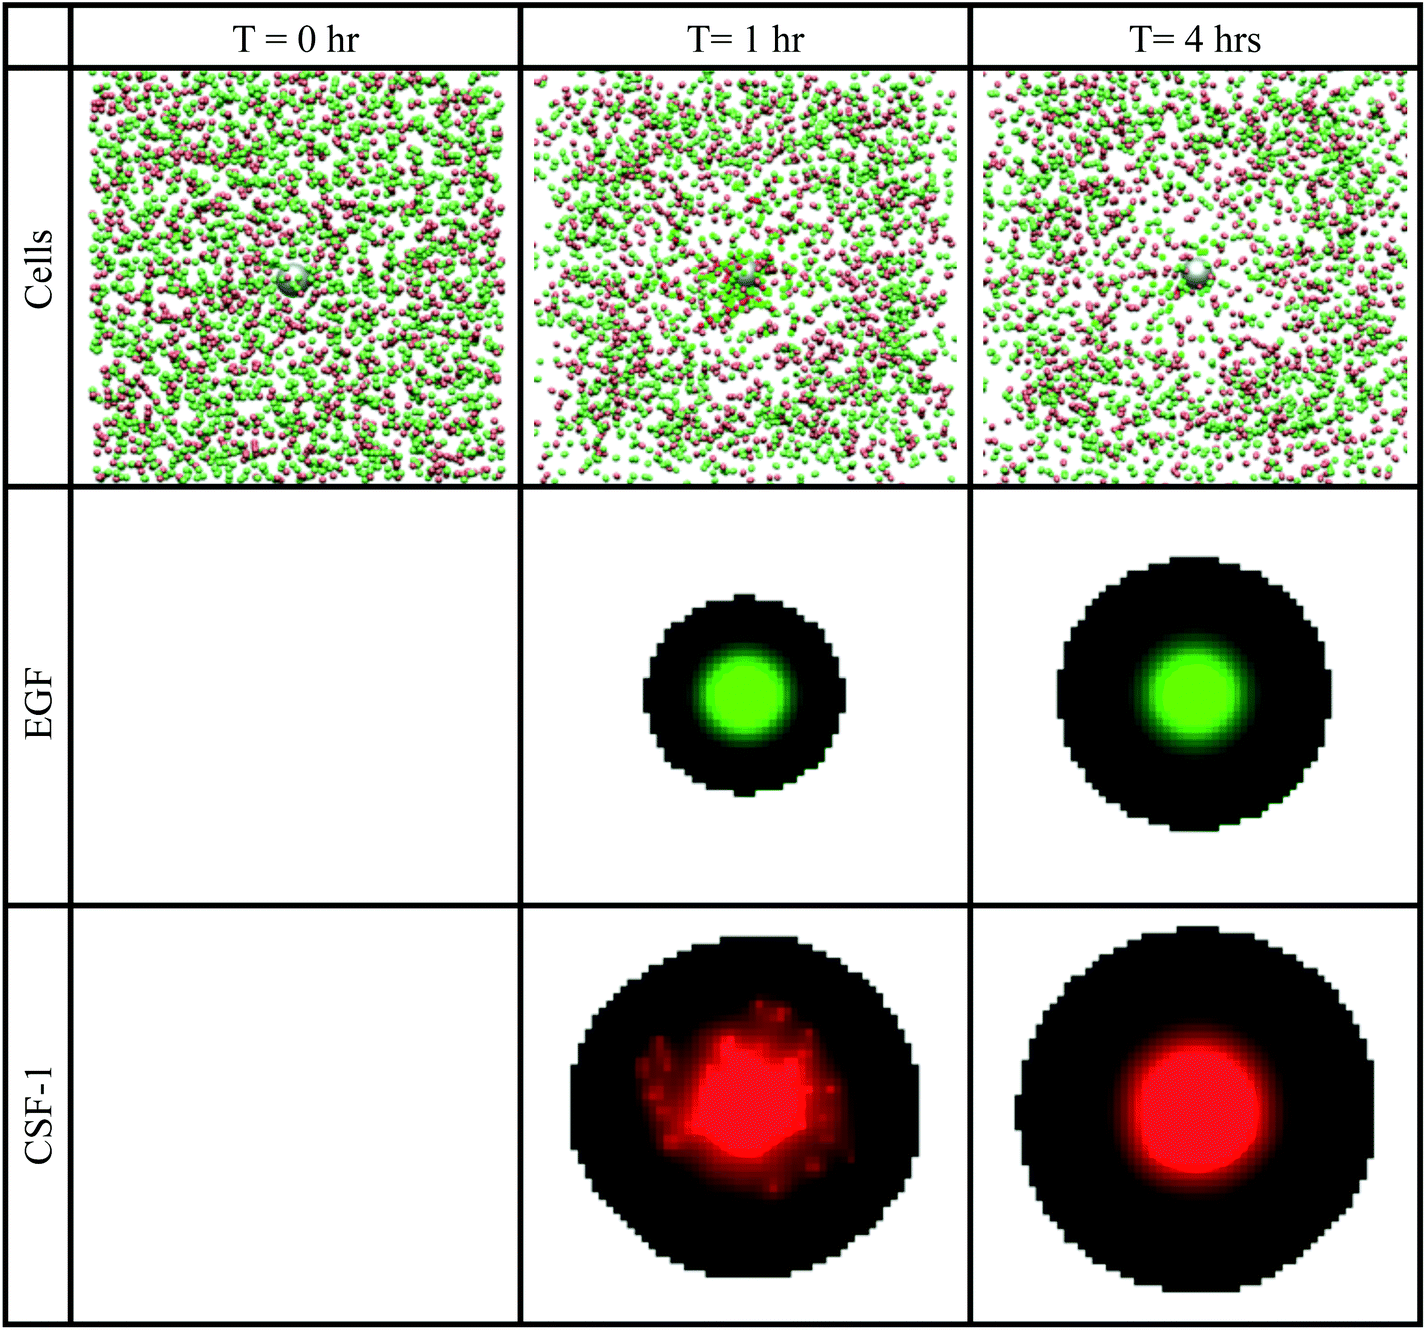 | ||
| Fig. 8 Snapshots at different times, of the in vivo basic simulations setup. Top row: tumor cells (green spheres) and macrophages (red spheres) aggregated together towards the grey sphere, which represents the needle opening. When cells touch the needle, they disappear from the simulation window. Second row: the green colour represents the EGF concentration at a cross section through the centre of the simulation space. Bottom row: the red colour represents the CSF-1 concentration at a cross section through the centre of the simulation space. Brighter colours represent higher concentration. See S6-Movie† for video of this simulation. | ||
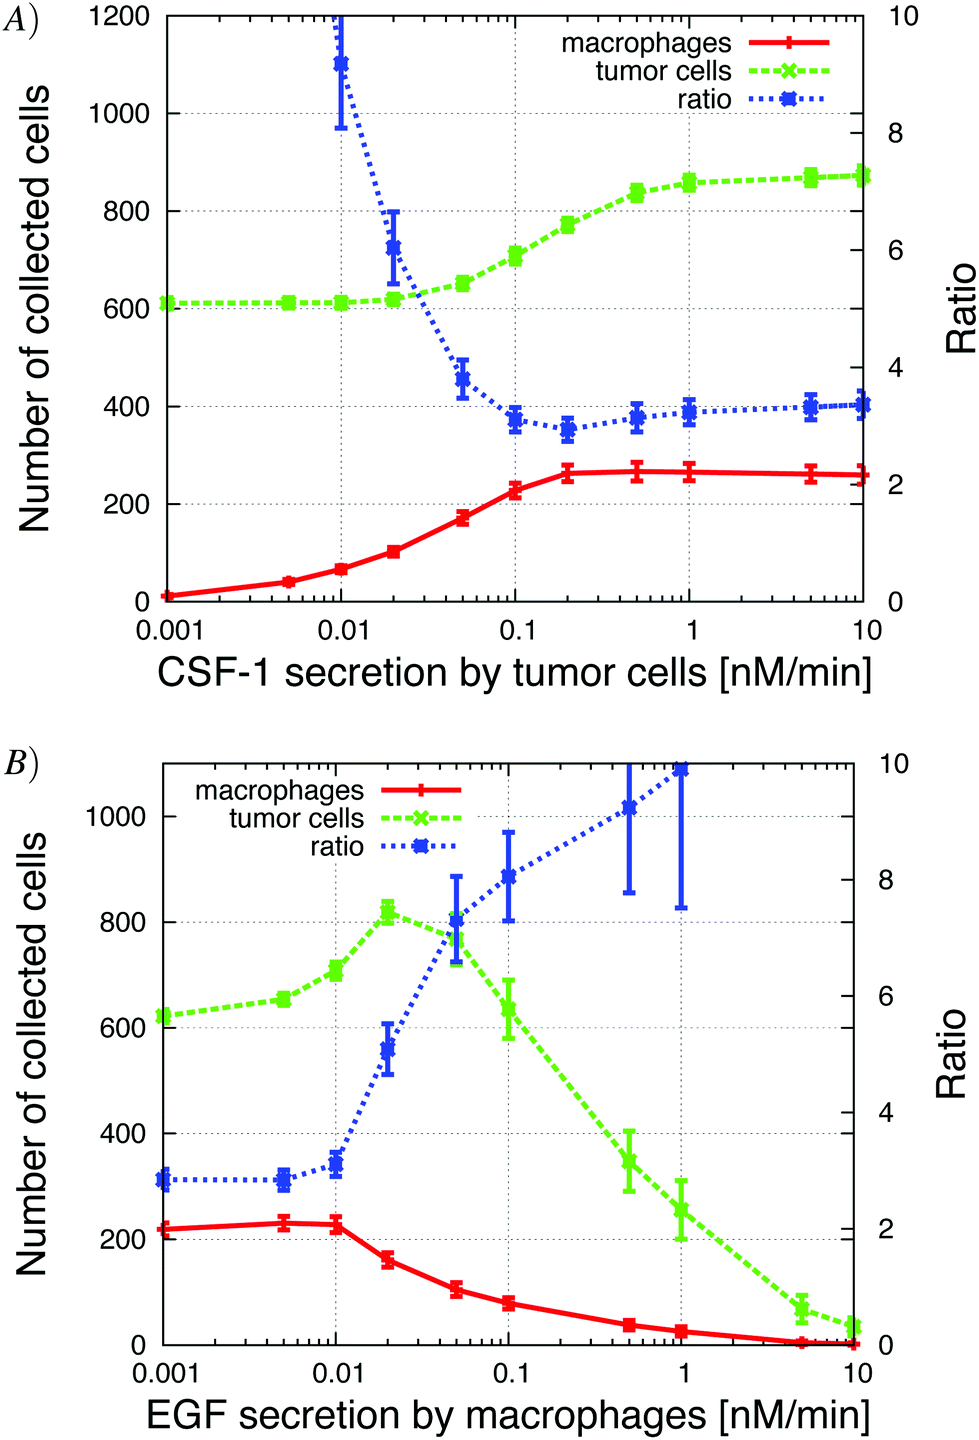 | ||
| Fig. 9 (A) Increasing CSF-1 secretion by tumor cells resulted in more tumor cells and macrophages collected in the needle. At the same time, the tumor cell/macrophage ratio decreased and settled at around 3. (B) Increasing the EGF secretion by macrophages lead to an initial increase in the number of collected tumor cells (paracrine enhancement), but then the number of collected tumor cells decreased because the tumor cells began to cluster around the macrophages in the simulations. See S7-Movie† for CSF-1 secretion = 1 nM min−1 and S8-Movie† for EGF secretion = 1 nM min−1. | ||
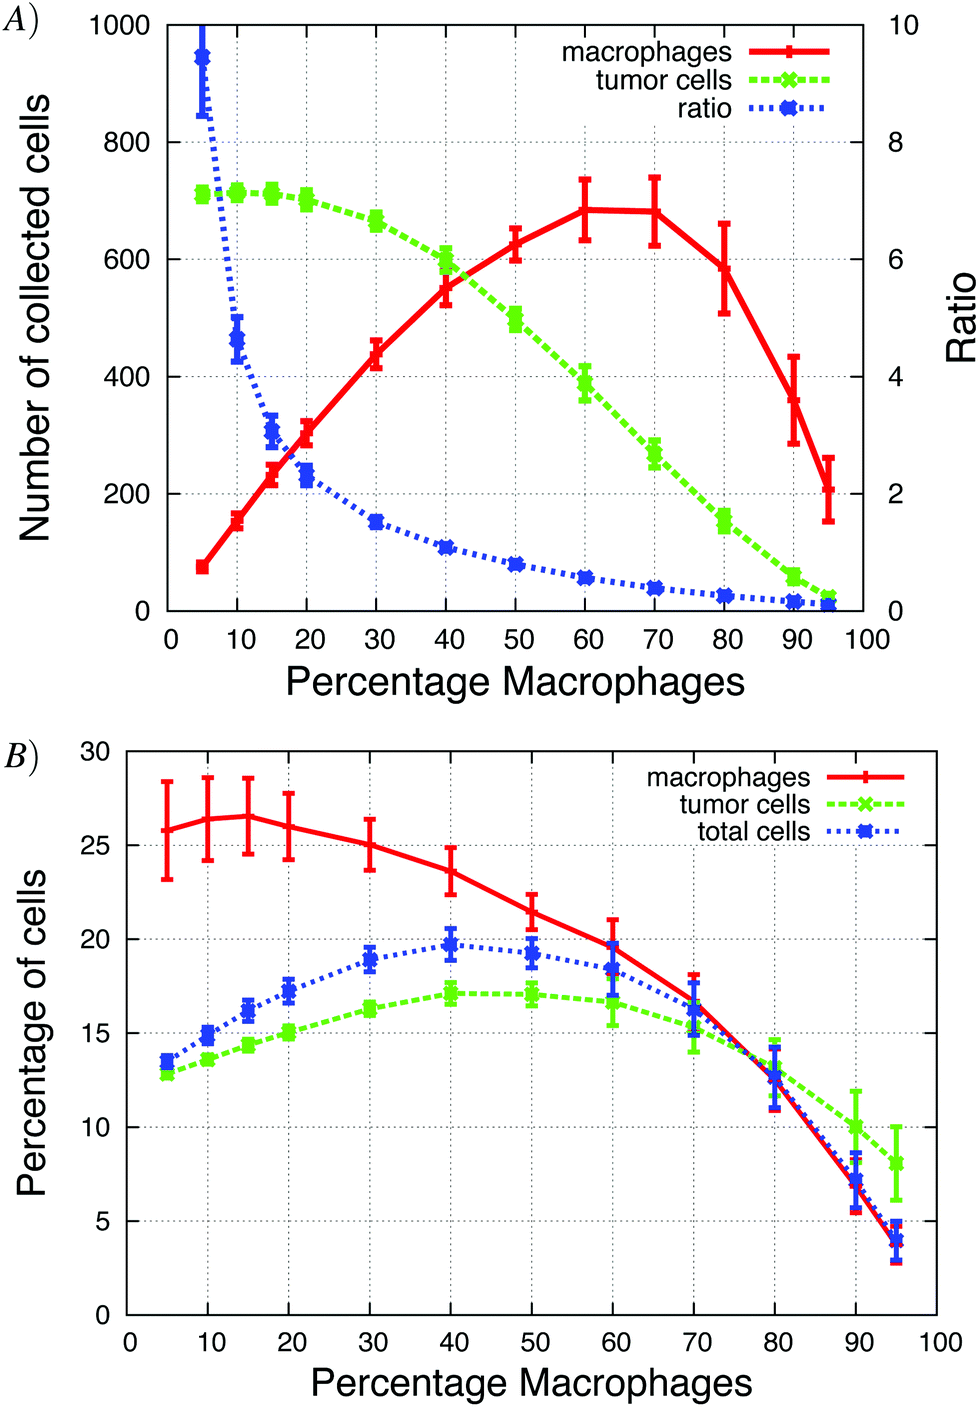 | ||
| Fig. 10 The total number of cells in the simulation was kept constant (5832 total cells) but the fraction of macrophages was changed. (A) When over 40% of the cells were macrophages, more macrophages were collected than tumor cells. As the percentage of macrophages increased, the tumor cell/macrophage ratio decreased. (B) The highest percentage of total cells was collected when 40% of the cells were macrophages. | ||
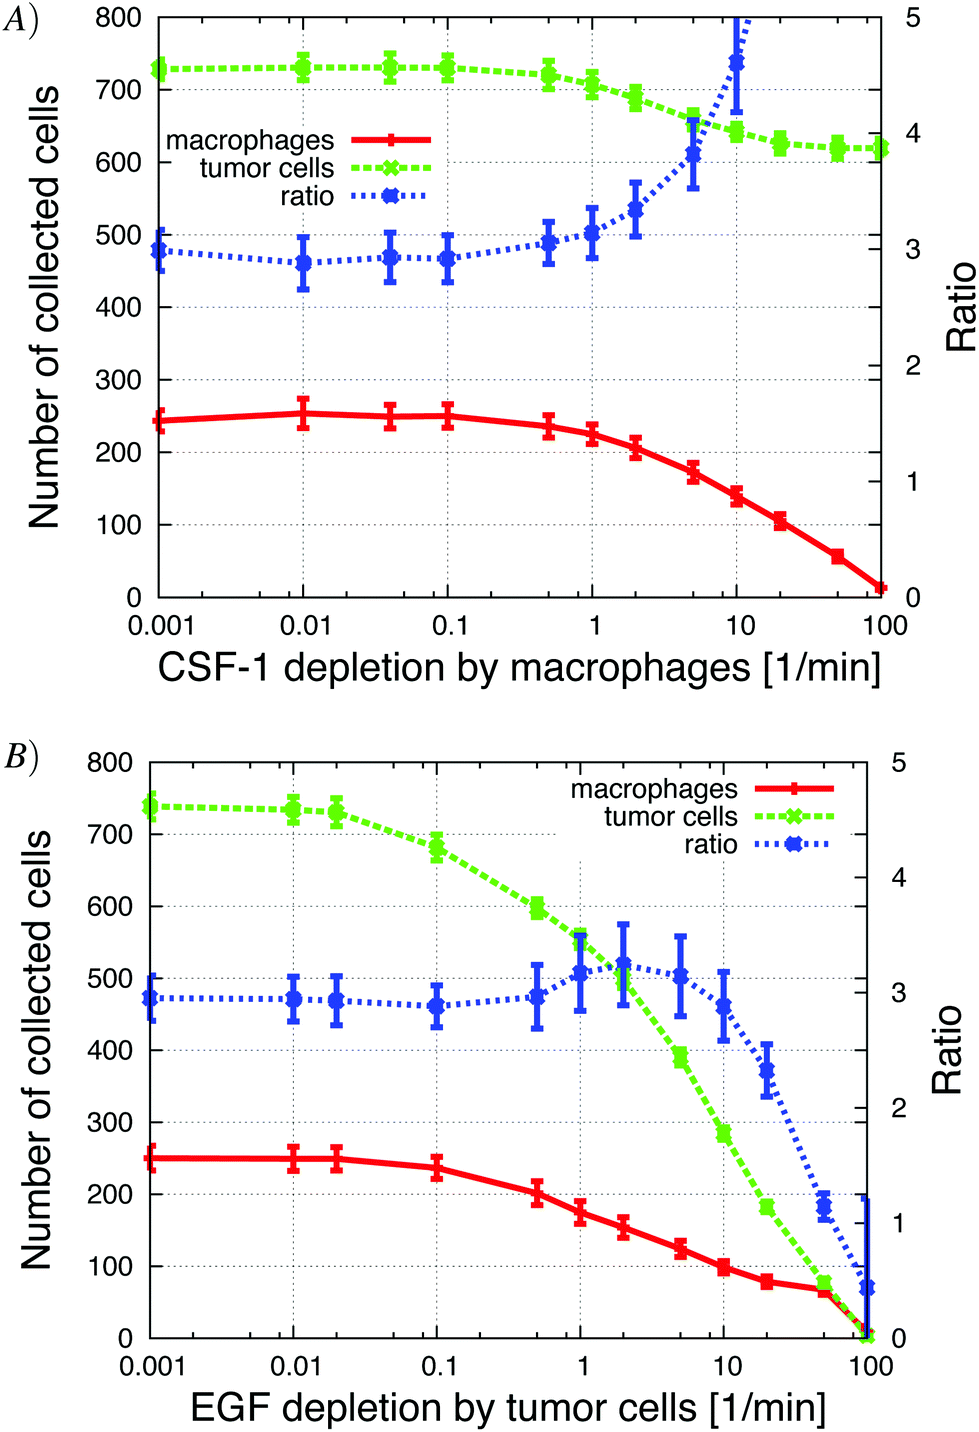 | ||
| Fig. 11 Altering the local depletion of the signaling molecules, in vivo. (A) Increasing the CSF-1 depletion by macrophages caused a decrease in the number of collected tumor cells and macrophages. (B) Increasing the EGF depletion by tumor cells also caused a decrease in the number of collected tumor cells and macrophages until no cells were collected in the needle. | ||
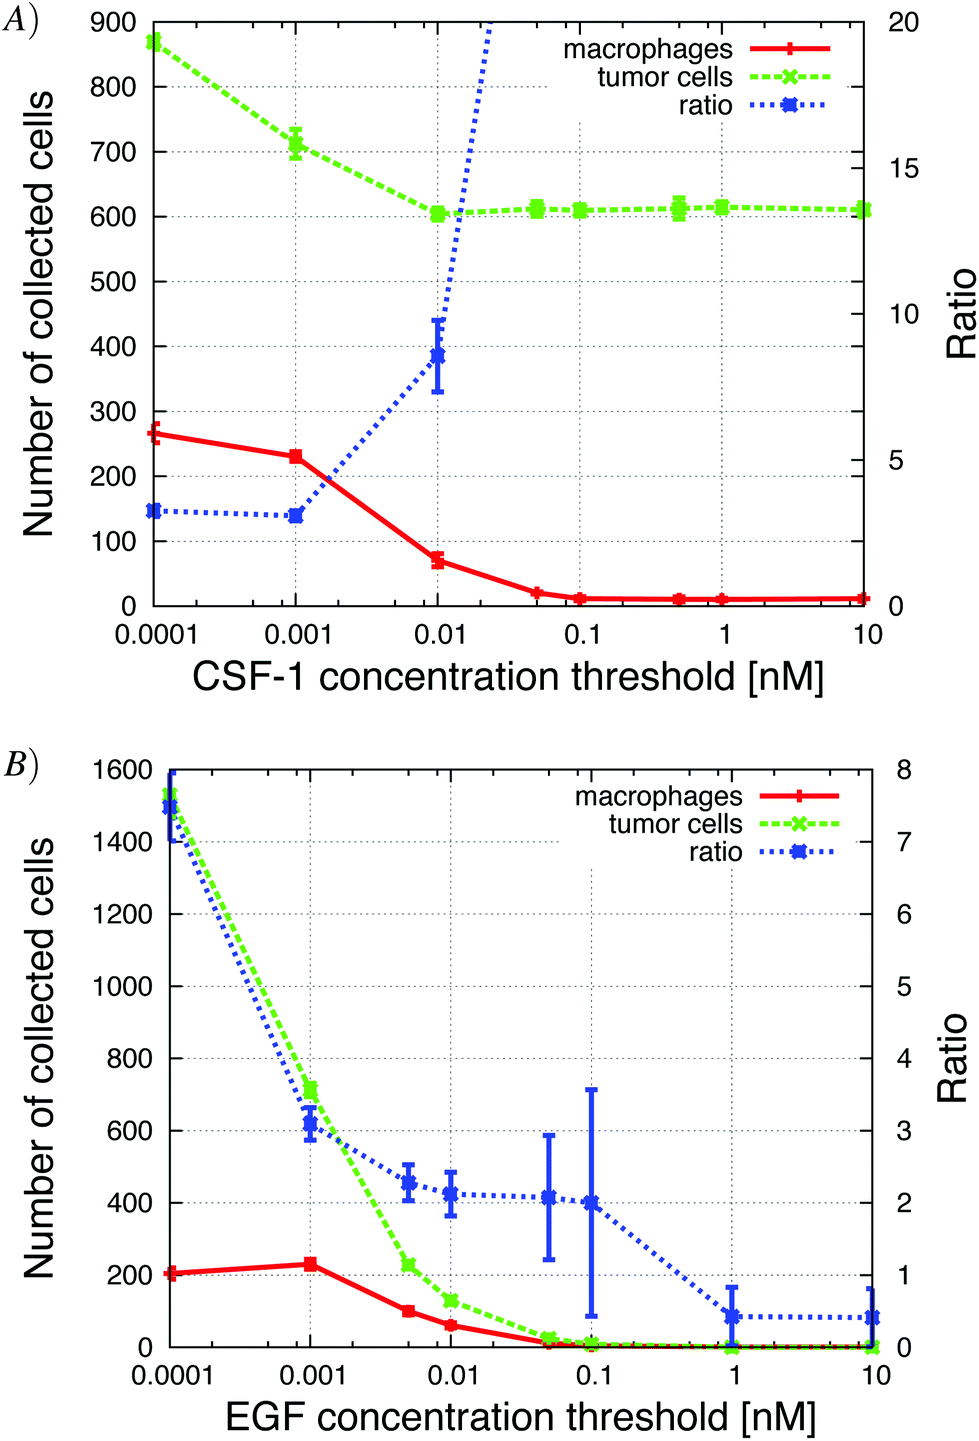 | ||
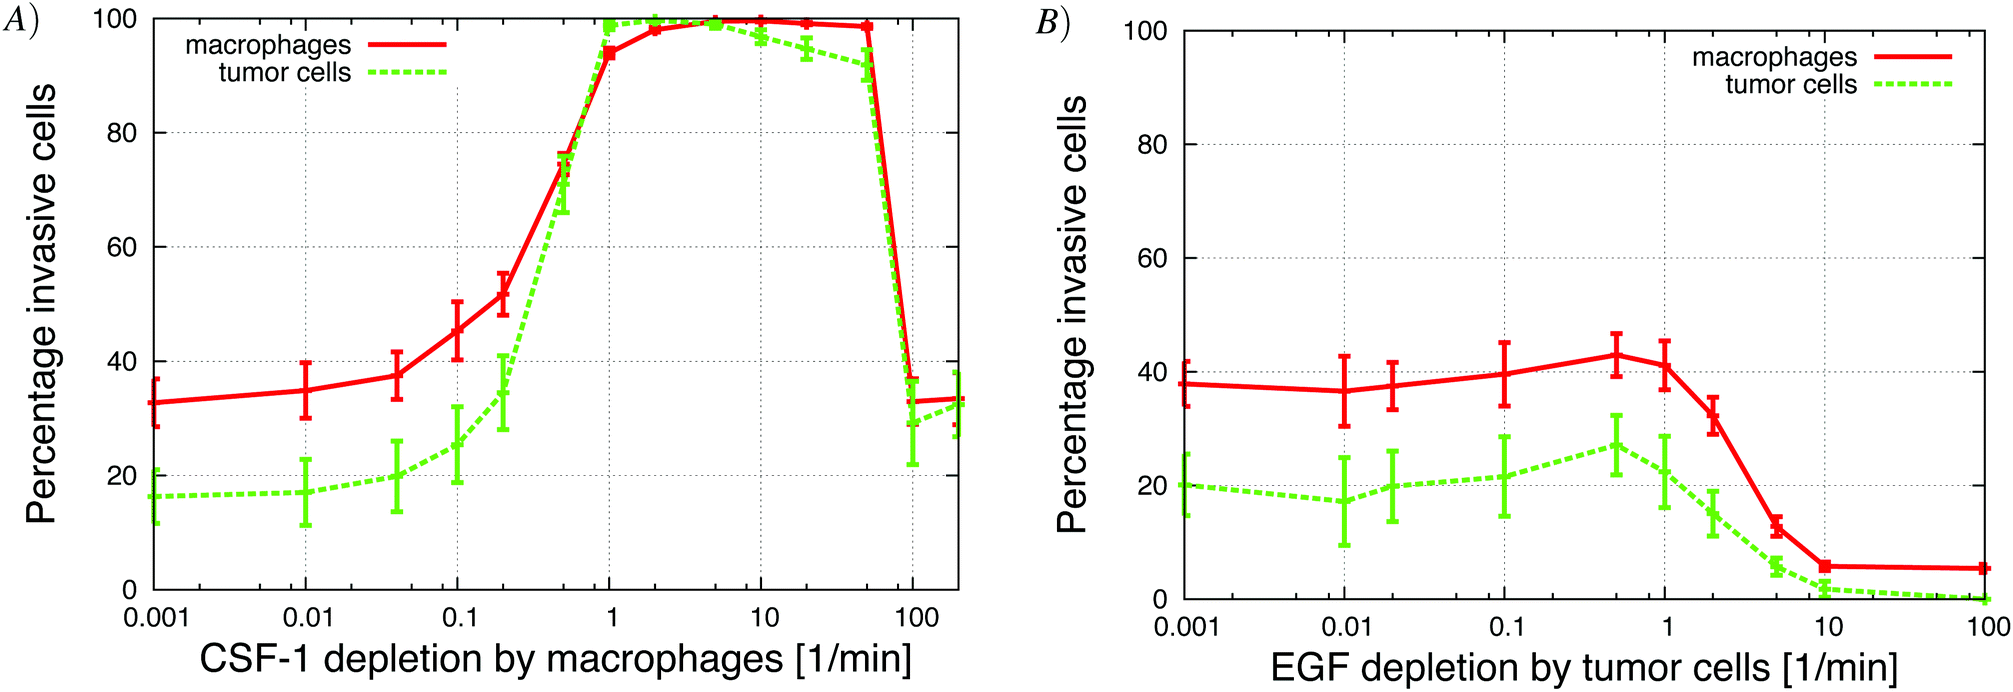
| Fig. 12 The concentration threshold measures the cells' sensitivity to the signal. High sensitivity means low concentration threshold. (A) Increasing the CSF-1 concentration threshold resulted in a decrease in the number of collected macrophages and the number of collected tumor cells decreased to a steady level of 600 cells. This shows the enhancement of the paracrine signaling loop; without the macrophages fewer tumor cells were collected. The tumor cell/macrophage ratio was also sensitive to changes in this parameter. (B) Increasing the EGF detection threshold resulted in a decrease in the number of collected tumor cells and macrophages. If the threshold was above 0.01 nM, no cells were collected. See S10-Movie† for CSF-1 threshold = 0.1 nM. | ||
For the in vivo simulations, we varied many of the same parameters as we did in the in vitro simulations and explored how the number of invasive tumor cells and macrophages changed with different parameter values. When possible we tried to correlate our in vivo simulation results with those from the in vitro simulations. We also determined how the ratio of tumor cells to macrophages was affected. Wyckoff et al.1 found that the average ratio of collected tumor cells and macrophages was 3 tumor cells per 1 macrophage. This ratio seemed to be robust for different cell lines used in the experiments.
Changing EGF and CSF-1 secretion in vivo
Our first step was to look at how changes in EGF and CSF-1 secretion affected the ratio and number of collected cells. At low tumor cell CSF-1 secretion levels, no macrophages were collected and tumor cells moved independently towards the needle, because in the in vivo setup, the EGF gradient from the needle was not disrupted by EGF buildup at the boundary. Contrast this to the observations for the in vitro setup, where the “no-flux boundary effect” resulted in a flat CSF-1 concentration profile at the bottom of the plate (Fig. 5) and very few macrophages chemotacted towards the CSF-1 source in absence of tumor cell interaction (Fig. 4). Increasing the CSF-1 secretion resulted in an increase in collected macrophages as expected, but at first this did not significantly affect the number of collected tumor cells (Fig. 9A). As the CSF-1 secretion was increased past 0.03 nM min−1, the number of collected macrophages continued to increase, but now more tumor cells were collected as well. This is the paracrine signaling effect that we noticed in the in vitro simulations as well, where tumor cells followed the EGF secreting macrophages. We refer to this affect as the paracrine enhancement. As the CSF-1 secretion was increased, the tumor cell/macrophage ratio decreased initially until it settled around 3. Further increasing the CSF-1 secretion rate past 1 nM min−1 did not increase the number of collected cells, nor change the ratio.Increasing the EGF secretion to about 0.02 nM min−1 increased the number of collected tumor cells and macrophages (Fig. 9B). Higher EGF secretion rate helped strengthen the tumor cell–macrophage interactions and they moved closer and migrated together towards the needle. The EGF secretion by the macrophages in turn recruited more tumor cells from further away. When the secretion rate was increased further, the EGF signal from the macrophages began to interfere with the EGF signal from the needle and the tumor cells lost directionality until finally, at high enough EGF secretion rates, the local EGF gradient pointed towards the macrophages. At this point the tumor cells and macrophages formed loose aggregates that did not move towards the needle. The tumor cell/macrophage ratio was constant at around 3 for lower EGF secretion rates, but when the secretion exceeded 0.01 nM min−1 the ratio increased rapidly.
Changing the initial fraction of macrophages in vivo
The fraction of macrophages in tumors can vary in both space and time. We explored this in the simulations by altering the percentage of macrophages while keeping the total number of cells constant. Initially, the number of collected macrophages increased, as the fraction of macrophages in the simulations rose and reached a maximum of 700 collected macrophages, when about 60% of the cells were macrophages (Fig. 10A and B). When the macrophage fraction is low, each macrophage is surrounded by tumor cells and has a given probability of being close to a migratory tumor cell. Therefore, the number of macrophages that could follow tumor cells, increased linearly as the fraction of macrophages increased because the number of collected tumor cells remained the same. When the macrophage fraction was higher than 20%, the rate of increase in number of collected macrophages decreased. Although the number of collected tumor cells decreased, the percentage of collected tumor cells increased and reached a maximum at ∼40% macrophage fraction, indicating the existence of an optimal macrophage fraction. The percentage of collected tumor cells increased because as more macrophages migrated towards the needle, more tumor cells could follow the EGF secreting macrophages and the percentage of collected tumor cells increased. This was another good example of the paracrine enhancement that we also noticed in the in vitro simulations (e.g.Fig. 6). Increasing the initial macrophage fraction above 50% resulted in a decline in both number and the fraction of collected tumor cells. The tumor cells were more likely to have several EGF secreting macrophages as close neighbours, and high macrophage densities disrupted the EGF gradient from the needle. The number of collected macrophages continued to rise until at ∼70% initial macrophage fraction where the number of collected macrophages began to decrease. Very few tumor cells were collected when 95% of the active cells were macrophages, but about 200 macrophages were collected and thus the ratio was low.Changing depletion of EGF and CSF-1 in vivo
The global ligand depletion, GLD, represents the natural removal of the ligand, the degradation of the ligand by soluble MMPs and perfusion (removal of ligand from fluid flow). In the in vivo simulations there was enough EGF LLD so that the EGF gradient from the needle did not flatten out when GLD was set to zero. Therefore, increasing the global depletion of EGF and CSF-1 just attenuated the signal strength so fewer tumor cells detected the EGF gradient (those that were closer to the source), and resulted as expected in a continuous reduction in the number of invasive cells (Appendix S2, Fig. S-5†). This differs from the in vitro simulations where there was a biphasic response (Appendix S2, Fig. S-2†).The simulations of the in vitro system showed that the invasiveness of the cells was sensitive to changes in the local ligand depletion. Increase in CSF-1 LLD up to 1 min−1 by the macrophages, in the in vivo simulations, did not change the ratio nor number of collected cells (Fig. 11A). When the CSF-1 LLD was increased further, the CSF-1 signal from the tumor cells was depleted faster and often remained below the detection threshold. This resulted in a significant drop in the number of collected macrophages because they could no longer follow the tumor cells. As a consequence, the number of collected tumor cells also decreased because fewer macrophages migrated towards the needle and thus fewer tumor cells were recruited. When the CSF-1 LLD reached 100 min−1, no macrophages were collected and the number of collected tumor cells decreased from 700 to 600. The tumor cell/macrophage ratio remained constant at 3 until the depletion rate reached 1 min−1 at which time the ratio increased rapidly due to the sharp decrease in collection of macrophages.
Increasing the tumor cells' EGF LLD up to 0.08 min−1 had only a slight effect on the ratio and the number of collected cells (Fig. 11B). Further increasing the EGF LLD past 0.1 min−1 resulted in a drop in the number of collected tumor cells and macrophages. For higher EGF LLD, the attenuation of the EGF signal away from the needle was faster, so the tumor cells needed to be closer to the needle to detect EGF above threshold, and hence fewer cells were collected. Naturally, the number of collected macrophages decreased when the number of collected tumor cells decreased. Interestingly, the tumor cell/macrophage ratio remained constant around 3, until the EGF depletion exceeded 10 min−1 at which time the ratio decreased rapidly. This suggests robustness of the ratio to changes in LLD.
Changing the EGF and CSF-1 concentration detection thresholds in vivo
The sensitivity of the tumor cells/macrophages to EGF/CSF-1 is indicated by the concentration threshold. The concentration of EGF/CSF-1 must be above this threshold for cells to both start secreting a signaling molecule and detect gradients. A high concentration threshold indicates that the cell has low sensitivity to the signal. Not surprisingly, as the CSF-1 concentration threshold was increased fewer macrophages were collected in the needle. When the threshold was above 0.1 nM, no macrophages were collected in the needle (Fig. 12). The number of tumor cells collected in the needle also decreased with increasing CSF-1 concentration threshold because with fewer macrophages, the paracrine signaling loop enhancement was reduced. The number of collected tumor cells decreased from 900 to 600. The tumor cell/macrophage ratio remained around 3 when the paracrine loop enhancement was still in effect, but then increased as the number of macrophages collected in the needle decreased to zero. This is a similar result as is observed when tumor cells' CSF-1 secretion was reduced (Fig. 9A) and the number of collected tumor cells decreased from about 900 to 600. Similarly, when the EGF concentration threshold was increased, the number of collected tumor cells decreased rapidly. At first the number of collected macrophages was not affected because there were still plenty of tumor cells that they could follow towards the needle. As the number of collected tumor cells decreased below about 600, the number of collected macrophages began to drop as well. These results were in good qualitative agreement with experiments where the EGF or CSF-1 receptors were blocked with inhibitors (Wyckoff et al.Fig. 61).Increasing the EGF concentration in vivo at the needle opening, allowed the EGF signal to propagate further away from the needle before being depleted below detection threshold. Not surprisingly, in the in vivo simulations we found that more tumor cells were collected as the EGF concentration at the needle was increased (Appendix S2, Fig. S-6†).
Discussion
The use of computational models in cancer research has been on the rise. Computational models are very valuable when testing hypotheses for systems with a high number of cells that interact both mechanically and chemically. Models are used both to guide experimental design and suggest treatment methods. In a review paper by Chakrabarti et al.27 continuous, discrete and hybrid approaches to cancer cell modeling are compared. The authors focus on multi-scale models with various size and time scales and both bottom-up and top-down approaches are considered. The review also lists advantages and shortcomings of these different approaches. For good review articles on cancer modeling see ref. 28, 29. To the best of our knowledge, there are no other individual cell models that have explored the paracrine signaling between tumor cells and macrophages and looked at how to disrupt the invasion of tumor cells. We have published a previous model on the paracrine signaling.24 The Knutsdottir et al. paper focused on the analysis of 1-D continuum equations, describing the EGF–CSF-1 paracrine signaling and chemotaxis, to determine the parameter regime where aggregation could occur. The same 3-D simulation framework described in this paper was used to verify the predicted aggregation in 2-D. However, no simulations have previously been conducted to capture and understand the migration patterns observed in the in vitro and in vivo experimental setups described in this paper.Here we have used a simplified model of the paracrine signaling between tumor cells and macrophages to explore how this signaling system influences motility of both tumor cells and macrophages. Given the number of different parameters involved in the signaling, a modeling approach is well suited to aid in understanding how those parameters influence the number of invasive cells. The model simulations demonstrated that the paracrine signaling was sufficient for both tumor cells and macrophages to co-migrate towards a signal source regardless of whether that source was EGF or CSF-1. The simulations also showed how the paracrine signaling enhanced the invasion of tumor cells and macrophages, both in vitro and in vivo (the paracrine enhancement). This can clearly be seen for instance in Fig. 6B, 9A and 11A. We showed how changes in the various parameters affected the number of invasive or collected cells as well as the tumor cell/macrophage ratio. In general, our simulations matched qualitatively well with both the in vitro4 and in vivo1 experiments.
In most signaling systems, degradation of the signal is important to avoid over-saturation. There is in general an optimal degradation that maximizes the signaling effect. We found this to be true in our simulations as well. Increasing the degradation up to an optimum resulted in a higher number of cells that invaded, but past that point further increase in degradation resulted in a drop in the number of invasive cells. At very high degradation rates, no cells invaded. This over-saturation effect was much more pronounced in the in vitro simulations because of the no-flux boundary conditions and a different geometry.
In the in vitro simulations, we noticed that when the EGF signal was turned off, or if no tumor cells were present, the macrophages did not become invasive (Fig. 4 and 6). This agreed with the in vitro experiments, (see Fig. 2 in Goswami et al.4) where the authors postulated that the tumor cells were needed to somehow activate the macrophages. We wanted to understand why the macrophages in our simulations, did not invade without tumor cells, when the signal from the top was CSF-1. As discussed in the Results, the macrophages could not invade without the tumor cell interactions because of the no-flux boundary condition that created a flat CSF-1 profile at the bottom boundary layer. In the in vitro simulations, the tumor cell–macrophage interactions increased the macrophages' motion, which helped them get out of the boundary layer. With flux at the boundary or increased random motion, the macrophages did invade alone (Fig. 4). This possibility could be verified experimentally by placing macrophages without tumor cells on top of a very thick agar layer instead of on the bottom of the petri dish, and then determine if a higher number of macrophages invade. This no-flux boundary was not an issue in the in vivo simulations because of different geometry.
The ratio of collected tumor cells to macrophages in vivo remained robust for some parameters over a wide range but was quite sensitive to a few parameters. The ratio was robust for over one order of magnitude for both CSF-1 and EGF secretion rates as well as for both local and global depletion of CSF-1 and EGF. However, the ratio was sensitive to EGF concentration in the needle and to the initial percentage of macrophages. Wyckoff et al.1 reported a ratio of collected tumor cells to macrophages of 3 in the in vivo experiments, but they did not report how changes in the EGF in the needle affected the ratio and there was no mention of whether the macrophage percentage varied in their experiments.
In tumors with CSF-1 deficient tumor cells, the number of macrophages was much lower, there was a significant drop in number of collected cells and the tumor cell/macrophage ratio increased to 15 compared to control (see Fig. 5 in Wyckoff et al.1). Our simulations showed the same trend (Fig. 9): a significant reduction in CSF-1 secretion, or lower initial fraction of macrophages, resulted in a drop in the number of collected cells and an increase in the tumor cell/macrophage ratio.
The in vitro simulations showed that fewer tumor cells invaded when increasing either EGF or CSF-1 detection threshold. These results compared well with experimental results where drugs, such as receptor blockers, were used, assuming that increasing the detection threshold corresponds to blocking ligand receptors. When the EGFR blocker IRESSA or CSF1R antibody was added to the in vitro experiments with MTLn3 cells. The number of invasive tumor cells dropped by 75% and 80%, respectively, relative to the control (see Fig. 3 and 5 in Goswami et al.4). The in vivo experiments were also repeated with different receptor blockers.1 When the PD15035 EGF receptor inhibitor was added, no cells were collected in the needle. This is comparable to our results from Fig. 12B showing that increasing the EGF detection threshold for tumor cells reduced the number of both collected tumor cells and macrophages. Using a CSF-1 receptor blocker instead resulted in a decrease in the number of collected tumor cells by 50% and no macrophages were collected. In our simulations we observed the same trend when the macrophage's detection threshold was increased. The number of collected macrophages dropped to zero and the number of tumor cells dropped by 32% (Fig. 12A), in good agreement with published experimental results (see Fig. 6 in Wyckoff et al.).
Tumor cells with the MenaINV expression respond to EGF at concentration levels that are almost 2× lower than tumor cells with Mena11a and produce a four-fold larger CSF-1 mRNA expression (Fig. 2 in Roussos15). At a concentration of 1 nM EGF, about 500 MenaINV cells are collected and about 150 Mena11a cells.15 Our simulations showed that a 25 fold drop in EGF sensitivity resulted in a reduction in the number of collected tumor cells from about 1500 to 400 (Fig. S-3B†) and a reduction in CSF-1 secretion also reduced the number of collected cells (Fig. 9). These simulation results match experimental findings and suggest that the observed difference in invasiveness of Mena11a and MenaINV tumor cells can be explained by differences in EFG sensitivity and/or in CSF-1 secretion.
Overall our simulations compared quite well with the experimental findings and gave us confidence moving forward. Systematically varying the parameters in the simulations allowed us to predict what effect changes in those parameters would have on the number of invasive/collected tumor cells and macrophages. Many parameters in the model had to be estimated, so our model findings are qualitative rather than precisely quantitative, and describe trends when parameters are changed.
Suggested experiments based on our model findings
To gain further confidence and to help both improve the computational model and our understanding of the effect of the EGF/CSF-1 paracrine signaling, our predictions will need to be tested in experiments. Following are a few suggestions of experiments that could be conducted to verify the modeling results:• Explore the effects of the no-flux boundary condition by changing the in vitro experimental setup to allow flux at the boundary. One way to do this is to plate the macrophages on top of a thick diffusive agar layer instead of on the bottom of the petri dish. The results could aid in answering the question of whether the macrophages need to be activated by the tumor cells or whether the experimental findings are an artifact of the no-flux boundary condition.
• Use time-lapse imaging to view the motility of both tumor cells and macrophages in the in vitro experimental setup. The imaging would give more information about the proximity of the two cell types during migration as well as the motility patterns. Collecting this data would take advantage of the visual aspect of the model where we can watch 3-D movies of the cell movements in the simulations and compare them to the experimental recordings. In our simulations, the two cell types often seemed to move in pairs (Fig. 2).
• Perform in vitro and in vivo experiments with a mutant cancer cell line that has either an increased or decreased local depletion rate and compare to our simulation results. Our results suggest that the local depletion plays a key role in the observed migration patterns and this experiment could validate those results.
• The in vitro experiments could be repeated with different initial percentages of macrophages for the same total cell density. Our results suggest that the fraction of invasive tumor cells is highest when the initial macrophage fraction is 40%. Our simulations also showed that this optimal macrophage fraction was similar for both the in vitro and in vivo simulations. In the experiments, that percentage may not be exactly the same. However, there should be an ideal macrophage fraction that leads to a maximum number of cells collected and the results will help us fine-tune the model.
• Use a cancer cell line that secretes more CSF-1. This would presumably increase the density of macrophages at the tumor site and also affect the signaling. Our results suggest that increasing the density of macrophages past optimal density would result in fewer collected tumor cells. These experiments would give us an indication of whether reducing or increasing CSF-1 concentration in the tumor can reduce the number of tumor cells that eventually metastasize.
Future enhancements of the model
Future modifications of our model will be geared to better capture the finer details of the signaling system and the observed behaviours of the cells. One enhancement would be to include non-uniform receptor density on the cell surface. This would require keeping track of variations in receptor density around the cell membrane. Likewise, a more detailed description of the signaling system could include more molecular interactions downstream of the receptor. Another important addition might be to include collagen fibres in the extracellular environment in which the cells move. Collagen fibres act as pathways for the tumor cells to crawl along towards a signal gradient from a needle or blood vessels.30 In these simulations, the 3-D capabilities of the model would be of great importance because a cell crawling along a collagen fibre might need to be able to move to another collagen fibre so as to move past other cells, which is not possible in a 2-D simulation. In the present model, the collagen fibres have not been modeled explicitly and here we assume the cells are gaining traction by moving along isotropically oriented collagen fibres.The next step is to model explicitly the isoforms of Mena. This will be done by creating sub-populations of tumor cells, in which tumor cells have a different response to EGF stimulus. Simulations can then be performed with given or variable number of tumor cells in each sub-population. To model the two types of macrophages, PMs and TAMs sub-populations would be created with differences in both signal response and macrophage location. The important role that PMs play in tumor cell intravasation, must also be incorporated.
Conclusions
We used a 3-D individual-cell-based computational framework to study the paracrine signaling loop between macrophages and tumor cells. The objective was to elucidate the role of the paracrine signaling loop in cancer cell invasion. Following is the summary of our computational results:• The paracrine signaling loop is sufficient to reproduce results from both the in vitro and in vivo experiments.
• The paracrine signaling loop increases the migration of both cell types. A clear example of this can be seen in Fig. 9.
• Our results suggest that the migration of the tumor cells was more sensitive to some parameters than others. In vitro, these parameters are the global ligand depletion, the local ligand depletion of EGF and the tumor cell's detection threshold to EGF. In vivo, the same parameters affect the invasion of tumor cells as well as the EGF secretion by macrophages.
• The local depletion of the signaling molecules was an important parameter for tumor cell migration. In vitro, due to the no-flux boundary conditions, both high EGF or high CSF-1 depletion has a dramatic effect on the number of invasive cells (Fig. 7). In vivo, which is more pertinent, high EGF depletion prevents any cell collection. High CSF-1 depletion only prevents macrophages being collected while reducing the number of collected tumor cells (Fig. 11) because it eliminates the paracrine enhancement.
• The 3:1 ratio observed between collected tumor cells and macrophages in the in vivo simulations was robust to changes in many of the parameters and seems to be a property of the paracrine signaling. However, the ratio was sensitive to a few parameters, i.e. changes in initial macrophage fraction and the global ligand depletion. Wyckoff et al.1 reported a consistent ratio around 3:1, for collected tumor cells to macrophages, but they did not report how changes in the EGF in the needle affected the ratio and there was no mention of whether the initial macrophage percentage varied in their experiments. Therefore, at this time the results are not conclusive.
• Cancer cells have been shown to develop resistance to many drug therapies. It is therefore beneficial to identify new agents that could be used for targeted therapy against cancer growth and metastasis. One of the aims of this article was to enhance our understanding of the paracrine signaling between tumor cells and macrophages and discover parameters of that system that could be targeted for cancer treatment.
Our model simulations have shown that blocking either the CSF-1 signal would reduce the number of tumor cells that enter into the blood vessels. It is likely that the paracrine system acts as a relay and amplification system for possibly other signals coming from the blood vessels. This chemotactic signal would reach nearby cells that would then, via the paracrine signaling, reach macrophages or tumor cells further away, propagating deep into the tumor and significantly increase the number of invasive tumor cells. This suggests that disrupting the paracrine signaling could be quite effective. However, in order to extend our results to predict which signal would be the most effective, further knowledge of the signals from the blood vessels is needed. Some potential signaling molecule candidates are Hepatocyte Growth Factor (HGF) and CXCL12 (a chemokine)31,32 but to what degree tumor cells and macrophages chemotact towards them is not known. Model simulations demonstrated (data not shown) that without these chemotactic signals, neither tumor cells nor macrophages would migrate towards the blood vessels. Instead the cells chemotact towards each other, forming small loose aggregates, consisting of both cell types. For instance, if the macrophages predominantly chemotact towards the signal from the blood vessels, then blocking the EGF signal could be very effective (Fig. 7 and S-3†).
TMEMs, which consist of a tumor associated macrophage in direct contact with a tumor cell and an endothelial cell, open up a passage into the blood vessels, for the tumor cells. Therefore, knowing the role that tumor associated macrophages (TAMs) have on the formation and function of TMEMs would give an indication of how important macrophage recruitment (via CSF-1) is on tumor cell intravasation.
Interestingly, because the highest proportion of tumor cells invade at some optimal initial density of macrophages, either increasing or reducing the number of macrophages might reduce the number of tumor cells that intravasate. The knowledge gained from this work on the paracrine signaling suggests that identifying which cell type detects signals from the blood vessel and how the cells respond to that signal, will be instrumental in designing optimal patient treatments.
Acknowledgements
The research was supported by a NSERC grant to E. Palsson and partial computational support by WestGrid (http://www.westgrid.ca) and Compute Canada Calcul Canada and in the later stages by a fellowship grant from the Canadian Breast Cancer Foundation, BC/Yukon to H. Knutsdottir and NSERC grant to L. Edelstein-Keshet. This research was enabled in part by support provided by WestGrid (http://www.westgrid.ca) and Compute Canada Calcul Canada.References
- J. B. Wyckoff, W. Wang, E. Y. Lin, Y. Wang, F. Pixley, E. R. Stanley, T. Graf, J. W. Pollard, J. Segall and J. Condeelis, Cancer Res., 2004, 64, 7022–9 CrossRef CAS PubMed.
- J. B. Wyckoff, Y. Wang, E. Y. Lin, J.-f. Li, S. Goswami, E. R. Stanley, J. E. Segall, J. W. Pollard and J. Condeelis, Cancer Res., 2007, 67, 2649–56 CrossRef CAS.
- J. Condeelis and J. W. Pollard, Cell, 2006, 124, 263–6 CrossRef CAS PubMed.
- S. Goswami, E. Sahai, J. B. Wyckoff, M. Cammer, D. Cox, F. J. Pixley, E. R. Stanley, J. E. Segall and J. S. Condeelis, Cancer Res., 2005, 65, 5278–83 CrossRef CAS.
- C. E. Lewis and J. W. Pollard, Cancer Res., 2006, 66, 605–12 CrossRef CAS.
- A. H. Beck, I. Espinosa, B. Edris, R. Li, K. Montgomery, S. Zhu, S. Varma, R. J. Marinelli, M. van de Rijn and R. B. West, Clin. Cancer Res., 2009, 15, 778–787 CrossRef CAS.
- E. Y. Lin, V. Gouon-Evans, A. V. Nguyen and J. W. Pollard, J. Mammary Gland Biol. Neoplasia, 2002, 7, 147–62 CrossRef.
- E. Y. Lin and J. W. Pollard, Cancer Res., 2007, 67, 5064–5066 CrossRef CAS PubMed.
- P. J. Edelson, R. Zwiebel and Z. A. Cohn, J. Exp. Med., 1975, 142, 1150–1164 CrossRef CAS.
- C. Morgan, J. W. Pollard and E. R. Stanley, J. Cell. Physiol., 1987, 130, 420–427 CrossRef CAS.
- A. S. Harney, E. N. Arwert, D. Entenberg, Y. Wang, P. Guo, B.-Z. Qian, M. H. Oktay, J. W. Pollard, J. G. Jones and J. S. Condeelis, Cancer Discovery, 2015, 5, 932–943 CrossRef CAS PubMed.
- J. Pu, C. D. McCaig, L. Cao, Z. Zhao, J. E. Segall and M. Zhao, J. Cell Sci., 2007, 120, 3395–3403 CrossRef CAS.
- E. R. Andrechek and W. J. Muller, Breast Cancer Res., 2000, 2, 211–6 CrossRef CAS.
- U. Philippar, E. T. Roussos, M. Oser, H. Yamaguchi, H.-D. Kim, S. Giampieri, Y. Wang, S. Goswami, J. B. Wyckoff, D. A. Lauffenburger, E. Sahai, J. S. Condeelis and F. B. Gertler, Dev. Cell, 2008, 15, 813–28 CrossRef CAS.
- E. T. Roussos, M. Balsamo, S. K. Alford, J. B. Wyckoff, B. Gligorijevic, Y. Wang, M. Pozzuto, R. Stobezki, S. Goswami, J. E. Segall, D. A. Lauffenburger, A. R. Bresnick, F. B. Gertler and J. S. Condeelis, J. Cell Sci., 2011, 124, 2120–31 CrossRef CAS.
- E. T. Roussos, S. Goswami, M. Balsamo, Y. Wang, R. Stobezki, E. Adler, B. D. Robinson, J. G. Jones, F. B. Gertler and J. S. Condeelis, et al., Clin. Exp. Metastasis, 2011, 28, 515–527 CrossRef CAS.
- E. Palsson, J. Theor. Biol., 2008, 254, 1–13 CrossRef PubMed.
- R. G. Thorne, S. Hrabětová and C. Nicholson, J. Neurophysiol., 2004, 92, 3471–3481 CrossRef CAS.
- S. E. Webb, J. W. Pollard and G. E. Jones, J. Cell Sci., 1996, 109, 793–803 CAS.
- A. Sorkin and J. E. Duex, Current Protocols in Cell Biol., 2010, 15–14 Search PubMed.
- E. D. Karagiannis and A. S. Popel, J. Biol. Chem., 2004, 279, 39105–39114 CrossRef CAS PubMed.
- F. Boccardo, G. L. Lunardi, A. R. Petti and A. Rubagotti, Breast Cancer Res. Treat., 2003, 79, 17–23 CrossRef CAS.
- S. M. Scholl, R. Lidereau, A. de la Rochefordière, C. C.-S. Le-Nir, V. Mosseri, C. Noguès, P. Pouillart and E. R. Stanley, Breast Cancer Res. Treat., 1996, 39, 275–283 CrossRef CAS.
- H. Knútsdóttir, E. Pálsson and L. Edelstein-Keshet, J. Theor. Biol., 2014, 357, 184–199 CrossRef.
- S. Newman, M. Cloitre, C. Allain, G. Forgacs and D. Beysens, Biopolymers, 1997, 41, 337–347 CrossRef CAS.
- L. Shen and Z. Chen, Chem. Eng. Sci., 2007, 62, 3748–3755 CrossRef CAS.
- A. Chakrabarti, S. Verbridge, A. D. Stroock, C. Fischbach and J. D. Varner, Ann. Biomed. Eng., 2012, 40, 2488–2500 CrossRef.
- K. A. Rejniak and A. R. Anderson, Wiley Interdiscip. Rev.: Syst. Biol. Med., 2011, 3, 115–125 CrossRef CAS PubMed.
- H. Byrne and D. Drasdo, Journal of Mathematical Biology, 2009, 58, 657–687 CrossRef.
- K. Wolf, S. Alexander, V. Schacht, L. M. Coussens, U. H. von Andrian, J. van Rheenen, E. Deryugina and P. Friedl, Seminars in Cell & Developmental Biology, 2009, pp. 931–941 Search PubMed.
- L. Hernandez, M. Magalhaes, S. J. Coniglio, J. S. Condeelis and J. E. Segall, et al., Breast Cancer Res., 2011, 13, R128 CrossRef CAS.
- A. Spina, V. De Pasquale, G. Cerulo, P. Cocchiaro, R. Della Morte, L. Avallone and L. M. Pavone, Biomedicines, 2015, 3, 71–88 CrossRef.
Footnote |
| † Electronic supplementary information (ESI) available. See DOI: 10.1039/c5ib00201j |
| This journal is © The Royal Society of Chemistry 2016 |